3640
Quantitative Comparison of 6 different Diffusion Weighted Imaging Approaches using NIST Diffusion Phantom1Medical College of Wisconsin, Milwaukee, WI, United States, 2GE Healthcare, Waukesha, WI, United States
Synopsis
The application of diffusion weighted imaging (DWI) is rapidly increasing in musculoskeletal system. DWI is useful in imaging diverse range of musculoskeletal pathologies like soft-tissue tumors, bone lesions, vertebral fractures pre and post treatment follow up. In this work, our goal is to quantitatively compare the accuracy of ADC estimation of EPI, and PROPELLER based techniques. We also optimize the imaging parameters for PROPELLER and MSI-PROPELLER techniques and provide a correction method to improve the accuracy of ADC estimation.
Introduction
The application of diffusion weighted imaging (DWI) is rapidly increasing in musculoskeletal imaging[1]. DWI is used in the differentiation between vertebral compression fractures vs. malignant fractures[2], assessment of degenerative changes and structural integrity in spine[3], and characterization of soft-tissue and bone tumors[4]. While there are multiple DWI approaches - Single shot echo planar imaging (SS-EPI), Reduced FOV (rFOV) echo planar imaging, Multi-shot echo planar imaging (MUSE), Multiband EPI, and PROPELLER – PROPELLER is most suited to image near metal. The PROPELLER technique evaluated is not a commercial product and was locally developed at out institution. Recently, multi-spectral(MSI) DWI using PROPELLER was introduced for DWI near metal[5]. In this work, our goal is to quantitatively compare the accuracy of ADC estimation in these 6 techniques in a NIST phantom without a metal implant. We also optimize the imaging parameters for both the PROPELLER based techniques and provide a correction method to improve the accuracy of ADC estimation.Methods
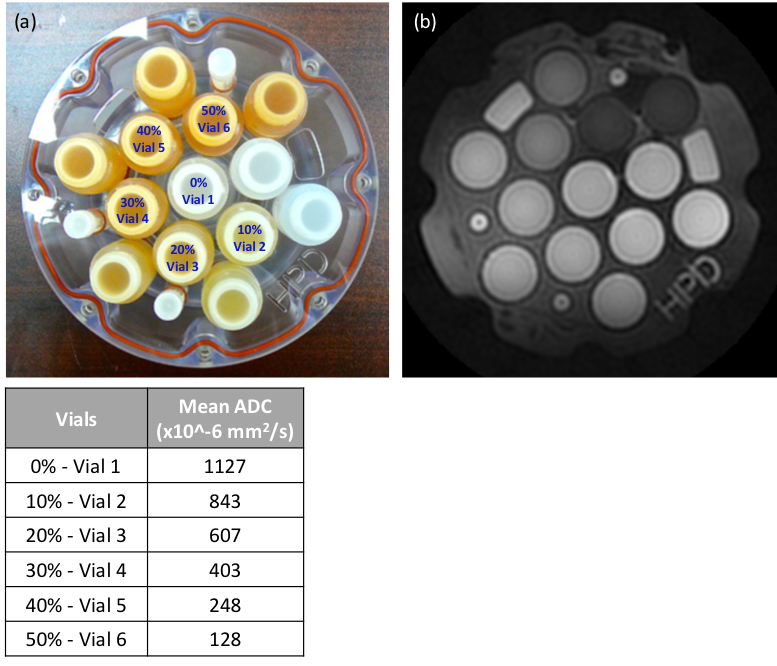
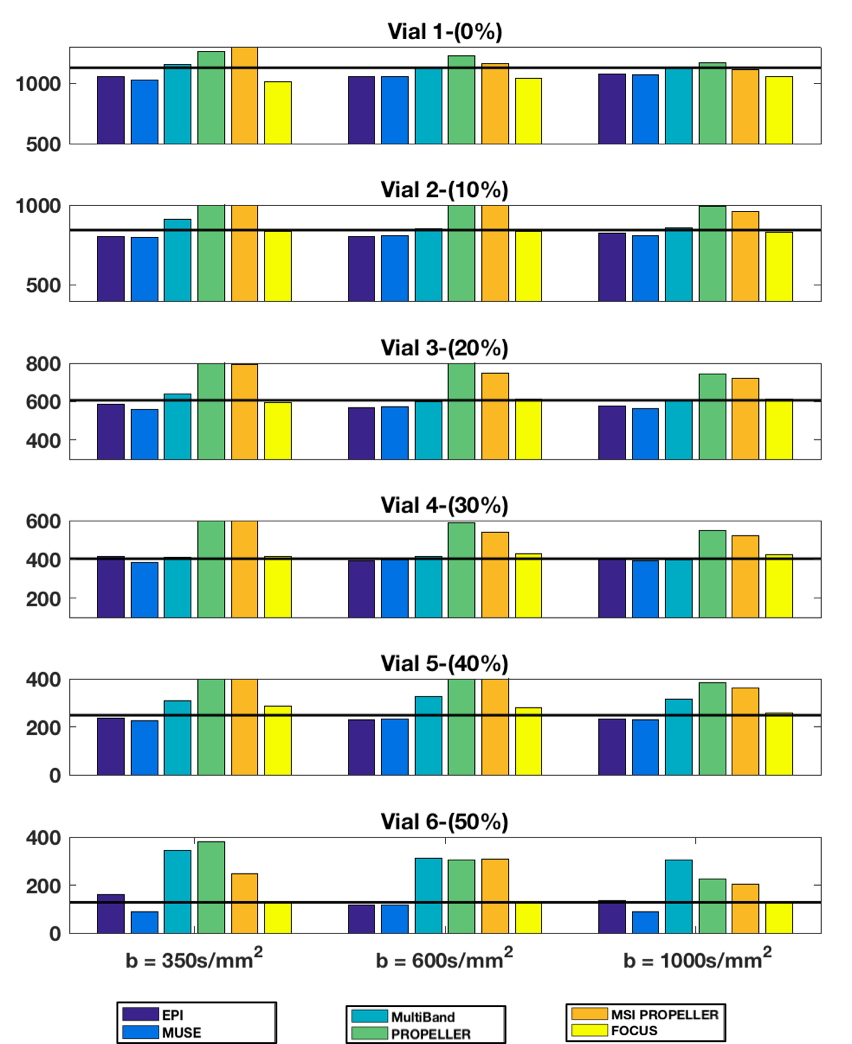
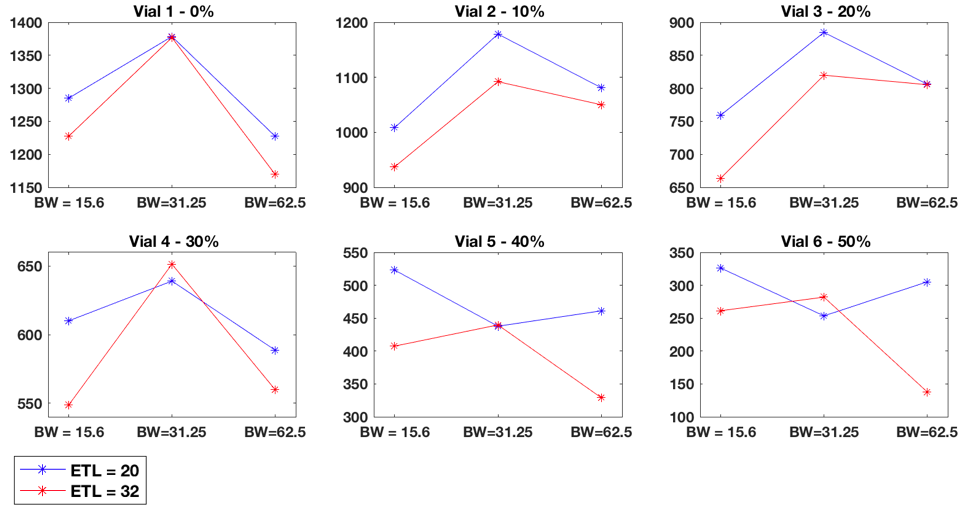
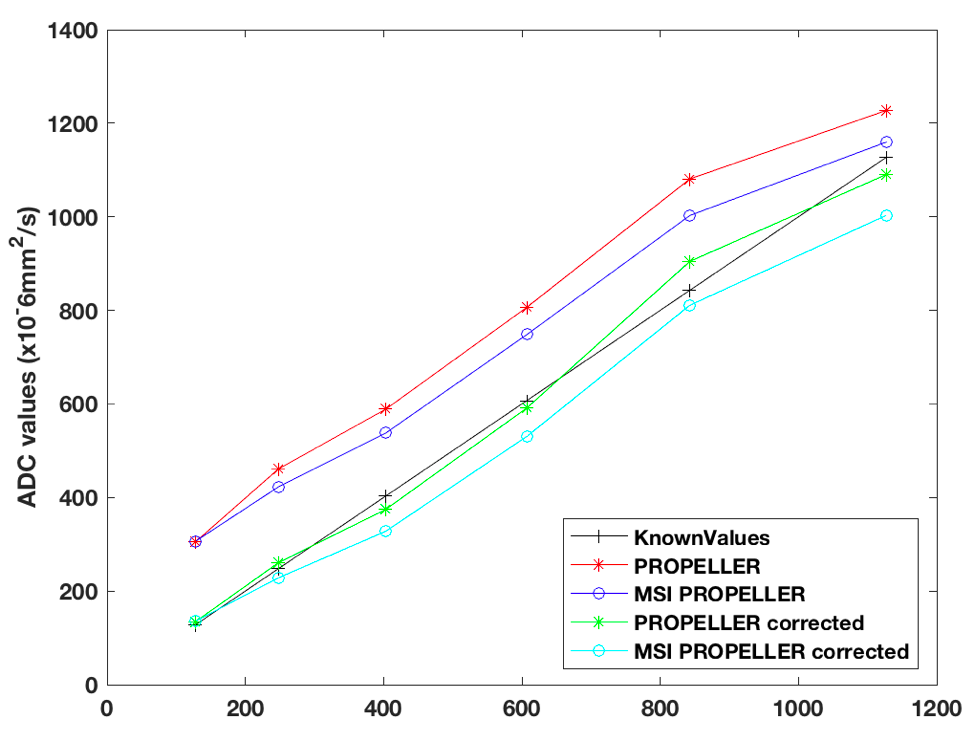
The experiments were performed on the GE Premier 3T MRI scanner using the NIST diffusion phantom shown in Fig 1. The NIST phantom contains vials filled with aqueous solutions of polymer at 0%, 10%, 20%, 30%, 40% and 50% concentrations with known ADC values given in Fig 1. The imaging parameters under consideration were echo train length(ETL), bandwidth(BW), and b-values. All the 6 techniques had the following acquisition parameters: FOV=22cm, matrix size=128x128, 25 slices with slice thickness=4mm and slice gap=1mm, ETL=20, BW=62.5kHz, TR=4s and 3 diffusion directions. 3 spectral bins were acquired for the MSI-PROPELLER technique. Three acquisitions were collected each corresponding to one of three b-values =350s/mm2, 600s/mm2, 1000s/mm2. The refocusing FA=125o was used for both the PROPELLER techniques. Additional data was acquired with ETL=32, BW=15.6kHz and 31.25kHz for both the PROPELLER based techniques for optimization of these parameters. For this experiment, the b-value of 600s/mm2 was used. The ADC maps were calculated using a mono-exponential fit. The mean ADC was calculated in 9mm2 circular regions of interest (ROI) in 6 vials as shown in Fig 1a. A polynomial curve fitting method was used to correct for the elevated ADC values for PROPELLER based methods. The weighting function was calculated by fitting the measured data to the known values. A lookup table was populated with correction parameters for each b-value.Results
Fig 2. shows the bar chart with comparison of ADC values for all the 6 techniques for all vials. The black line denotes the known ADC values for each vial. The SS-EPI and FOCUS techniques have the most optimal performance. We see that the PROPELLER and MSI-PROPELLER techniques have elevated ADCs as compared to the other methods. Also, the error in the ADC values for both the PROPELLER techniques increase with the decrease in the signal intensity. This could be attributed to the low signal to noise ratio in the PROPELLER techniques as compared to EPI based methods. Also, the EPI based methods account for concomitant gradients at lower b-values during diffusion gradient calculations, which is not the case with PROPELLER techniques. The elevated ADC are an effect of CPMG leakage. Fig 3 shows the effect of ETL and BW on PROPELLER technique. There is a tradeoff between the minimum achievable echo time and the signal to noise ratio when choosing the bandwidth. The optimal performance for vials with low signal (vials 5 and 6) is seen at BW=62.5kHz, whereas other vials have similar or better performance at BW=15.6kHz. The optimal performance is obtained for an ETL=32. A 2nd degree polynomial was used to correct the ADC values based on the known values as shown in Fig 4. The fit has R-square value of 0.9948. The slight reduction in ADC in MSI-PROPELLER as compared to PROPELLER can be attributed to the conventional sum of squares spectral bin combination.Discussion
While the SS-EPI and FOCUS techniques provide optimal results, they lack the ability to image near metal due to severe susceptibility artifacts. The variability in the results for different b-values observed in the PROPELLER based techniques can be reduced by accounting for concomitant gradients at lower b-values as done in the EPI based methods. Since the PROPELLER based techniques have multi-shot acquisitions, an improved phase correction algorithm can reduce the artifacts and increase SNR. An improved spectral bin combination can improve the accuracy of MSI-PROPELLER.Conclusion
In this work, we compared the different EPI and PROPELLER based techniques for their accuracy in ADC estimation. We further identified the optimal acquisition parameters and proposed a correction strategy to compensate for the elevated ADCs resulting from CPMG leakage.Acknowledgements
Research reported in this publication was supported by NIH R21EB023415-01A1. The content is solely the responsibility of the authors and does not necessarily represent the official views of the NIH.References
[1] Bhojwani, N., Szpakowski, P., Partovi, S., Maurer, M. H., Grosse, U., von Tengg-Kobligk, H., ... & Robbin, M. R. (2015). Diffusion-weighted imaging in musculoskeletal radiology—clinical applications and future directions. Quantitative imaging in medicine and surgery, 5(5), 740.
[2] Baur, A., Stäbler, A., Brüning, R., Bartl, R., Krödel, A., Reiser, M., & Deimling, M. (1998). Diffusion-weighted MR imaging of bone marrow: differentiation of benign versus pathologic compression fractures. Radiology, 207(2), 349-356. [
3] Kealey, S. M., Aho, T., Delong, D., Barboriak, D. P., Provenzale, J. M., & Eastwood, J. D. (2005). Assessment of apparent diffusion coefficient in normal and degenerated intervertebral lumbar disks: initial experience. Radiology, 235(2), 569-574.
[4] Yakushiji, T., Oka, K., Sato, H., Yorimitsu, S., Fujimoto, T., Yamashita, Y., & Mizuta, H. (2009). Characterization of chondroblastic osteosarcoma: Gadolinium‐enhanced versus diffusion‐weighted MR imaging. Journal of Magnetic Resonance Imaging: An Official Journal of the International Society for Magnetic Resonance in Medicine, 29(4), 895-900.
[5] Koch, K. M., Bhave, S., Gaddipati, A., Hargreaves, B. A., Gui, D., Peters, R., ... & Kaushik, S. S. (2018). Multispectral diffusion‐weighted imaging near metal implants. Magnetic resonance in medicine, 79(2), 987-993.
Figures