3638
Comparison of dMRI Models for Skeletal Muscle Microstructure Estimation with Numerical Simulations and Porcine Phantom1Mechanical Science and Engineering, Univeristy of Illinois at Urbana Champaign, Urbana, IL, United States, 2Biomedical Engineering, Illinois Institute of Technology, Chicago, IL, United States, 3Beckman Institute for Advanced Science and Technology, Univeristy of Illinois at Urbana Champaign, Urbana, IL, United States, 4Radiology, Carle Foundation Hospital, Urbana, IL, United States, 5Mechanical Science and Engineering, University of Illinois at Urbana Champaign, Urbana, IL, United States
Synopsis
Four models used to estimate skeletal muscle microstructure from
Introduction
Estimating skeletal muscle microstructure from diffusion-weighted MRI (dMRI) requires models which accurately quantify the relationship. While numerically solving the governing equation of dMRI (the Bloch-Torrey equation) is possible, simplifying assumptions are commonly made to express the signal as an analytical function. A common assumption is treating the domain as separate homogenous compartments. Such models have been applied to muscle.1-8 Attractive features of these models are their ability to analytically express the relationship between microstructure and dMRI signal while being physically motivated, thus allowing insight into underlying biophysical processes. However, such models require various assumptions about the underlying microstructure which may invalidate its ability to accurately relate changes in dMRI signal to the correct microstructural parameter. In this abstract we compare four analytical models of skeletal muscle dMRI with a direct numerical solution of the Bloch-Torrey equation to investigate each model’s ability to accurately model microstructural changes.Methods
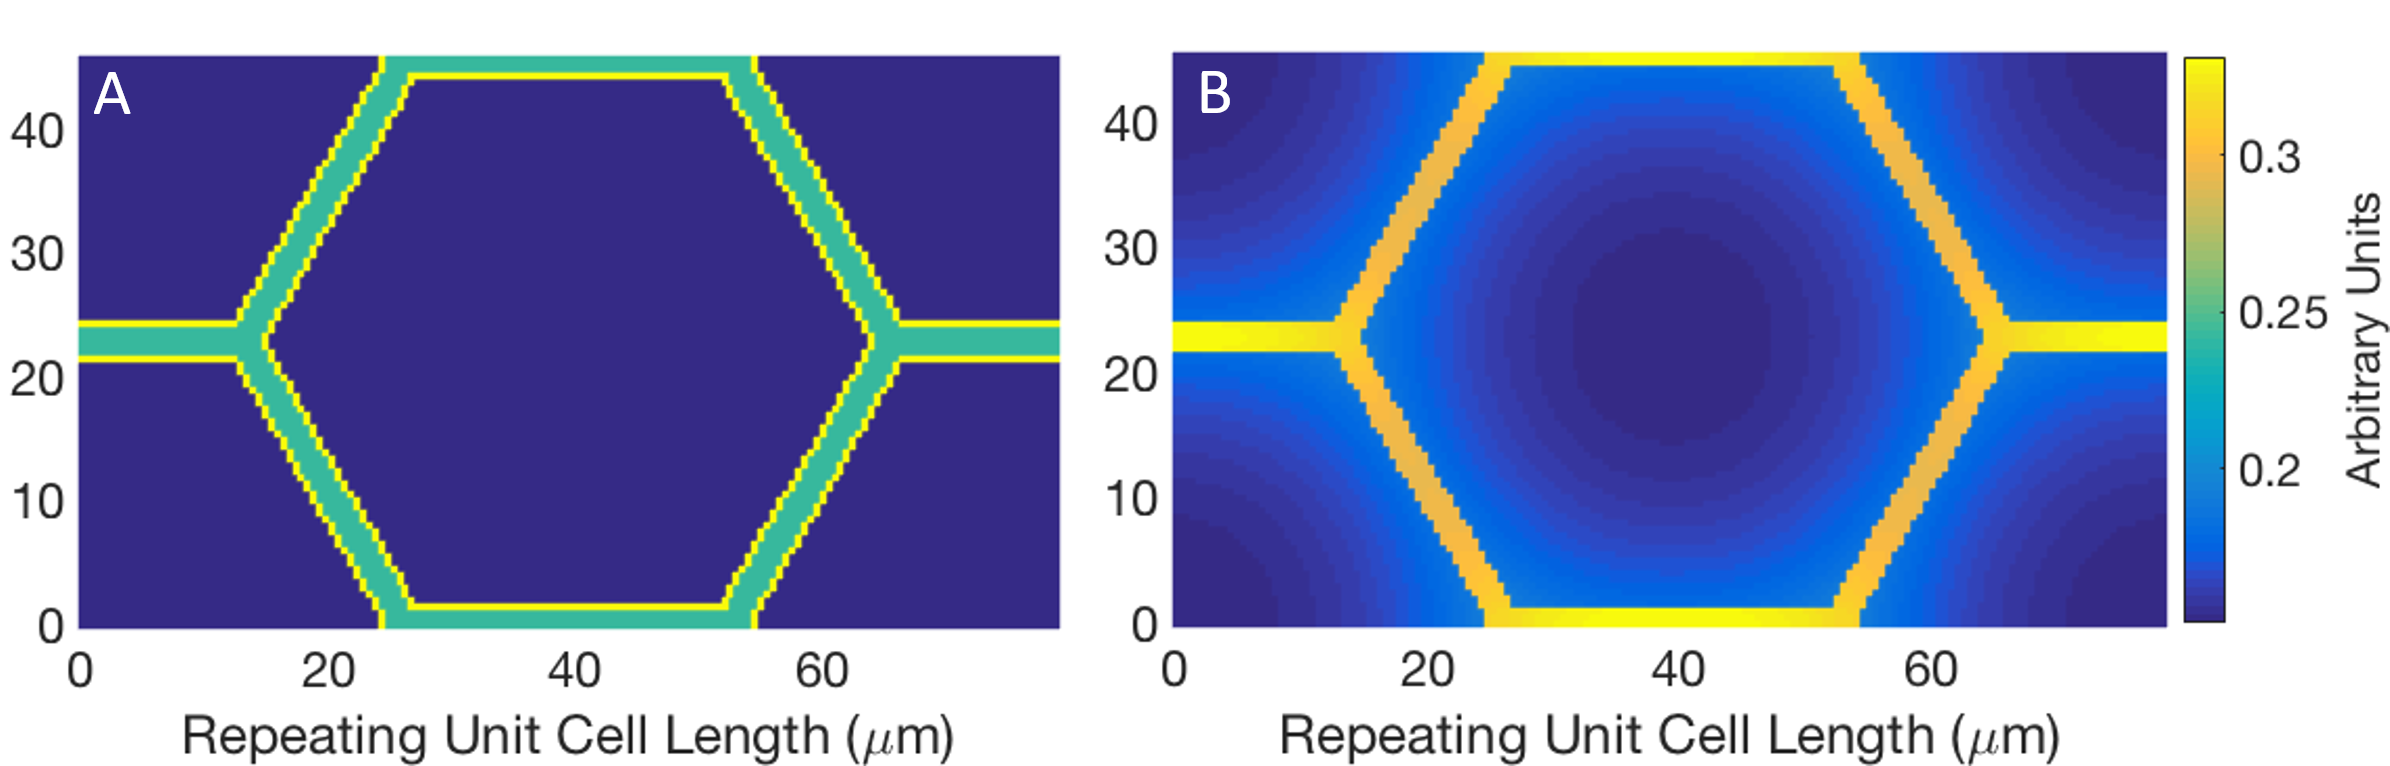
Four different models which have been used in the literature to extract microstructural parameters were created: (1) a two-compartment model with exchange (also known as a Kärger model),1,2 (2) a two-compartment model without exchange,3-5 (3) a one-compartment model,6 and (4) the Random Permeable Barrier Model (RPBM),7,8 each of which have different assumptions and free parameters (Table 2). Using a numerical model based on a Lattice Boltzmann Method solution of the Bloch-Torrey equation,9 dMRI signals were computed on the San Diego Supercomputing Center’s Comet cluster10 over a domain of periodically packed hexagonal cells surrounded by a permeable membrane and embedded in an extracellular matrix (Figure 1). The domain was parameterized by intra- and extracellular diffusion, cell diameter, membrane permeability, and volume fraction. Simulations were performed with a single microstructural parameter varied and all other parameters held constant (Table 1). PGSE sequences were simulated for 5 b-values (500, 750, 1000, 1500, and 2000 s/mm2). At each b-value 5 diffusion times (Δ) were simulated (10, 25, 50, 75 and, 100 ms) with a gradient timing of 7.5 ms and the gradient strength adjusted to maintain a constant b-value. Six gradient directions were used to estimate a diffusion tensor from which fractional anisotropy, apparent diffusion coefficient, and the tensor’s eigenvalues were extracted and used as inputs for the models. The Kärger, 2-compartment and 1-compartment models were fit to the numerical simulations using MATLAB’s finsearch function while the RPBM was fit using nonlinear least squares. As a stand-in for skeletal muscle, experimental diffusion data was acquired from an ex-vivo porcine myocardium phantom imaged with a Siemens 3T TRIO scanner using a monopolar diffusion-weighted sequence with b-values of 800, 1500 and 2500 s/mm2, TR/TE/Δ/δ = 2930/94/44.35/22.93 ms, 2x2x2 mm resolution and 64 gradient directions.Results and Discussion
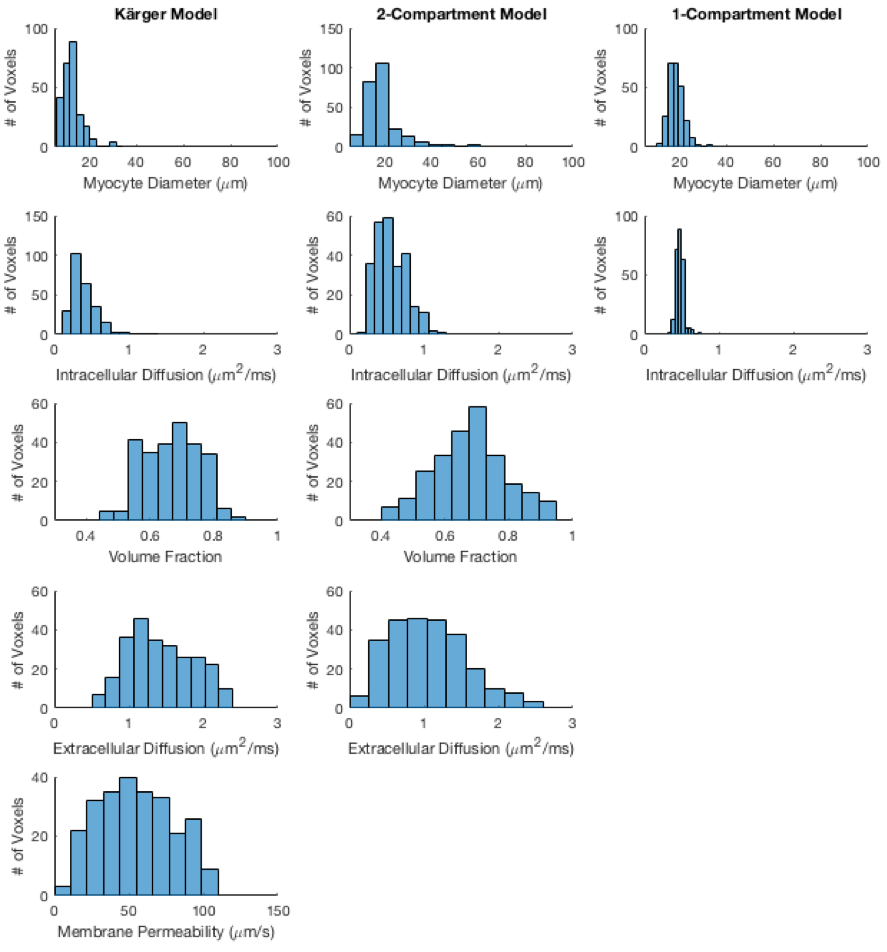
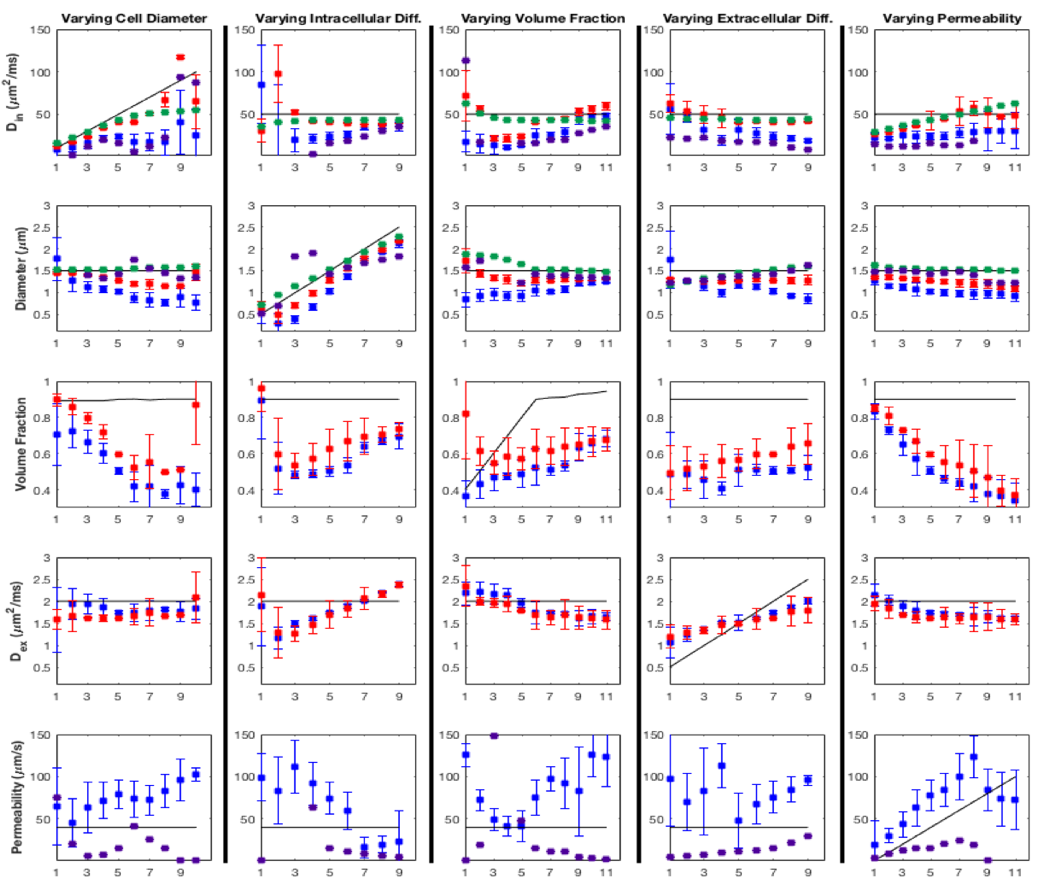
In Figure 2 the models are fit to the phantom data. The models estimate physiologically reasonable microstructural parameters in similar ranges to each other. Figure 3 shows the fit of the models to the numerical data. While the models generally identify the parameter being varied, but also consistently estimate that parameters which were being held constant are instead widely varying. This means that without prior knowledge of which microstructural parameter is changing, it cannot be directly inferred from the model’s results. Diffusion coefficients and cell diameters were the most consistently estimated, however, permeability and volume fraction were often misestimated by 50-100%. These results make two points about the applicability of the examined models. First, though they can estimate reasonable parameters from experimental data, predictions may not be reflective of the underlying microstructure. Second, more complicated models generally do not increase accuracy over simpler models, rather, they add additional free parameters allowing more spurious fits and sensitivity to initial guesses. These two points suggest that researchers should be careful of overinterpreting microstructural parameters estimated from such models, particularly extracellular parameters and demonstrates the need for a muscle-specific microstructural model of dMRI. Finally, the b-values and diffusion times used are taken as ‘typical’ values used in clinical studies, however, RPBM has been applied at longer diffusion times8 which may increase the accuracy of all models, particularly in estimating diameter.Conclusion
We utilized four microstructural models found in literature to estimate microstructural parameters from ex-vivo porcine myocardium. We showed that these models do not accurately predict the underlying microstructure when compared with numerically simulated data, sometimes being off by over 100%, suggesting that though reasonable values are predicted when applied to experimental data, predictions from such models should be interpreted with caution. This work motivates further development of more advanced models, particularly in determining extracellular structure which is of interest in understanding mechanical force transmission of the muscle.Acknowledgements
Funding for this work was provided by NSF Grant CMMI-1437113 and NSF Graduate Research Fellowship for NMN. This work used the Extreme Science and Engineering Discovery Environment (XSEDE), which is supported by National Science Foundation grant number ACI-1548562 and provided access to the SDSC Comet Cluster under allocation #TG-MCB180044.References
[1] Karampinos, D. C., King, K. F., Sutton, B. P., & Georgiadis, J. G. (2009). Myofiber ellipticity as an explanation for transverse asymmetry of skeletal muscle diffusion MRI in vivo signal. Annals of Biomedical Engineering, 37(12), 2532–2546.
[2] Laghi, L., Venturi, L., Dellarosa, N., & Petracci, M. (2017). Water diffusion to assess meat microstructure. Food Chemistry, 236, 15–20.
[3] Galbán, C. J., Maderwald, S., Uffmann, K., & Ladd, M. E. (2005). A diffusion tensor imaging analysis of gender differences in water diffusivity within human skeletal muscle. NMR in Biomedicine, 18(8), 489–498.
[4] Kim, S., Chi-Fishman, G., Barnett, A. S., & Pierpaoli, C. (2005). Dependence on diffusion time of apparent diffusion tensor of ex vivo calf tongue and heart. Magnetic Resonance in Medicine, 54(6), 1387–1396.
[5] Jiang, X., Li, H., Xie, J., et al. (2016). Quantification of cell size using temporal diffusion spectroscopy. Magnetic Resonance in Medicine, 75(3), 1076–1085.
[6] Saotome, T., Sekino, M., Eto, F., & Ueno, S. (2006). Evaluation of diffusional anisotropy and microscopic structure in skeletal muscles using magnetic resonance. Magnetic Resonance Imaging, 24(1), 19–25. http://doi.org/10.1016/j.mri.2005.09.009
[7] Fieremans, E., Lemberskiy, G., Veraart, J., et al. (2017) In vivo measurement of membrane permeability and myofiber size in human muscle using time-dependent diffusion tensor imaging and the random permeable barrier model. NMR Biomed., 30: e3612.
[8] Sigmund, E. E., Novikov, D. S., Sui, D., et al. (2014). Time‐dependent diffusion in skeletal muscle with the random permeable barrier model (RPBM): application to normal controls and chronic exertional compartment syndrome patients. NMR in Biomedicine, 27(5), 519-528.
[9] Naughton, N. M., Tennyson, C. G., & Georgiadis, J. G., Lattice Boltzmann method for simulation of diffusion magnetic resonance imaging physics in heterogeneous tissue models. Journal of Computational Physics, (submitted 2018)
[10] Towns, J., Cockerill, T., Dahan, M., Foster, I., et al. (2014). XSEDE: accelerating scientific discovery. Computing in Science & Engineering, 16(5), 62-74.
Figures