3633
Simulation of Intravoxel Incoherent Perfusion Signal using a Realistic Capillary Network of a Mouse Brain1University Hospital Zürich, Zürich, Switzerland, 2Institute of Pharmacology and Toxicology, University of Zurich, Zürich, Switzerland, 3Institute for Biomedical Engineering, ETH and University of Zürich, Zürich, Switzerland
Synopsis
The microscopic origin of the IVIM perfusion signal is not well understood. We simulated blood motion in three realistic microvascular networks obtained by two-photon laser microscopy in mouse brain and computed the effect of this motion on the diffusion-weighted signal MR signal for b-values between 0 and 1000 s/mm2. We found pseudo-diffusion coefficients D* in the range of in vivo measurements. Further, the signal decay was strongly dependent on the specific type of vessel (capillary,arterioles/venules or pial vessels) and on the global vessel diameters of the network.
Purpose
The Intravoxel Incoherent Motion (IVIM) perfusion signal is assumed to arise from motion ofthe blood inside the capillaries, but an ultimate experimental validation of this assumption is still lacking. In addition, the exact relationships between the IVIM perfusion parameters, the micro-vascular networkstructure, and the blood flow, are not clearly established. The purpose of this study was to simulate the IVIM MR signal from a realistic vascular network graph and derive an expected pseudo-diffusion coefficient D*.Materials and Methods
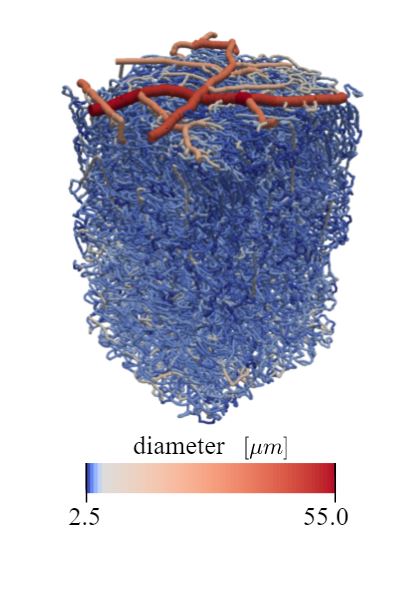
Three different networks
were generated from a 3-dimensional binary segmentation obtained from a 1 µm3
tissue cubes of parietal cortex of a mouse scanned by two-photon laser
microscopy (Figure 1). The vessels of those
networks were classified depending on their diameter into: pial
arterioles/venules, descending arterioles, capillary, or ascending venules.
Blood flow in the microvascular network was simulated by assigning realistic
pressure boundary conditions at all in- and outflows and using Poiseuille’s law
to compute flow rate in each vessel (1). The trajectories of a fixed number of particles
along the network architecture with its characteristics flow speed and pressure
gradient were then computed for a defined time interval. All trajectories were
then used to calculate the phase acquired by each blood component during
Stejskal-Tanner monopolar pulse gradient scheme (b-values: 0-1000 s/mm2,
Δ=42ms, δ=16ms) by taking the scalar product of the simulated track with the
gradient. The resulting MR signal as a function of the b-value was finally
obtained by integrating all phases and D* was obtained by fitting an
exponential signal decay. Finally, to understand
how the IVIM signal is composed, the above was repeated by restricting the
simulation to the various types of vessels, and by increasing stepwise the
diameter of the vessels from 0 to 10%.
Results
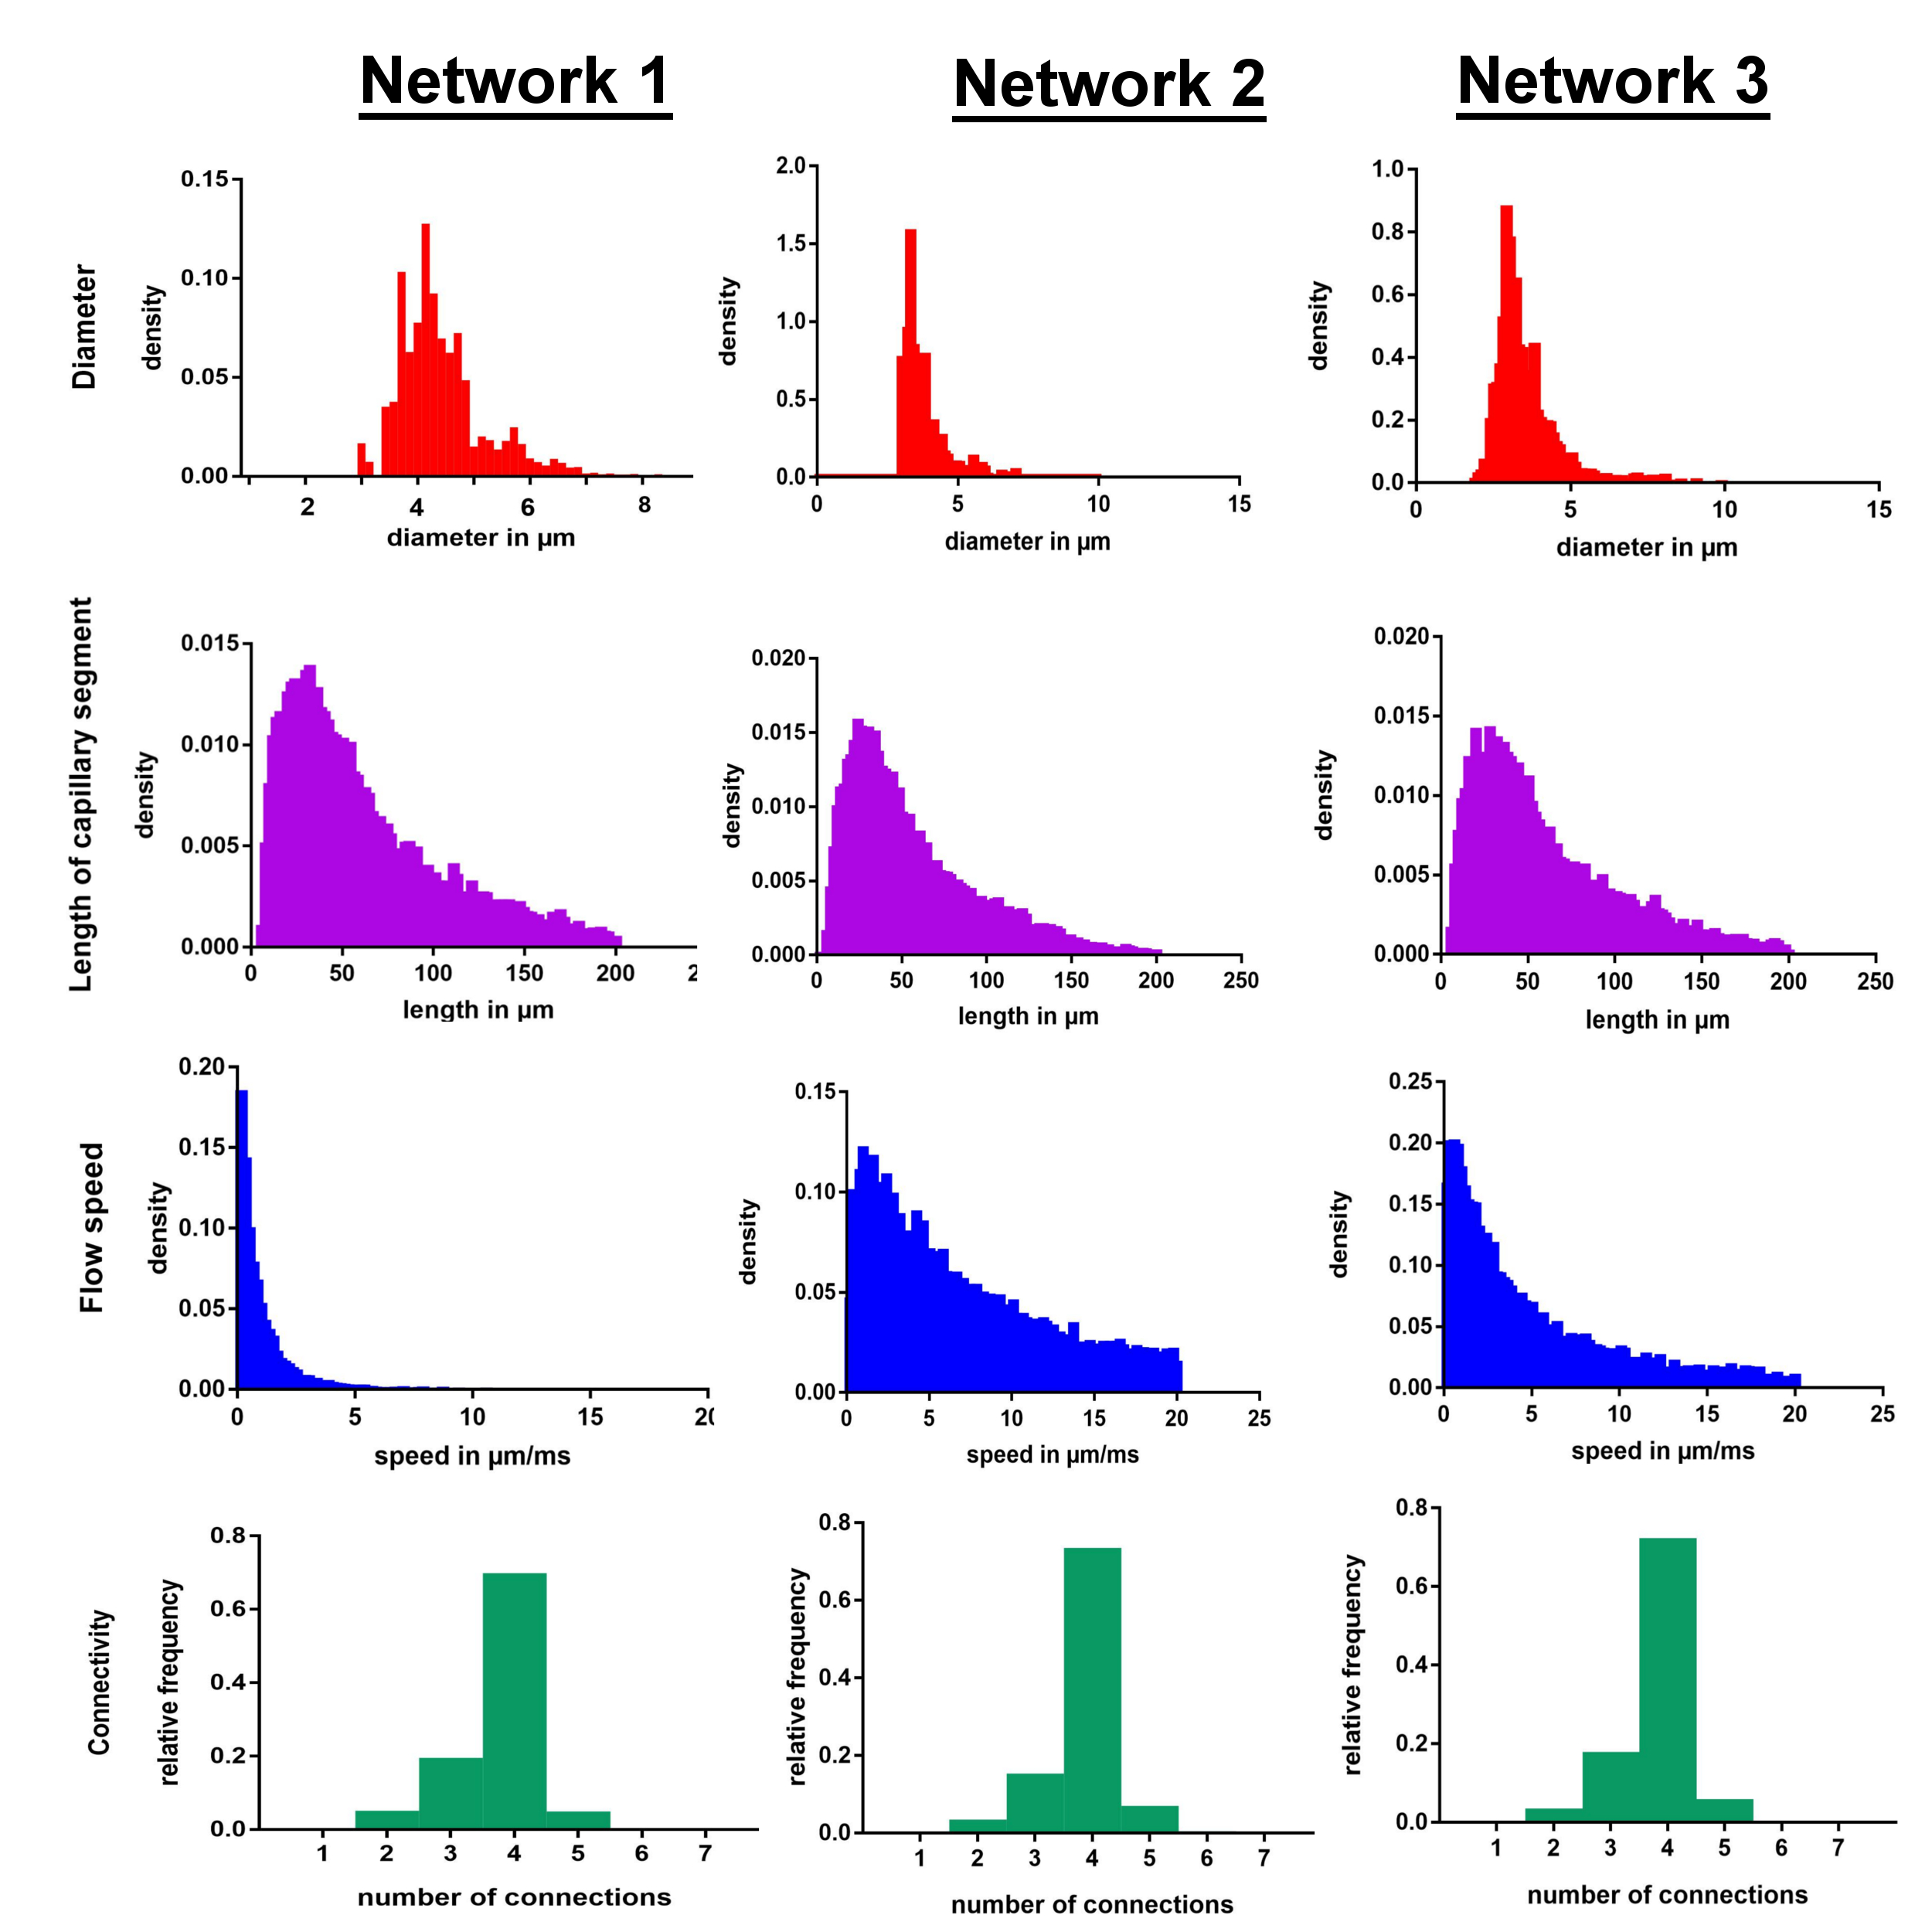
Network Characteristics (Figure 2): Mean capillary segment lengths of the extracted capillary graphs (NW1: 53.68±39.28µm, NW2: 58.1±39.7µm, NW3: 61.5±42.7µm) as well as the distribution of the diameters (mean NW1: 4.3±2.3µm, NW2: 4.9±1.8µm, NW3: 5.2±2.2µm) differed for the three networks. Most capillary branches in all three networks were connected to 4branches, with a maximum of 7 connections (NW1&3: 3.8±0.6, NW2: 3.9±0.6). Mean simulated flow was 1.8± 4.2µm/ms in network 1, 7.0±5.3µm/ms in network 2 (7.0±5.3µm/ms) and 5.3±4.9µm/ms in network 3.
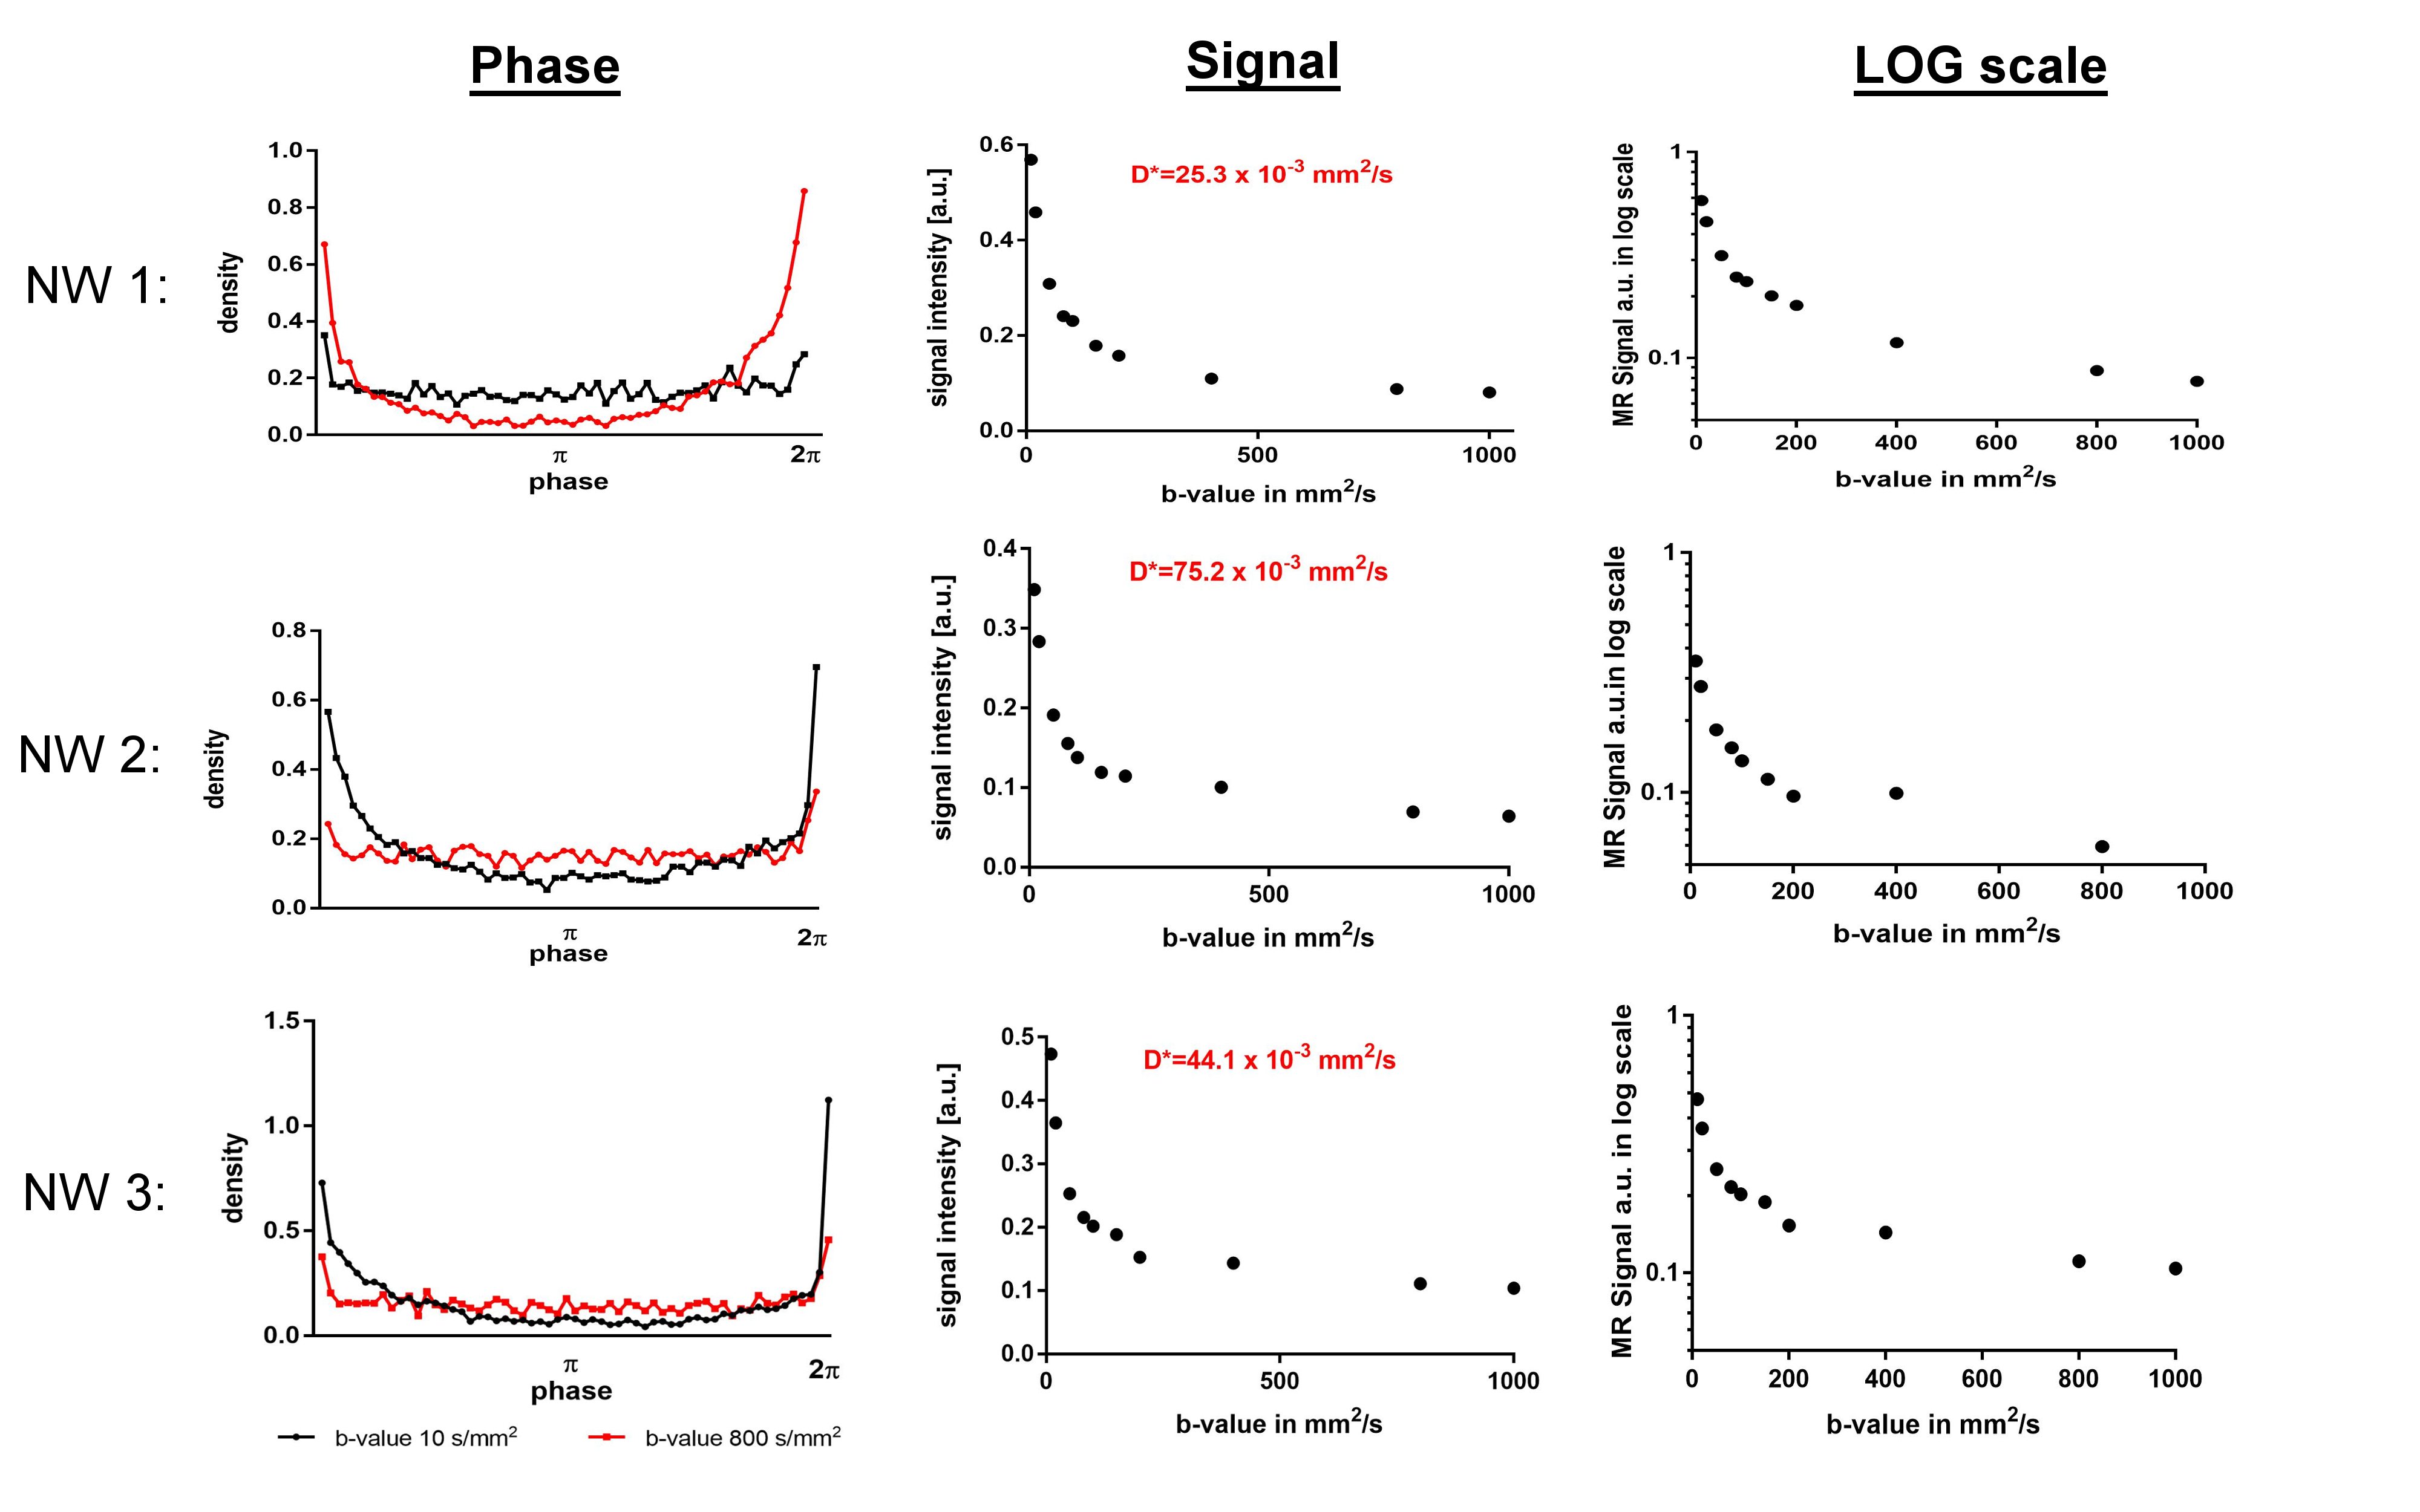
Simulation of the IVIM MR signal (Figure 3): The signal decay as a function of b-value was stronger than mono-exponential for all three capillary networks. Exponential fitting resulted in the following D*: 25.3x10⁻³mm2/s (NW1), 75.2x10⁻³mm2/s (NW2) and 44.1x10⁻³mm2/s (NW3).
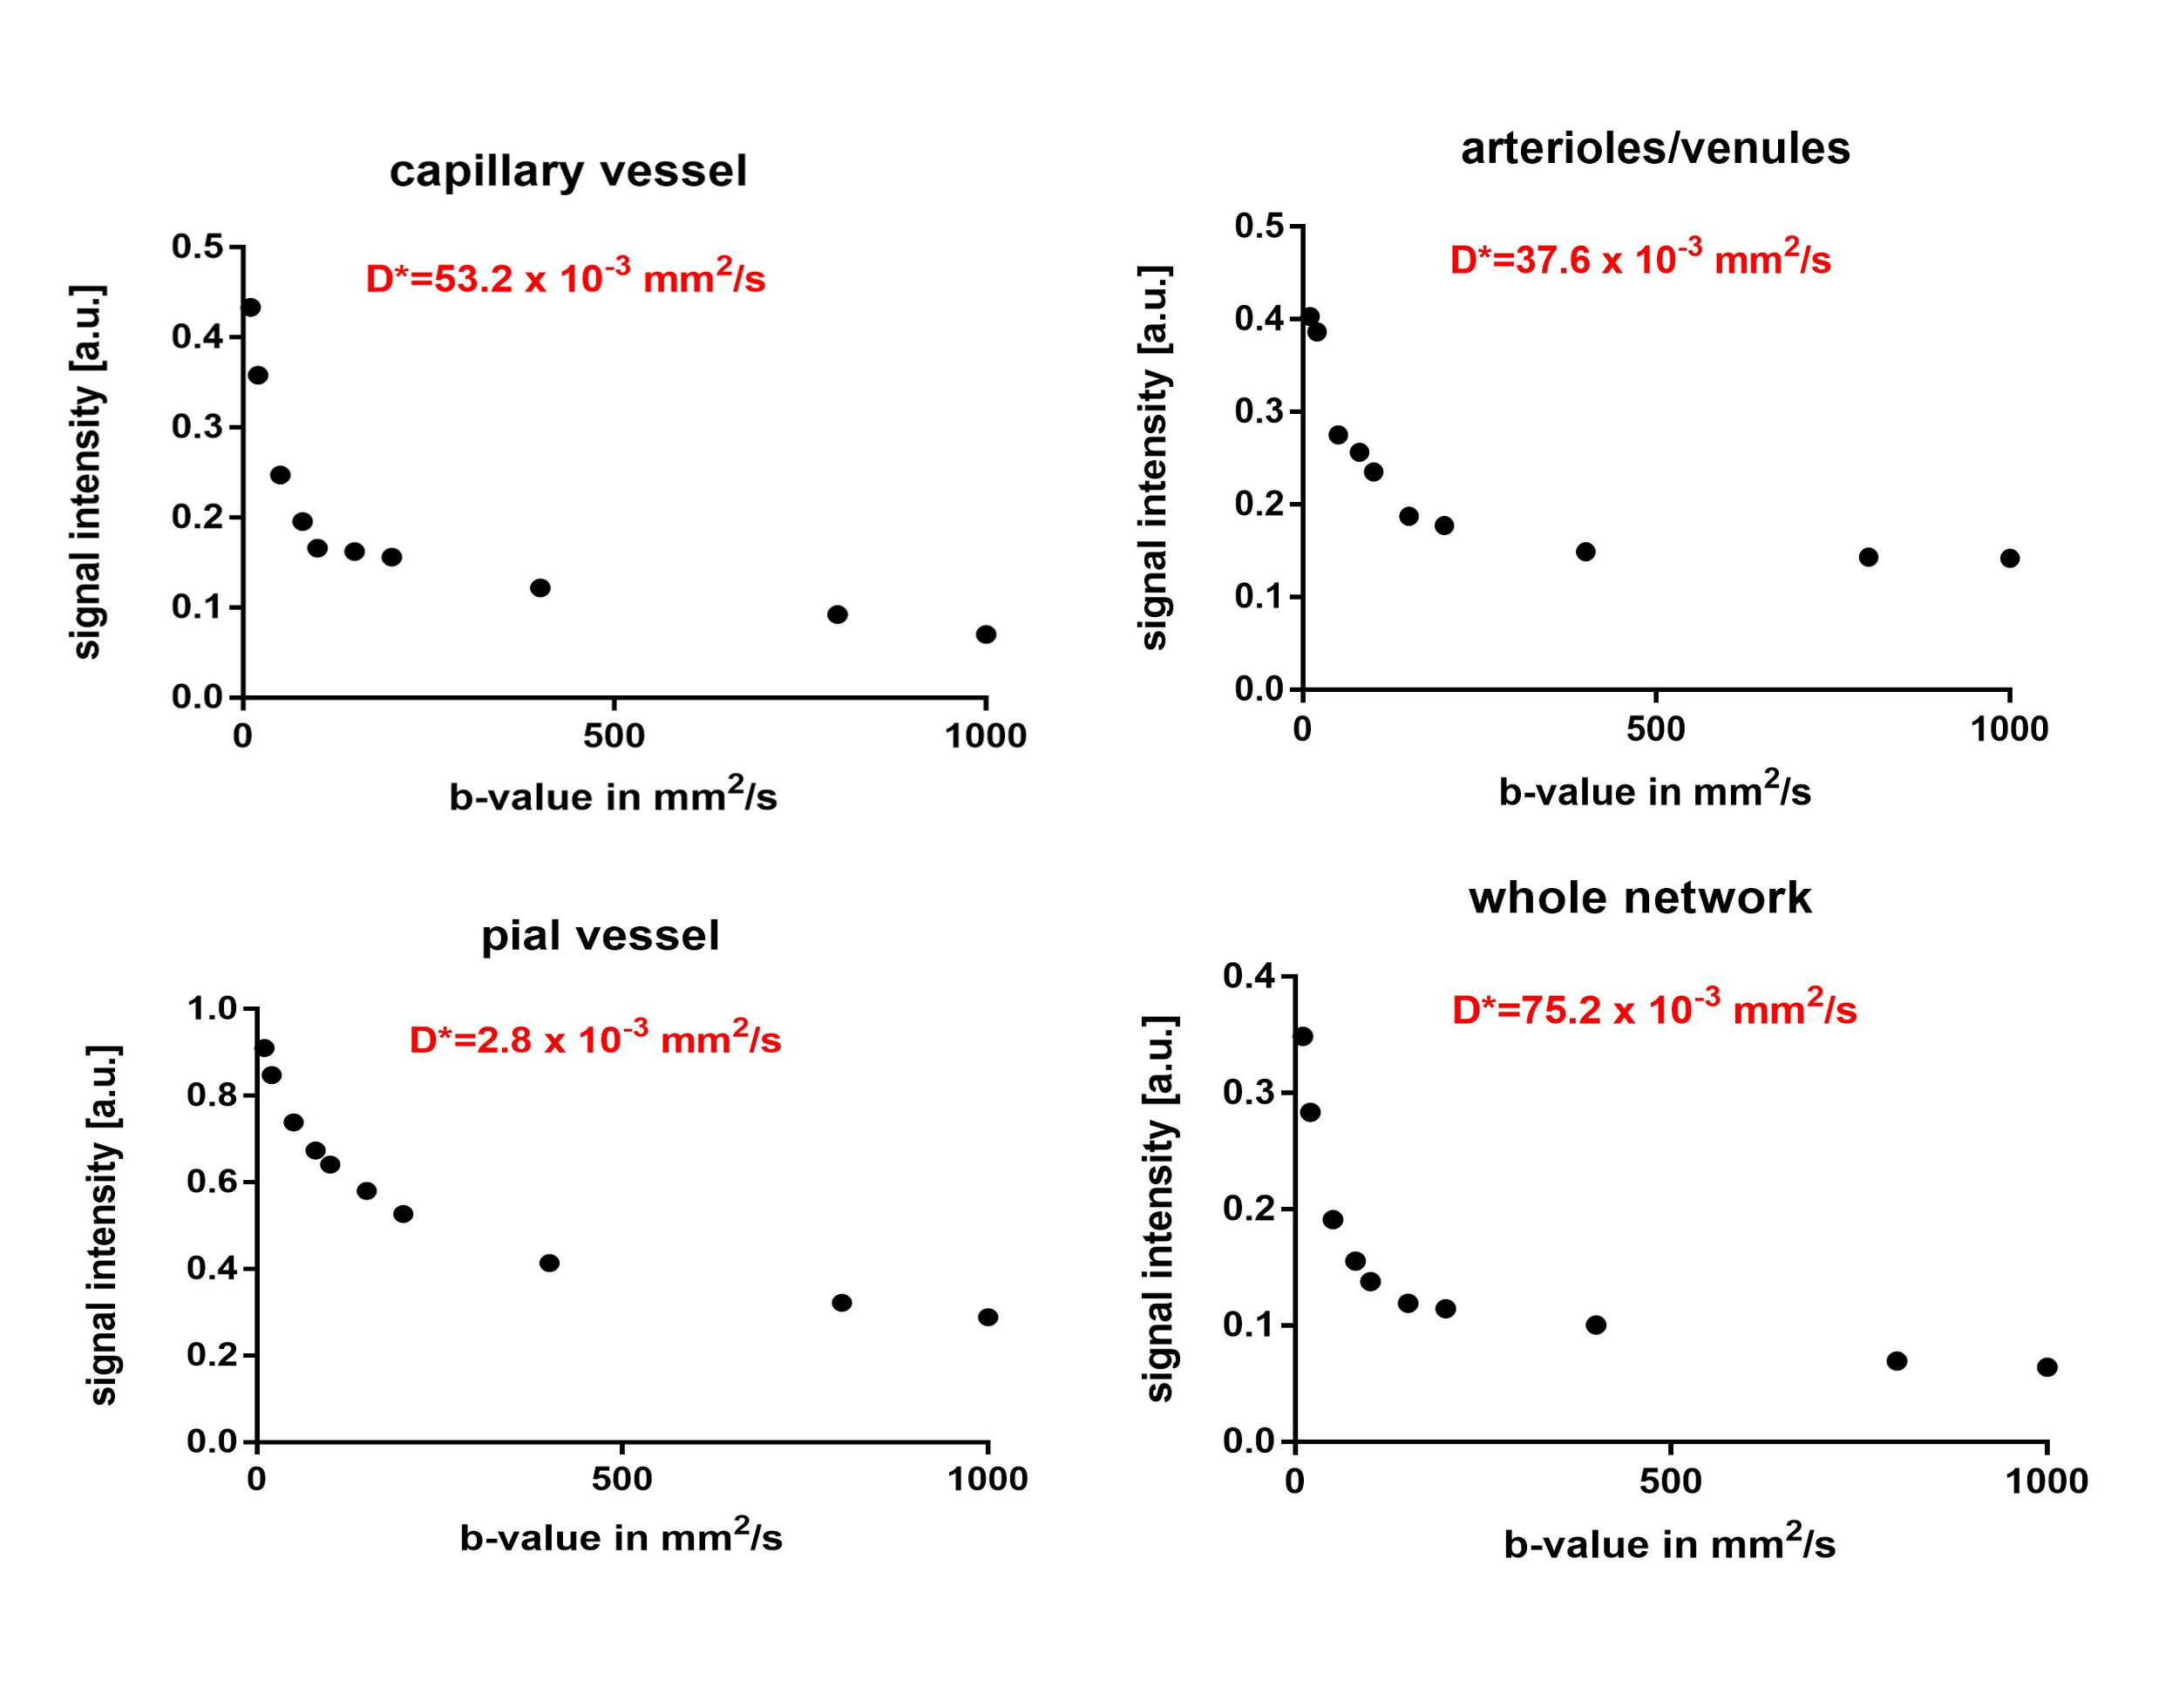
Decomposition of the network (Figure 4): The signal decay was strongly dependent on the type of vessels considered. A fast signal decay for low b-values was seen in the capillary network (NW2: D*=53.2x10⁻³mm2/s), a moderate decay for the descending arterioles and ascending venules (NW2: D*=37.6x10⁻³mm2/s) and a slower signal decay for the pial vessels (NW2: D*=2.8x10⁻³mm2/s). A similar trend was observed in the two other networks as well.
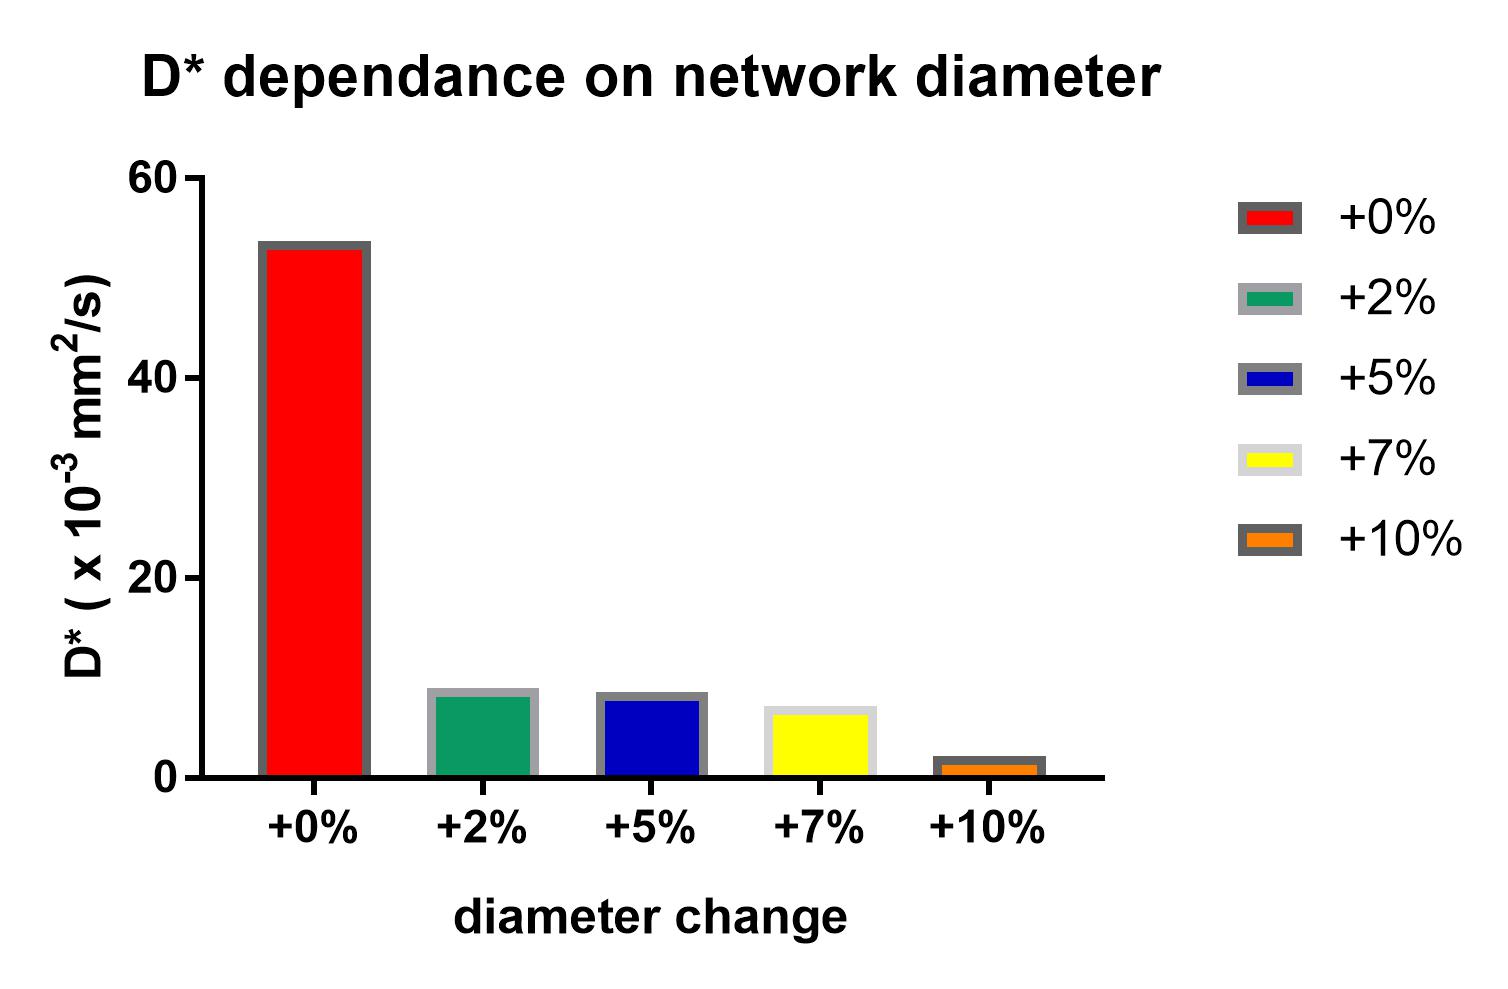
Influence of the diameter (Figure 5): In all three networks, artificial enlargement of the diameters of the vessels resulted in a steep decrease of the D* value (exemplary NW1: 9.1x10⁻³mm2/s for +2%, 8.7x10⁻³mm2/s for +5%, 7.2x10⁻³mm2/s +7% for 2.2x10⁻³mm2/s +10%).
Discussion
Our simulation derived D* values were found to be in the upper range compared with in-vivo measured signal, which has been reported at around 7x10⁻³mm2/s (2). Our findings are nevertheless in good agreement with the assumption of a microvascular source of the signal, as some of this steep decline at low b-value might get underestimated in-vivo because of dephasing effects by the imaging gradients. Interestingly, we found a non-monoexponential behavior as a function of b-value at very low b-value. Further, we found that most of the fast signal decay for small b-values may arise from the capillary network. Finally, we found larger diameter of the vessel diameters for constant pressure resulted in a lower D* values in the same network. This simulation improves our theoretical understanding of the IVIM method, by directly linking the MR IVIM signal to ultrahigh-resolution measures of the capillary network and realistic capillary blood flow simulation.Conclusion
This simulation improves our theoretical understanding of the IVIM method, by directly linking the MR IVIM signal to ultrahigh resolution measure of the capillary network and realistic capillary blood flow simulation.Acknowledgements
No acknowledgement found.References
(1). Schmid F, Barrett MJP, Jenny P, Weber B. Vascular density and distribution in neocortex. Neuroimage. 2017 Jun 29. pii: S1053-8119(17)30516-5
(2) Federau C, Maeder P, O’Brien K, Browaeys P, Meuli R, Hagmann P. Quantitative measurement of brain perfusion with intravoxel incoherent motion MR imaging. Radiology. 2012;265:874–881.
Figures