3631
The value of Mean Apparent Propagator (MAP)-MRI in the diagnosis of hippocampal sclerosis1The First Affiliated Hospital of Zhengzhou University, Zhengzhou, China, 2MR Scientific Marketing, Siemens Healthcare, Shanghai, China, Shanghai, China
Synopsis
This study aimed to explore the value of mean apparent propogation (MAP)-MRI parameters in the diagnosis of hippocampal sclerosis. By comparing the MAP-MRI parameters of hippocampus from both the hippocampal sclerosis patients and the healthy controls, the study found that the MAP-MRI parameters showed high consistency with pathological results, particularly for MSD and QIV. It suggests that MAP-MRI may be used as a diagnostic method with high sensitivity and specificity besides magnetic resonance spectroscopy(MRS) in the future.
Introduction
Hippocampal sclerosis (HS), also known as medial sclerosis, has a higher proportion of drug-induced epilepsy and epileptic seizures after surgery. At present, it is generally believed that the diffuse hyperintense signal on T2W image are direct signs of HS , but it is related to the physician's professional level.Another popular method for diagnosis of HS, magnetic resonance spectroscopy(MRS), cannot obtain the true spectral change of the lesion due to partial volume effect, the reason of partial volume effect is that the hippocampus is small and close to the ventricle which can cause “contamination” of the examined area, moreover, scan time of MRS is longer than other methods.The diffusion spectrum imaging (DSI) technique, based on q-space sampling, can provide dispersion information of water molecules by acquiring probability density function (PDF) of water motion, which might reflect microstructure changes of brain tissue[1].Recently, a DSI-based model, called mean apparent propogation (MAP)-MRI, was introduced and could produce quantitative parameters from PDF of water motion. In this study, we attempted to apply MAP-MRI to HS and explored its sensitivity and specificity for the diagnosis of HS.Method
Thirteen patients (average age: 30.7 ± 14.1 years; median age: 28 years) with unilateral HS (left: 5 cases; right: 8 cases) confirmed by pathology were enrolled in the study. Five healthy age-matched controls (average age: 26.0 ± 4.06 years; median age: 25 years) with no history of brain injury or cognitive problems were also recruited. All the patients and the healthy controls underwent MRI acquisition on a 3T scanner (MAGNETOM Prisma, Siemens Healthcare, Erlangen, Germany), including the T2 FLAIR sequence and the DSI sequence. The parameters of the DSI sequence were as follows: b = 0 and 3000 s/mm2, TR/TE = 3800/72 ms, FOV = 220 × 220 mm2, GRAPPA = 2, slice acceleration factor = 2, slice thickness = 2.2 mm, voxel size = 2.0 × 2.0 × 2.2 mm3, slice number = 60, scan time = 4.45 min. The MAP-MRI parameters were calculated using software developed in-house with Python, called DWINeuro, which is based on an open-resource tool DIPY (Diffusion Imaging In Python, http://nipy.org/dipy). The parameters of MAP-MRI included the mean square displacement (MSD), the q-space inverse variance (QIV), the return to the origin probability (RTOP), the return to the axis probability (RTAP), and the return to the plane probability (RTPP).
The region of interest (ROI) was drawed in the hippocampal sclerosis side of the patients and both sides of the healthy people, then the results obtained from the two groups were compared . Statistical analysis was performed using SPSS 21.0 (Chicago, IL) and MedCalc (MedCalc, Mariakerke, Belgium). For the statistically significant parameter, the optimal threshold value and diagnostic threshold were determined by plotting the receiver's operating characteristic (ROC) curve and the Yoden index, respectively. P < 0.05 was considered statistically significant.
Result
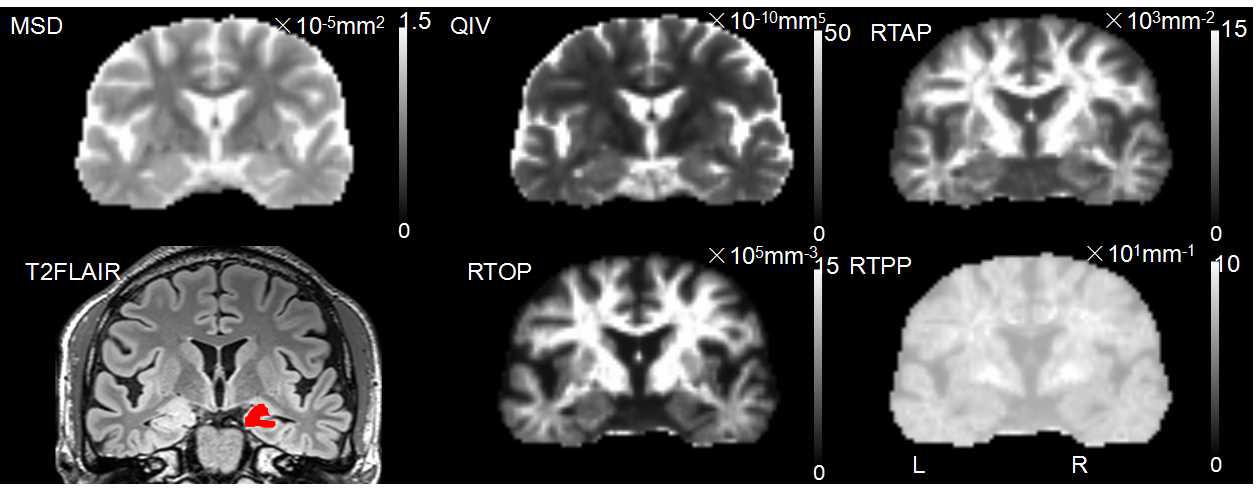
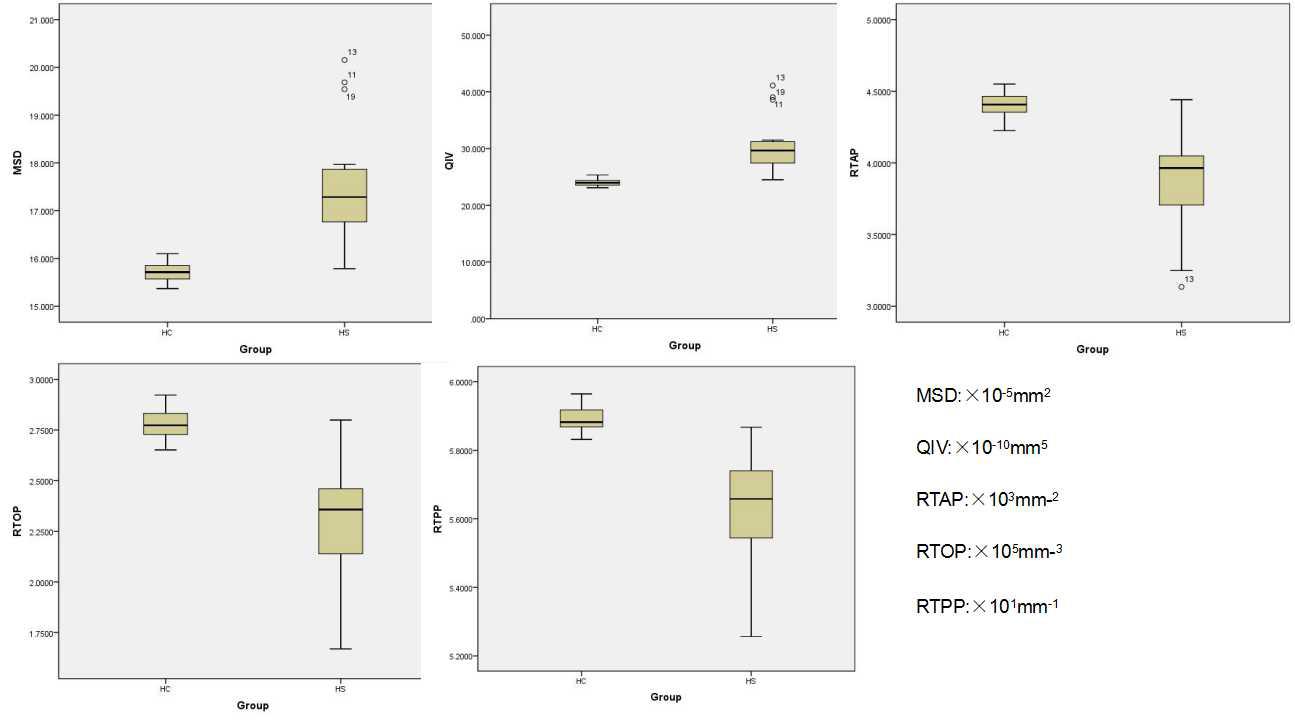
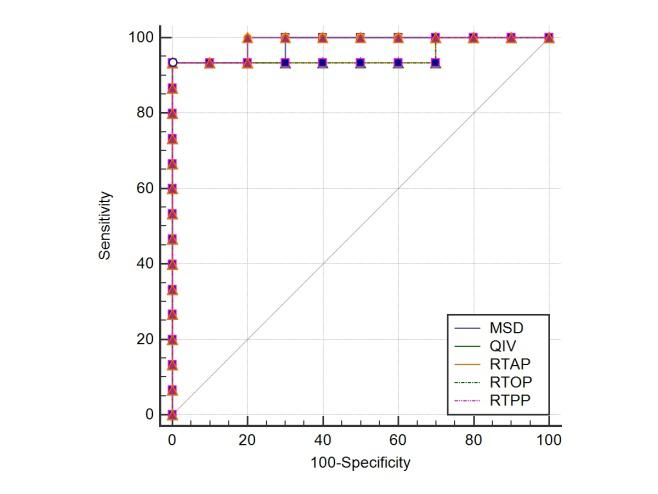
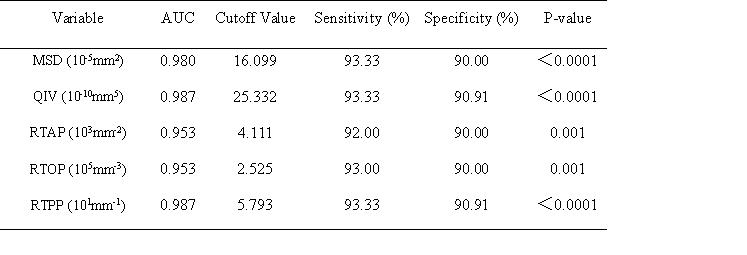
Figure 1 shows the maps of the MAP-MRI parameters for a patient. For the HS group, the mean values of MSD and QIV in region of interest (ROI) were higher but the mean values of RTAP, RTOP, RTPP were lower than those for the healthy control group (P<0.05), as shown in Table 1 and Figure 2. The diagnostic performances of the statistically significant parameters are shown in Table 1 and Figure3. Taking the maximum value of the Yoden index as the selection criterion, the optimal cut point was selected (Table 1). When MSD > 16.0999, QIV > 25.3323, RTAP ≤ 4.1111, RTOP ≤ 2.525, RTPP ≤ 5.7929, the sum of sensitivity and specificity is the largest. As a threshold for judging HS, compared with the pathological results used as the gold standard, the corresponding kappa values were 1.0, 0.918, 0.839, 0.839, and 0.918, respectively.Discussion
The main pathological changes of HS include a decrease in the number of inhibitory neurons, a loss of neuronal dendritic spines, and a glial reactive hyperplasia[2]. The results indicated that the parameters of MAP-MRI can be used as an indicator for the diagnosis of HS. Compared with healthy people, HS patients had higher MSD and QIV, and lower RTAP, RTOP and RTPP, which could be related to gliosis and extra-cellular space shrinkage. Through statistical consistency test, the kappa value of all the parameters was greater than 0.8, indicating that the MAP-MRI is highly consistent with the pathological results. The study provided new ideas for the accurate diagnosis of HS in the future. Considering the small sample size in the present study, more samples will be collected in future studies to eliminate the possible bias.Acknowledgements
No acknowledgement found.References
1.Ozarslan E, Koay C G, Shepherd T M, et al. Mean apparent propagator (MAP) MRI: a novel diffusion imaging method for mapping tissue microstructure. Neuroimage.2013;78:16-32.
2.Santyr BG, Goubran M, Lau JC, et al. Investigation of hippocampal substructures in focal temporal lobe epilepsy with and without hippocampal sclerosis at 7T. J Magn Reson Imaging. 2017 ; 45: 1359-1370.
Figures