3629
Application of Spinal Cord White Matter Tract Integrity Quantification with Atlas-based Analysis in Multiple Sclerosis and Neuromyelitis Optica Spectrum Disorder1Radiology, Juntendo University School of Medicine, Tokyo, Japan, 2Radiology, The University of Tokyo Graduate School of Medicine, Tokyo, Japan, 3Neurology, Juntendo University School of Medicine, Tokyo, Japan, 4Siemens Japan K.K, Tokyo, Japan, 5NeuroPoly Lab, Polytechnique Montreal, Montreal, QC, Canada
Synopsis
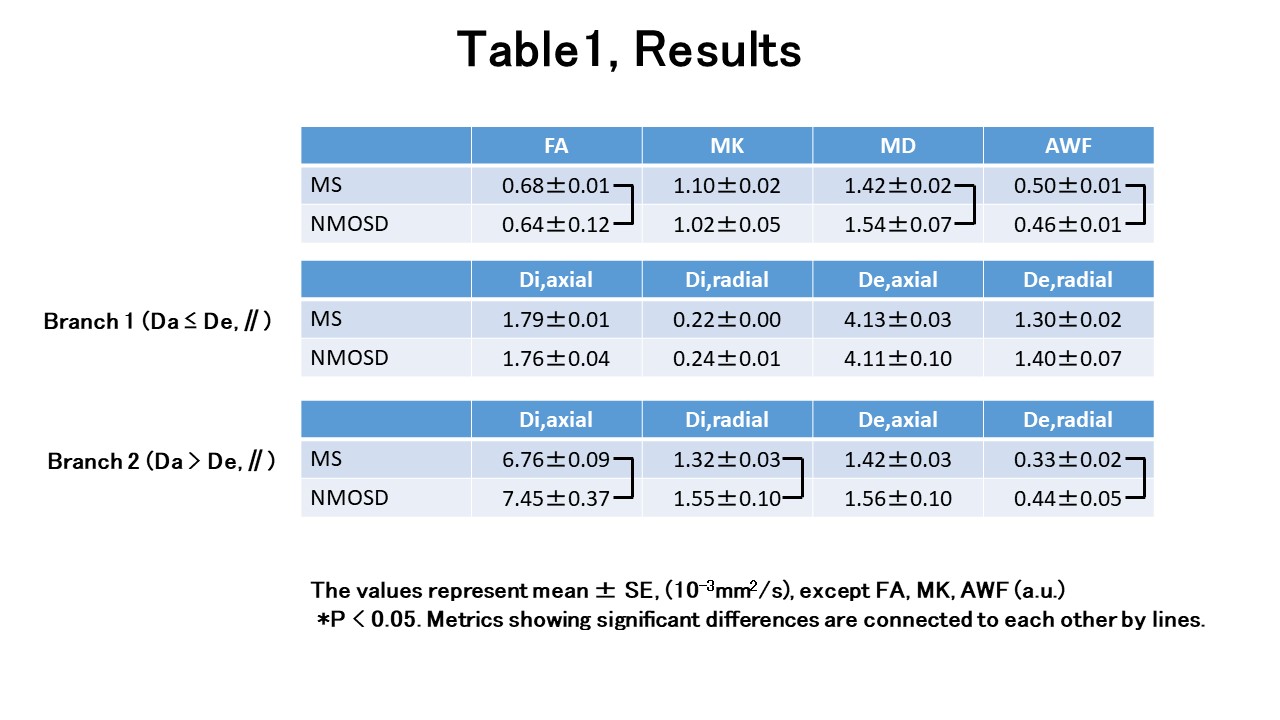
We investigated both branches (Da ≤ De,∥ or Da > De,∥) of Kurtosis-based white matter tract integrity to distinguish microstructural changes in the spinal cords of patients with MS and Neuromyelitis Optica. FA and AWF were significant higher and MD was significant lower in spinal cord white matter in MS (P=0.009, 0.024, 0.032, respectively). Di,axial, Di,radial and De,radial of spinal cord white matter in MS were significant lower (P=0.009, 0.024, 0.032, respectively,) in Branch 2(Da > De,∥) in MS. There was no significant difference in Branch 1 ( Da ≤ De,∥) metrics.
Introduction
Multiple sclerosis (MS) and Neuromyelitis Optica Spectrum Disorder (NMOSD) are diseases of immune system attack and they lead to disability from nervous system damage usually in adults. In the past, some NMOSD had been treated as a form of MS. Nowadays, scientific consensus distinguishes MS and NMOSD because the pathologic processes and effective treatments are different. However, the usefulness of conventional MR imaging is limited for morphological changes and demonstration of insufficient lesions1, and the estimation of hidden or so-called normal-appearing damaged tissue method remains to be established for both MS and NMOSD. Recently, diffusion kurtosis imaging-derived white matter tract integrity (WMTI) metrics2, 3 showed promising results that they might provide a more pathologically specific, clinically meaningful information in brain of MS patients4. However, there has been two solution branches (Da ≤ De,∥ or Da > De,∥.) depending on sign choice in WMTI estimation5. The purpose of this study is to investigate both branches of WMTI metrics to distinguish each microstructural change in the spinal cords in patients with MS and NMOSD in vivo.Methods
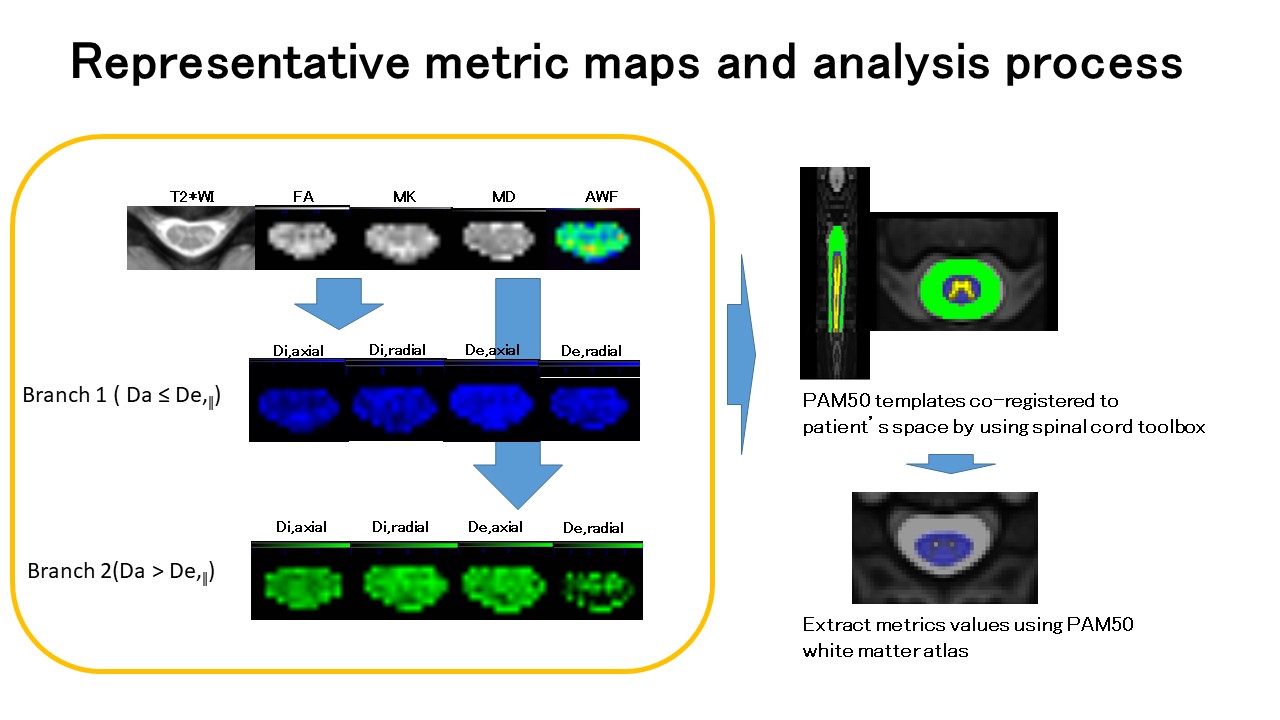
In this prospective study, we enrolled 30 MS patients (age 48±13 years, 23 females; 27 RRMS, 3 SPMS, median EDSS score 2.0, range 2-45y) and 12 NMOSD patients (age 48±14 years, 10 females). After conventional MR imaging including T2-, T2*- and T1-wegted imaging, 2-shell diffusion MR imaging data using regional excitation technique (ZoomIt) were acquired with a Siemens Prisma 3T scanner with a body coil excitation and 64-ch head/neck coil for reception. Imaging parameters for 2-shell dMRI were as follows: repetition time (TR)/echo time, 2200/76 (ms/ms); number of signals acquired, one; section thickness, 5 mm; 39 slices; in-plane pixel size, 0.9x 0.9 mm; SMS factor, 2; imaging time, approximately 12 min; 2 b values (1000 and 2000 s/mm 2) with two b=0 image and diffusion encoding in 30 direction for every b value. All diffusion MRI data was transferred to an offline workstation and processed using in-house developed software in Matlab (R2017a, Math Works, Inc, Natick, MA) to derive parametric maps of mean diffusivity (MD), mean kurtosis(MK), fractional anisotropy (FA), axonal water fraction(AWF), axial and radial intra-axonal diffusivities (Di,axial and Di,radial, respectively) and axial and radial extra-axonal diffusivities (De,axial and De,radial, respectively)4. We refer to the branches as Branch 1 (yielding Da ≤ De,∥) and Branch 2 (yielding Da > De,∥), as Hansen et al5. Moreover, semi-automated analysis was performed using the Spinal Cord Toolbox6 for segmentation, motion correction, registration to WM atlas and extraction of metrics (Figure 1). Between MS and NMOSD, quantitative metrics in the white matter at C2-C5 were selected and compared. Statistical evaluations were performed by using IBM SPSS Statistics software (version 19.0; SPSS, Chicago, IL) using Kruskal Wallis test with multiple comparisons using rank sums among the values of MS and NMOSD spinal cords. P value less than 0.05 was considered to indicate a statistically significant difference.Results
All metrics values of white matter of spinal cords in patients with MS and NMOSD were summarized in table 1. FA and AWF were significant higher and MD was significant lower in spinal cord white matter in patients with MS (P=0.009, 0.024, 0.032, respectively, Kruskal Wallis test with multiple comparisons using rank sums). Di,axial, Di,radial and De,radial of spinal cord white matter in patients with MS were significant lower (P=0.009, 0.024, 0.032, respectively, Kruskal Wallis test with multiple comparisons using rank sums) in Branch 2(Da > De,∥) in spinal cord white matter in patients with MS. There was no difference was shown in Branch 1 ( Da ≤ De,∥) metrics.Discussion
The choice of the branch for the diffusion metrics, such as WMTI are still under debate. Kouchkovsky(Ref. 4) used the hypothesis of Branch 1 (Da ≤ De,∥), but some literatures support the accuracy of Branch 2(Da > De,∥)7,8. Our results show that WMTI Branch 2 metrics seem to be useful to capture the different pathological microstructural change in the spinal cord white matter in MS and NMOSD, presumably different degree of demyelination and axonal damages. More studies of the imaging pathological and clinical correlation are needed; WMTI Branch 2 (Da > De,∥) metrics has the potential to provide an additional information and to be biomarker in patients with MS and NMOSD in vivo.Acknowledgements
This work was supported by JSPS KAKENHI Grant Number 16K10328, the Canada Research Chair in Quantitative Magnetic Resonance Imaging [950-230815], the Canadian Institute of Health Research [CIHR FDN-143263], the Canada Foundation for Innovation [32454, 34824], the Fonds de Recherche du Québec - Santé [28826], the Fonds de Recherche du Québec - Nature et Technologies [2015-PR-182754], the Natural Sciences and Engineering Research Council of Canada [435897-2013], the Canada First Research Excellence Fund (IVADO and TransMedTech) and the Quebec BioImaging Network [5886].References
1. Miki Y, et al.Relapsing-remitting multiple sclerosis: longitudinal analysis of MR images--lack of correlation between changes in T2 lesion volume and clinical findings. Radiology. 1999 Nov;213(2):395-9. 2. Fieremans et al. White matter characterization with diffusional kurtosis imaging. Neuroimage. 2011 Sep 1;58(1):177-88.
3. Veraart J, et al. More accurate estimation of diffusion tensor parameters using diffusion Kurtosis imaging. Magn Reson Med. 2011 Jan;65(1):138-45.
4. de Kouchkovsky I, et al. Quantification of normal-appearing white matter tract integrity in multiple sclerosis: a diffusion kurtosis imaging study. J Neurol. 2016 Jun;263(6):1146-55.
5. Hansen B, et al. White matter biomarkers from fast protocols using axially symmetric diffusion kurtosis imaging. NMR Biomed. 2017 Sep;30(9). doi: 10.1002/nbm.3741.
6. De Leener B,et al. SCT: Spinal Cord Toolbox, an open-source software for processing spinal cord MRI data. Neuroimage. 2017 Jan 15;145(Pt A):24-43.
7. Jespersen SN, et al. Diffusion time dependence of microstructural parameters in fixed spinal cord. Neuroimage. 2018 Nov 15;182:329-342.
8. Kunz N, et al. Intra- and extra-axonal axial diffusivities in the white matter: Which one is faster? Neuroimage. 2018 Nov 1;181:314-322.
Figures