3628
Directional Intravoxel Incoherent Motion (IVIM) MR in Rodent Brain1Biomedical Engineering, Ulsan National Institute of Science and Technology, Ulsan, Korea, Republic of, 2Athinoula A. Martinos Center for Biomedical Imaging, Massachusetts General Hospital, Charlestown, MA, United States
Synopsis
The measurement of white matter flow, which is directional along the neuronal fibers, is challenging due to inherent limitations of low sensitivity and signal-to-noise ratio with arterial spin labeling(ASL)- and dynamic susceptibility contrast(DSC)-MRI acquisitions mainly due to low blood volumes. Recently,
Introduction
Measuring directional flows from microvasculature in a rodent brain is challenging with traditional methods1-3, partly because of low signal-to-noise ratio and sensitivity. Recently, intravoxel incoherent motion (IVIM) signal characteristic depending on diffusion gradient directions are being studied4,5, which can potentially detect directional flows of small vessels in a brain, especially white matter perfusions. However, the requirements of multi-variable fittings of IVIM signals usually suffer from over-fitting and thresholding issues.6-8
In this study, we first simulate the dependence of IVIM signals for aligned and randomized blood vessels with Monte-Carlo methods to mimic white- and gray-matter of brain blood vessels. Next, we implemented constrained non-negative matrix factorization (cNMF) to IVIM signal for simple segmenting of IVIM signals without multi-variable fittings. The segmentation of IVIM signal with cNMF varying diffusion gradient directions enables the robust detection of directional flow information in a rodent brain.
Methods
Simulations
To observe the effects of vessel orientations on IVIM signals, Monte-Carlo simulations were performed. The spin position (P) was determined by Eq-1.
Eq-1: $$P_{vessel}\sim N(\overrightarrow{\mu}(x,y,z),0), P_{EES}\sim N(0,\sigma^2)$$
where µ is a mean velocity of flow, and σ is the standard deviation of water diffusion.
For the calculation of IVIM signals (S), Eq-2, 3 were used.
Eq-2 : $$\phi_{k+1,q}= \phi_{k,q}+\gamma G(P,t)dt$$
Eq-3 : $$S=||\sum_{q=1}^n\frac{e^{i\phi_{TE,q}}}{n}||$$
where ∅k,q is the spin phase (k indicates an iteration number, q is an individual number of each spin), and n is the number of spins.
IVIM-MR Experiments
IVIM-MR experiments were performed with spin echo echo planar imaging (EPI) sequence with twenty b-values with 3 orthogonal directions. To verify the flow contributions to IVIM signals, normal rats were scanned, and post-mortem data were acquired with the same MR protocol after being sacrificed. Ultrashort echo-time (UTE)-MRA was also performed with an injection of super-paramagnetic iron oxide nano-particle (SPION) to visualize directional vessel flows in a rodent brain to aid the interpretation of IVIM signals as a gold standard. The fitted IVIM parameter maps were generated by using the IVIM double exponential equation (Eq-4).9
Eq-4 : $$S_b/S_0=(1-f)e^{-bD}+fe^{-b(D+D^*)}$$
The implemented cNMF algorithm closely followed previous studies.10,11 The cNMF weight maps from each contribution of single and double exponential components were obtained from normalized signals. Correspondingly, the brain regions were automatically segmented for dominant single- and double- exponential IVIM signal components, including mixture regions by voxel-based comparisons of each component weights. Moreover, the flow direction map was generated from the combination of cNMF based weighting maps from three orthogonal directions through different color coding, as for tractography. Then, the flow direction maps were compared with angiograms from UTE data in terms of vessel orientation and distribution in a brain.
Results
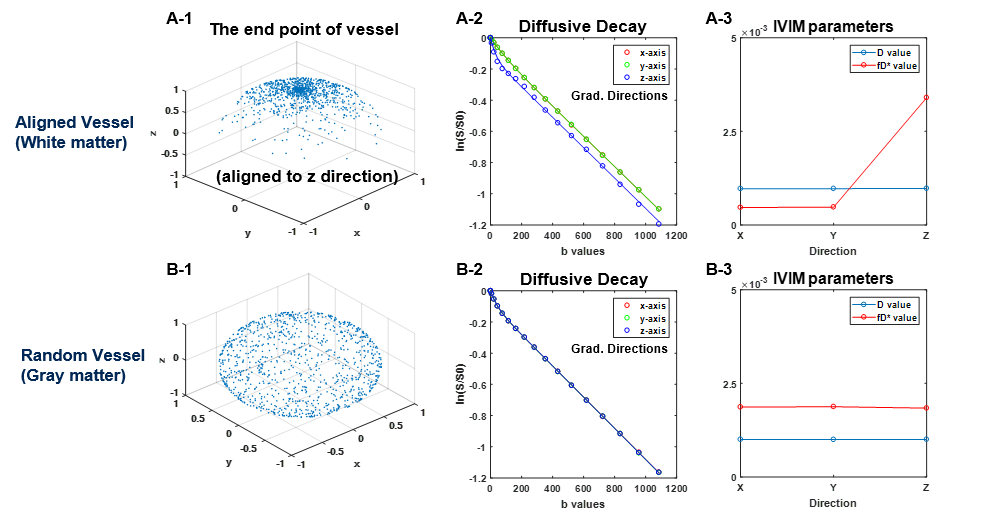
Fig.1 shows the IVIM-diffusive decay signals and corresponding IVIM parameters, which were obtained by double exponential fittings for alignment to z-direction and random cylinders along the three different orthogonal gradient directions, respectively. In the case of the vessels aligned to z-direction, the higher perfusion factor(fD*) value was obtained when the gradient direction is matched with the vessel orientation. However, fD* was constant in the case of random oriented vessels.
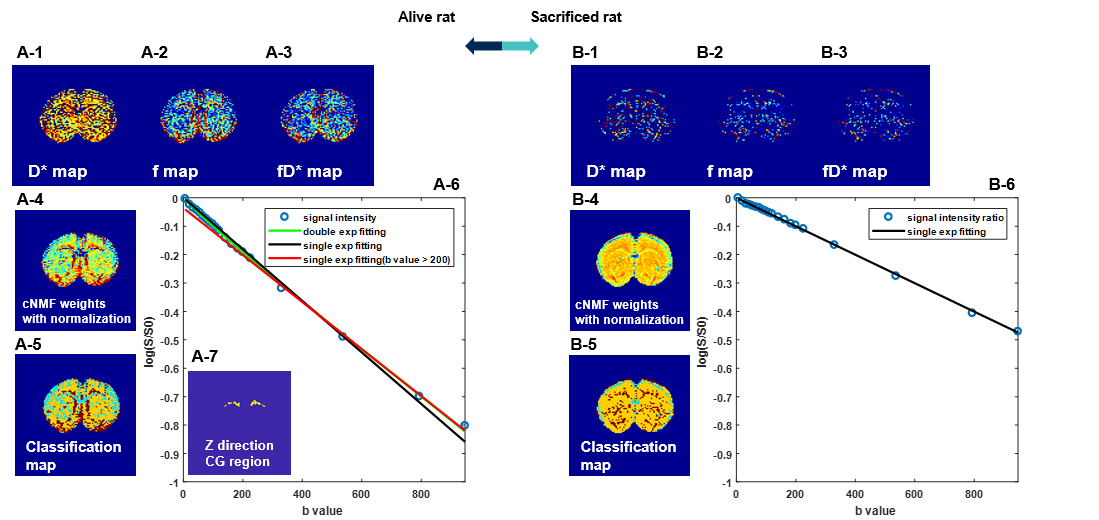
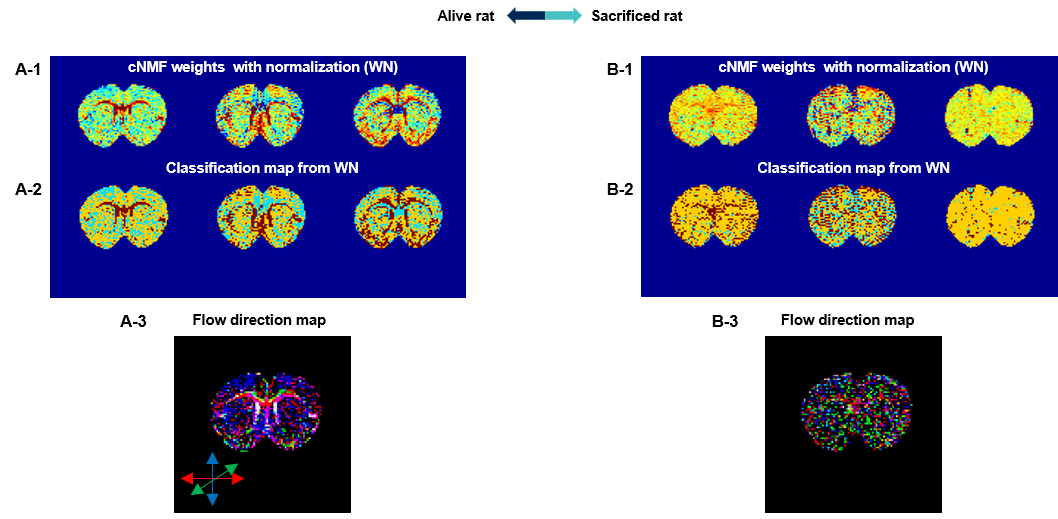
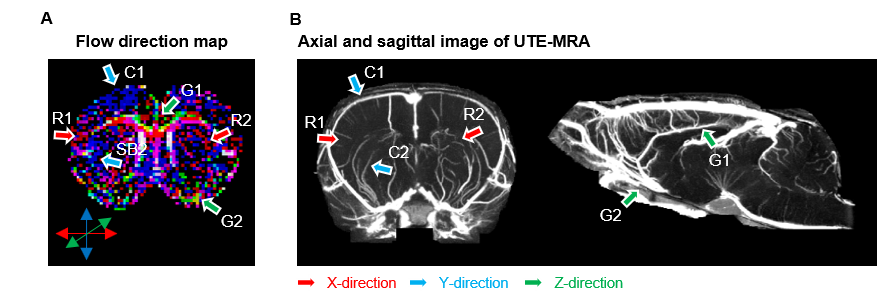
In Fig.2, both fD* maps and cNMF results along the z-gradient direction were shown when the rat was alive and sacrificed to investigate the flow effects. ROI-averaged diffusive decaying curves in cingulum (CG) region were shown for both cases. Highly weighted regions (classified as red in Fig.2A-5), such as CG, ventricles, and the bottom areas of brain, whose flow is known to be preferential along the z-direction showed large perfusion factors when gradient in the z-direction is applied. This result was consistent with that of the simulation. In addition, the fitted perfusion factors of CG aligned z-direction was much more significant in a rat alive (Fig.2A-6) than that from sacrificed (Fig.2B-6), which clearly demonstrates that the directional flow is contributed to IVIM signals. Accordingly, the weights in corpus callosum (CC) aligned along the x-direction were the greatest for x direction gradient experiments (Fig.3A-2). The direction of the perfusion in tractography map (Fig.4A) corresponded well with vessel orientation in UTE angiogram (Fig.4B), which validates that the cNMF segmentation of directional IVIM signals can extract vessel direction information.
Conclusions and Discussions
We observed that cNMF implementation to IVIM data provides robust analysis to detect directional flow in the case of aligned vessels, such as white matter perfusion and directional vessels in a brain. In both simulations and experiments, cNMF double exponential weights of white matter and aligned vessel regions in brain were significantly higher than gray matter where vessels are randomly distributed. In the future work, directional IVIM with cNMF will be mainly beneficial to investigating disease directional activity by the robust observation of both directional diffusivity and perfusivity.Acknowledgements
This research was supported by Basic Science Research Program through the National Research Foundation of Korea (NRF) funded by the Ministry of Education (2018R1A6A1A03025810)References
1. Van Gelderen P, De Zwart JA, Duyn JH. Pittfalls of MRI measurement of white matter perfusion based on arterial spin labeling. Magnetic Resonance in Medicine: An Official Journal of the International Society for Magnetic Resonance in Medicine. 2008;59(4):788-95.
2. Mutsaerts HJ, Richard E, Heijtel DF, et al. Gray matter contamination in arterial spin labeling white matter perfusion measurements in patients with dementia. NeuroImage: Clinical. 2014;4:139-44.
3. Kluytmans M, Grond JV, Folkers PJ, et al. Differentiation of gray matter and white matter perfusion in patients with unilateral internal carotid artery occlusion. Journal of Magnetic Resonance Imaging. 1998;8(4):767-74.
4. Callot V, Bennett E, Decking UK, et al. In vivo study of microcirculation in canine myocardium using the IVIM method. Magnetic Resonance in Medicine: An Official Journal of the International Society for Magnetic Resonance in Medicine. 2003;50(3):531-40.
5. Notohamiprodjo M, Chandarana H, Mikheev A, et al. Combined intravoxel incoherent motion and diffusion tensor imaging of renal diffusion and flow anisotropy. Magnetic resonance in medicine. 2015;73(4):1526-32.
6. Cho GY, Moy L, Zhang JL, et al. Comparison of fitting methods and b‐value sampling strategies for intravoxel incoherent motion in breast cancer. Magnetic resonance in medicine. 2015;74(4):1077-85.
7. Federau C, Cerny M, Roux M, et al. IVIM perfusion fraction is prognostic for survival in brain glioma. Clinical neuroradiology. 2017;27(4):485-92.
8. Lei J, Tian Y, Zhu SC, et al. Preliminary study of IVIM-DWI and DCE-MRI in early diagnosis of esophageal cancer. matrix. 2015;256:192.
9. Patel J, Sigmund EE, Rusinek H, et al. Diagnosis of cirrhosis with intravoxel incoherent motion diffusion MRI and dynamic contrast‐enhanced MRI alone and in combination: preliminary experience. Journal of Magnetic Resonance Imaging: An Official Journal of the International Society for Magnetic Resonance in Medicine. 2010;31(3):589-600.
10. Stoyanova R, Huang K, Sandler K, et al. Mapping tumor hypoxia in vivo using pattern recognition of dynamic contrast-enhanced MRI data. Translational oncology. 2012;5(6):437-IN2.
11. Han S, Stoyanova R, Lee H, et al. Automation of pattern recognition analysis of dynamic contrast‐enhanced MRI data to characterize intratumoral vascular heterogeneity. Magnetic resonance in medicine. 2018;79(3):1736-44.
Figures