3626
Qualitative Comparison of Calculated and Measured Ultra-High b-Value Diffusion-Weighted Images in the Assessment of Clinically Significant Prostate Cancer.David Bonekamp1, Christopher Edler1, Jan Philipp Radtke1,2, Frederik Bernd Laun3, Markus Hohenfellner2, Heinz-Peter Schlemmer1, and Tristan Anselm Kuder4
1Radiology, German Cancer Research Center, Heidelberg, Germany, 2Urology, University Hospital Heidelberg, Heidelberg, Germany, 3MR Physics, University Hospital Erlangen, Erlangen, Germany, 4Medical Physics, German Cancer Research Center, Heidelberg, Germany
Synopsis
To qualitatively compare measured and calculated ultra-high b-value (UHB, b-value up to 4000 s/mm2) DWI for detection of clinically significant prostate cancer. UHB-DWI was acquired in 55 patients at 3T in addition to standard DWI (S-DWI) extrapolated to UHB b-values. Two raters R1 and R2 independently assessed DWI and ADC in combination with T2w images. Lesion visibility was best on ultra-high b-value images monoexponentially extrapolated (ME-DWI) from S-DWI and equal on S- and UHB-ADC. The experienced rater was better able to adapt the improved lesion visibility on ME-DWI into the lesion detection task and utilized it for superior predictive performance.
INTRODUCTION
To qualitatively compare measured and calculated ultra-high b-value (UHB) diffusion-weighted imaging (DWI) for detection of clinically significant prostate cancer (csPC, Gleason grade group >= 2).METHODS
UHB-DWI (b-values 50, 1000, 2000, 2500, 3500, 4000 s/mm², SE-EPI sequence, acq. time 15.8 min, 3x3x3 mm³ resolution, TR=4.7 s, TE=55 ms, bandwidth 2450 Hz/px, parallel imaging GRAPPA x2, matrix 102x76) was acquired in 55 patients with suspected csPC in addition to standard DWI (S-DWI) (b-values 50, 500, 1000, 1500 s/mm², SE-EPI sequence, acq. time 4.3 min, 2x2x3 mm³ resolution, TR=3.3 s, TE=48 ms, bandwidth 2230 Hz/px, parallel imaging GRAPPA x2, matrix 140x104) on a 3T MR scanner (Prisma, Siemens Healthineers). S-DWI images were extrapolated to the UHB b-values using a standard monoexponential fit (ME-DWI) and a kurtosis fit (K-DWI). ADC maps of UHB and S-DWI were calculated using monoexponential fit. Two raters (R1: 9 years and R2: 2 years of experience) independently assessed the 4 DWI and 2 ADC datasets in combination with T2-weighted images and ranked DWI and ADC maps according to diagnostic quality (confidence of lesion detection or lesion exclusion). In addition, index lesions were scored for visibility on a 5 point Likert scale and assigned a PI-RADSv2 score (positive if >3).RESULTS
Most frequent first and second place rankings were ME-DWI (87%) and UHB-DWI (36%) for R1 and S-DWI (49%) and UHB-DWI (40%) for R1. Both raters favored S-DWI-derived ADC maps (R1: 75%, R2: 69%). Best lesion visibility was on ME-DWI with an average score of 4.4 for R1 and 3.4 for R2, while S-ADC and UHB-ADC lesion visibility was nearly equal for both raters (R1: 4.2 vs. 4.1; R2: 3.6 vs. 3.7). R1 achieved accuracy of 0.80, sensitivity of 0.88 and specificity of 0.77 with NPV of 0.94, while R2 values were 0.71, 0.81, 0.67 and 0.90 for sPC detection.DISCUSSION
Regarding lesion detection, R1 clearly favored ME-DWI over all other contrasts while R2 had a moderate preference for S-DWI. Both raters ranked UHB-DWI second and preferred S-ADC for detection. For both raters, lesion visibility was best on ME-DWI and equal on S- and UHB-ADC. The experienced rater was better able to adapt the improved lesion visibility on ME-DWI confirmed by both raters into the lesion detection task and utilized it for superior predictive performance.CONCLUSION
ME-DWI arises as a promising contrast for lesion detection and assessment on prostate MRI. The added time expense and lower spatial resolution of measured UHB-DWI were not justified regarding rater preference compared to calculated ultra-high b-value maps.Acknowledgements
No acknowledgement found.References
No reference found.Figures
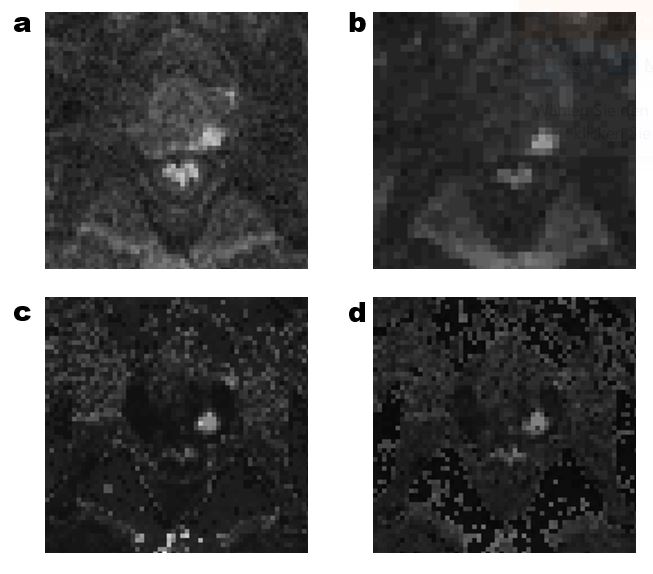
Example images of a
patient with PI-RADS 5 (a) measured S-DWI with b=1500 s/mm², (b) measured UHB-DWI
with b=4000 s/mm², (c) calculated ME-DWI (b=4000 s/mm²) and (d) calculated
K-DWI (b=4000 s/mm²).
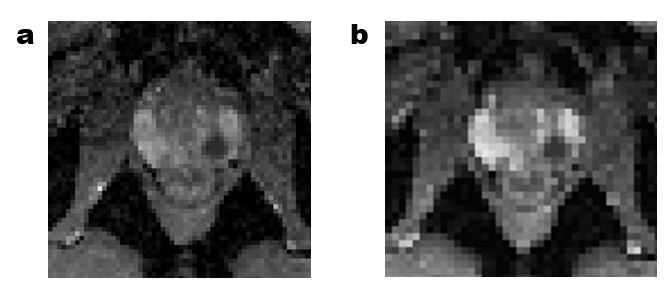
ADC maps calculated
from (a) S-DWI and (b) UHB-DWI for the same patient as in Fig. 1.