3625
Diffusion-Relaxation Imaging with B-tensor Encoding using the Cumulant Expansion1BWH Radiology, Harvard Medical School, Boston, MA, United States, 2Department of Radiology, Lund University, Lund, Sweden
Synopsis
Quantitative T2 and diffusion imaging provide important information about tissue microstructure. However, a joint knowledge of quantitative T2 and diffusion-derived measures can provide richer information about the microstructure that is not accessible when using these modalities independently. The standard approach for estimating the joint distributions of the T2-diffusion relies on the inverse Laplace transform. This transform is known to be unstable and difficult to invert. In this work, we introduce an alternative approach based on cumulant expansion, and extend the recently proposed multidimensional diffusion MRI framework ``Q-space Trajectory Imaging" (QTI) to include T2-relaxation modeling. The cumulants of the expansion include estimates of mean diffusion and T2 relaxation, as well as their variance and covariance. We demonstrate the feasibility of this approach in a healthy human brain.
Introduction
The vast majority of diffusion MRI (dMRI) applications are based on the Stejskal-Tanner pulse sequence [1], which employs a pair of pulsed magnetic field gradients for diffusion encoding. We refer to this sequence as the single diffusion encoding (SDE) experiment [12]. Recently several advanced dMRI sequences, such as double diffusion encoding (DDE) [2,3] and q-trajectory encoding (QTE) [4], have been proposed to probe tissue microstructure. In particular, q-trajectory imaging (QTI) [4] is general technique that uses QTE sequences to probe tissue microstructure. We present an extension to the QTI framework that incorporates T2-relaxation. This work is inspired by multidimensional correlation spectroscopy, which improves differentiation of heterogeneous media in the field of NMR [10]. The analysis of multidimensional MRI maps the correlation of the MRI signal across multiple dimensions of diffusion and T2-relaxation by varying corresponding parameters jointly during the acquisition. In particular, diffusion-relaxation correlation spectroscopy [5,6], and other related techniques [7,8,9,10,11], have been proposed to estimate the joint probability distribution of diffusivity and T2-relaxation coefficient by using diffusion MRI data acquired at different echo times (TE).Theory
In a system defiend by a distribution of diffusion tensors the signal is given by
$$s({\bf B}) = s_0 \int \rm{e}^{-({\bf D},{\bf B})} \rho({\bf D}) d {\bf D} \quad \text{(1)}$$
where $$$\bf{B}$$$ is a 3x3 matrix determined by the acquisition sequence, $$$\bf{D}$$$ denotes the diffusion tensor, $$$\rho(\bf{D})$$$ represents the diffusion tensor distribution (DTD) function of the underlying tissue, and $$$(\cdot, \cdot)$$$ denotes the standard inner product between matrices or tensors. By performing cumulant expansion we can identify mean and covariance terms of the signal:
\begin{equation}s(\mathbf{B}) \approx s_0\exp\left(-(\bar{\bf{D}}, \mathbf{B})+\frac{1}{2} (\mathbf{C}, \mathbf{B}^{\otimes 2})\right )\quad \text{(2)}\label{eq:cumulantQTI}\end{equation}
where $$$\bar{\bf{D}}= \langle \bf{D} \rangle_\rho,~\rm{and}~\bf{C}=\langle (\mathbf{D}-\bar{\mathbf{D}})^{\otimes 2} \rangle_\rho$$$. Below we will extend this framework to include T2-relaxation, i.e. the signal dependence on the echo time $$$t$$$ (TE), by modeling the MRI signal as
\begin{equation}s(\mathbf{B},t) = s_0 \int e^{-rt}e^{-(\mathbf{D},\mathbf{B})} \rho(r,\mathbf{D})~ dr d \mathbf{D} = s_0 \int e^{-rt -(\mathbf{D},\mathbf{B})} \rho(r,\mathbf{D})~ dr d \mathbf{D}\quad \text{(3)}\label{eq:QTIrelax}\end{equation}
where $$$\bf{B}$$$ is the diffusion measurement tensor $$$(b=\text{Tr}({\bf B}))$$$, $$$r$$$ is the T2-relaxation coefficient, and $$$\rho(r,\mathbf{D})$$$ represents the joint probability distribution of $$$r$$$ and $$$\bf{D}$$$. A typical approach for estimating $$$\rho(r, \mathbf{D})$$$ is to invert the Laplace transform using a large number of measurements acquired with different combinations of $$$\bf{B}$$$ and $$$t$$$. However, this approach requires very long scan time and the inversion is numerically unstable. It turns out that the cumulant expansion method, described in equation 2, can be used as an alternative analysis method to the inverse Laplace transform by cumulant expansion of the joint diffusion-relaxation distribution. In Westin [4], the first cumulant in equation 2, $$${\bf \bar{D}}$$$ is the mean diffusivity (of a diffusion tensor), and the second cumulant $$${\bf C}$$$ is a fourth-order tensor that describes the covariance of the diffusion parameters. When incorporating relaxation time into the signal model (equation 3) and expanding this signal, the same term contains additional covariances related to diffusion-relaxation. These terms can be identified as diffusion-relaxation tensor:\begin{equation}{\bf C}_{{\bf D}r} = \left(\begin{array}{rrr}c_{xx,r} & c_{xy,r} & c_{xz,r} \\c_{xy,r} & c_{yy,r} & c_{yz,r} \\c_{xz,r} & c_{yz,r} & c_{zz,r} \\\end{array}\right)\end{equation}and the variance of the relaxation $$$c_{rr}$$$.
Methods
Imaging was performed on a 3T scanner, with 80 mT/m-gradients, in a single healthy volunteer. Images were acquired with a prototype spin-echo sequence, using TE=[89, 130, 180]ms, TR=3.4s, resolution 2x2x4 mm3, 15 slices, partial-Furier=6/8. Gradient waveforms that yield linear, planar and spherical [4] b-tensors were tailored to the hardware [13] using a Maxwell-term compensated design [14]. We used b=[0.1 1 2] µm2/ms in 12 directions per shell and b-tensor shape.Results
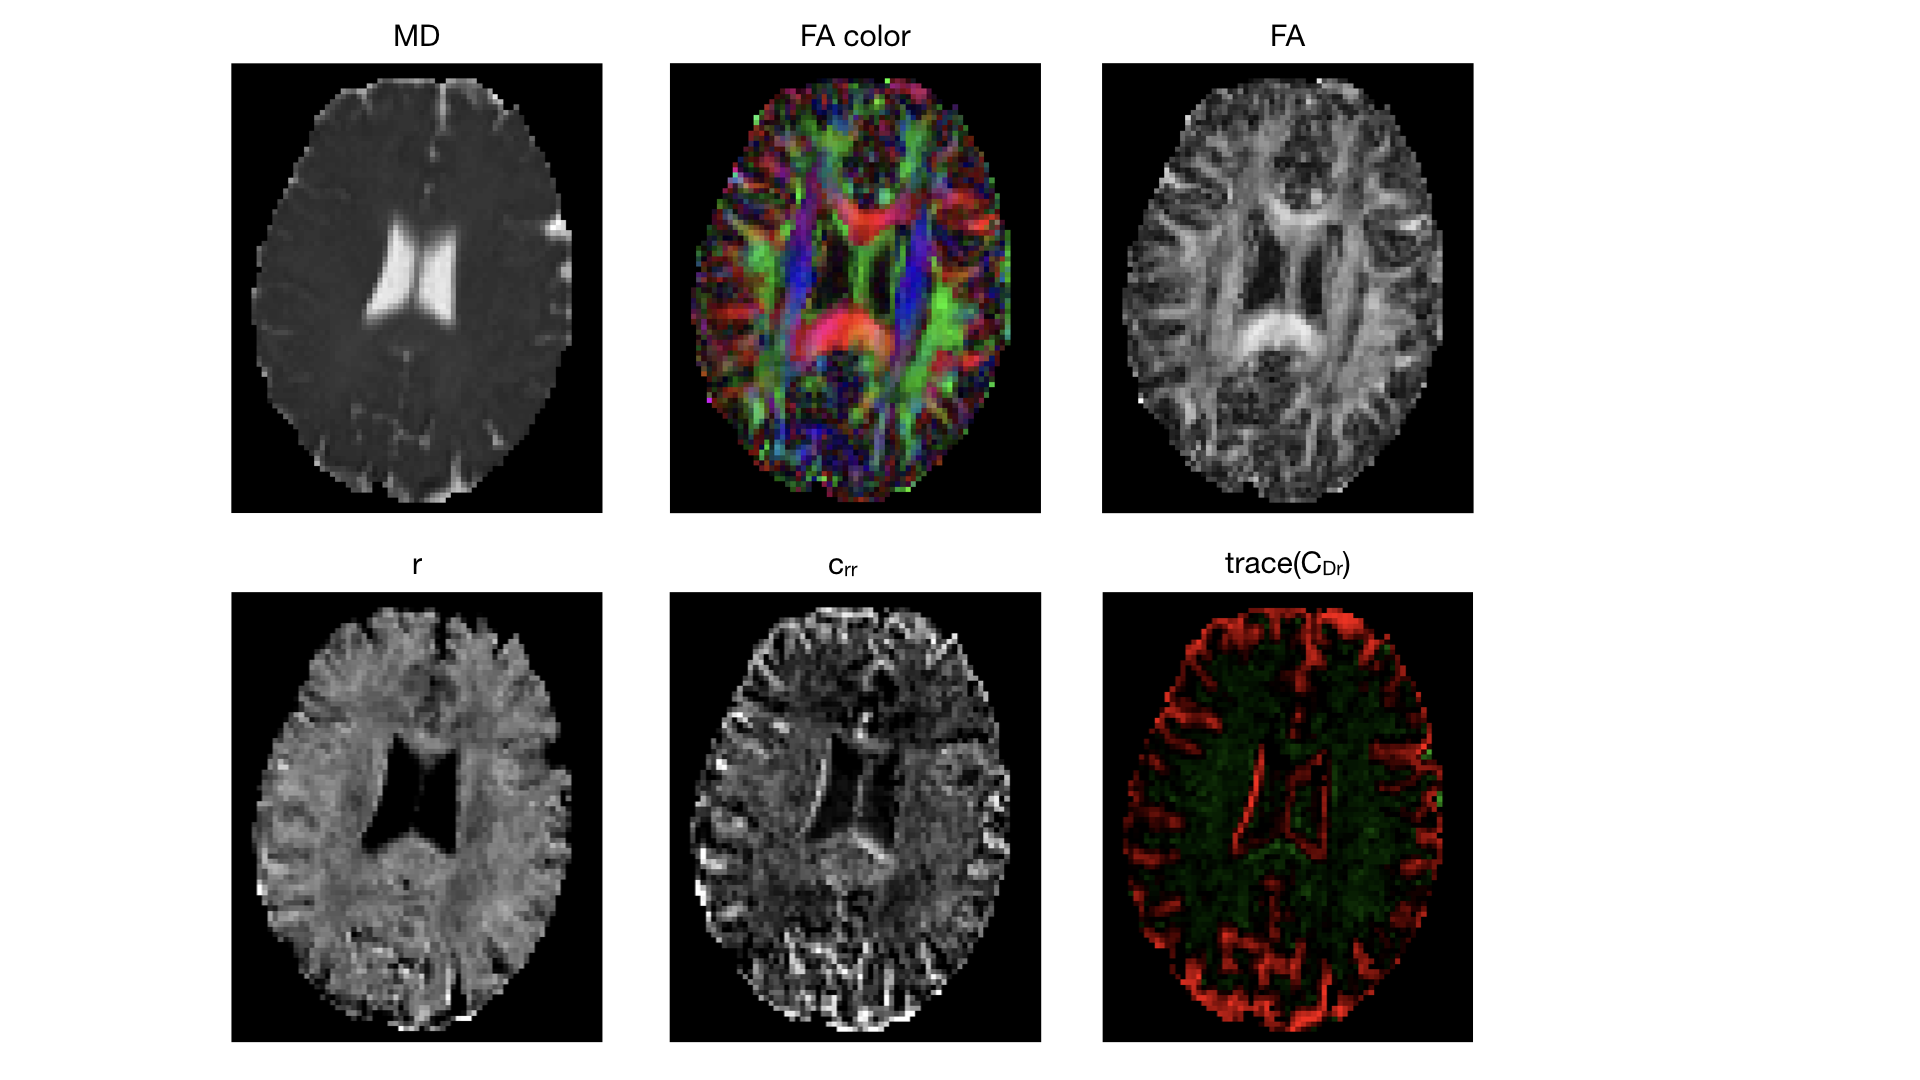
Figure 1 shows that inversion of equation 3 using the cumulant expansion is feasible and produces robust parameter maps. Examples of diffusion-relaxations parameters are demonstrated in an axial slice of the brain. Top row shows the mean diffusivity (MD), fractional anisotropy (FA) with and without color from the diffusion tensors obtained by the first cumulant. Bottom row shows the T2-relaxation, and the T2-relaxation variance $$$c_{rr}$$$, and the covariance between diffusion and relaxation (calculated as the trace of the diffusion-relaxation tensor $$$C_{Dr}$$$).Discussion and conclusion
In this work, we introduce an approach based on the cumulant expansion to probe T2-diffusion correlation by extending Q-space Trajectory Imaging to include T2-relaxation. The cumulants of the expansion estimate mean values of diffusion and T2-relaxation, as well as their variance and covariance. The presented work shows that it is feasible to perform diffusion-T2-relaxation encoding in the human brain by using B-tensor encoding while maintaining sufficient SNR. Forthcoming studies will investigate the applicability of this method in a clinical setting.Acknowledgements
We thank Siemens Healthcare for access to the pulse sequence programming environment. We acknowledge the following research grants NIH P41EB015902, NIH R01MH074794, SSF Framework grant AM13-0090, VR 2016-04482.References
[1] E. O. Stejskal, J. E. Tanner, Spin diffusion measurements: Spin echoes in the presence of a time-dependent field gradient, J Chem Phys 42 (1) (1965) 288–292.
[2] P. T. Callaghan, I. Furo ́, Diffusion-diffusion correlation and exchange as a signature for local order and dynamics, The Journal of Chemical Physics 120 (8) (2004) 4032–4038.
[3] P. P. Mitra, Multiple wave-vector extensions of the NMR pulsed-field- gradient spin-echo diffusion measurement, Phys. Rev. B 51 (1995) 15074– 15078.
[4] C.-F. Westin, H. Knutsson, O. Pasternak, F. Szczepankiewicz, E.Ozarslan, D. van Westen, C. Mattisson, M. Bogren, L. J. O’Donnell, M. Kubicki, D. Topgaard, M. Nilsson, Q-space trajectory imaging for multidimensional diffusion MRI of the human brain, NeuroImage 135 (2016) 345 – 362.
[5] M. Hurlimann, L. Venkataramanan, Quantitative measurement of two- dimensional distribution functions of diffusion and relaxation in grossly inhomogeneous fields, Journal of Magnetic Resonance 157 (1) (2002) 31 – 42.
[6] P. Galvosas, P. T. Callaghan, Multi-dimensional inverse Laplace spec- troscopy in the NMR of porous media, Comptes Rendus Physique 11 (2) (2010) 172 – 180.
[7] R. Bai, A. Cloninger, W. Czaja, P. J. Basser, Efficient 2D MRI relaxometry using compressed sensing, Journal of Magnetic Resonance 255 (2015) 88 – 99.
[8] D. Benjamini, P. J. Basser, Use of marginal distributions constrained opti- mization (MADCO) for accelerated 2D MRI relaxometry and diffusometry, Journal of Magnetic Resonance 271 (2016) 40 – 45.
[9] D. Kim, E. K. Doyle, J. L. Wisnowski, J. H. Kim, J. P. Haldar, Diffusion- relaxation correlation spectroscopic imaging: A multidimensional approach for probing microstructure, Magnetic Resonance in Medicine 78 (6) (2017) 2236–2249.
[10] J. P. De Almeida Martins, D. Topgaard, Multidimensional correlation of nuclear relaxation rates and diffusion tensors for model-free investigations of heterogeneous anisotropic porous materials, Scientific Reports (2018); 8:2488.
[11] J. Veraart, D. Novikov, E. Fieremans, TE dependent Diffusion Imaging (TEdDI) distinguishes between compartmental T2 relaxation times. NeuroImage (2017);182:360-369.
[12] N. Shemesh, S. Jespersen, D. Alexander, Y. Cohen, I Drobnjak, T Dyrby, J Finsterbusch, M Koch, T Kuder, F Laun, M Lawrenz, H Lundell, P Mitra, M Nilsson, E Ozarslan, D Topgaard, CF Westin. Conventions and Nomenclature for Double Diffusion Encoding NMR and MRI. Magnetic Resonance in Medicine. (2015) 75. 82-87.
[13] J. Sjolund, F. Szczepankiewicz, M. Nilsson, D. Topgaard, C.-F. Westin, H. Knutsson, Constrained optimization of gradient waveforms for generalized diffusion encoding, Journal of Magnetic Resonance 261 (2015) 157 – 168.
[14] Szczepankiewicz, F. & Nilsson, M. in Proc. Intl. Soc. Mag. Reson. Med. 26 (Paris, France, 2018)
Figures