3624
Diffusion MRI characterization of Proton-therapy-induced brain tissue changes: a case study1CIMeC - Center for Mind/Brain Sciences, University of Trento, Trento, Italy, 2Proton-Therapy Unit, S. Chiara Hospital, APSS, Azienda Provinciale per i Servizi Sanitari, Trento, Trento, Italy, 3Radiology Unit, Santa Maria del Carmine Hospital, Rovereto (Trento), Italy, 4Departments of Psychiatry and Radiology, Brigham and Women’s Hospital, Harvard Medical School, Boston, MA, United States
Synopsis
Radiotherapy-induced neurotoxicity may be life threatening and its characterization is crucial for cancer treatment management, especially in early treatment phases. Diffusion MRI allows to assess non-invasively microstructural changes occurring with radiation treatment, which are of interest in relation to local absorbed dose and cognitive changes. Proton therapy (PT) offers the promise of more focal tumor damage relative to conventional radiotherapy. However, few studies have evaluated how it affects brain microstructure. As part of an ongoing longitudinal study, we present the first available data of 5 acquisitions along PT course showing a possible treatment-related “necrosis-like” effect during treatment.
Introduction
In brain cancer radiation treatments, the possibility to characterize tissue modifications associated with irradiation is a critical necessity in order to possibly predict or assess radionecrosis effects in target and surrounding structures. The use of proton-, rather than photon-beams, allows to focus irradiation to treatment target and to reduce dose exposition of surrounding areas1,2. Despite its expected advantages, very few studies have characterized microstructural changes during and after proton-irradiation3. Here we evaluate longitudinal microstructural modifications occurring within treatment target during proton-therapy (PT) treatment in a pediatric patient with diffusion MRI and a bi-tensorial model. We further investigate microstructural indices in the brainstem, giving its proximity with treatment target. The ability to characterize acute tissue modifications might clarify mechanisms of tumor response to treatment, and to represent important advancements for patient management.Materials and Methods
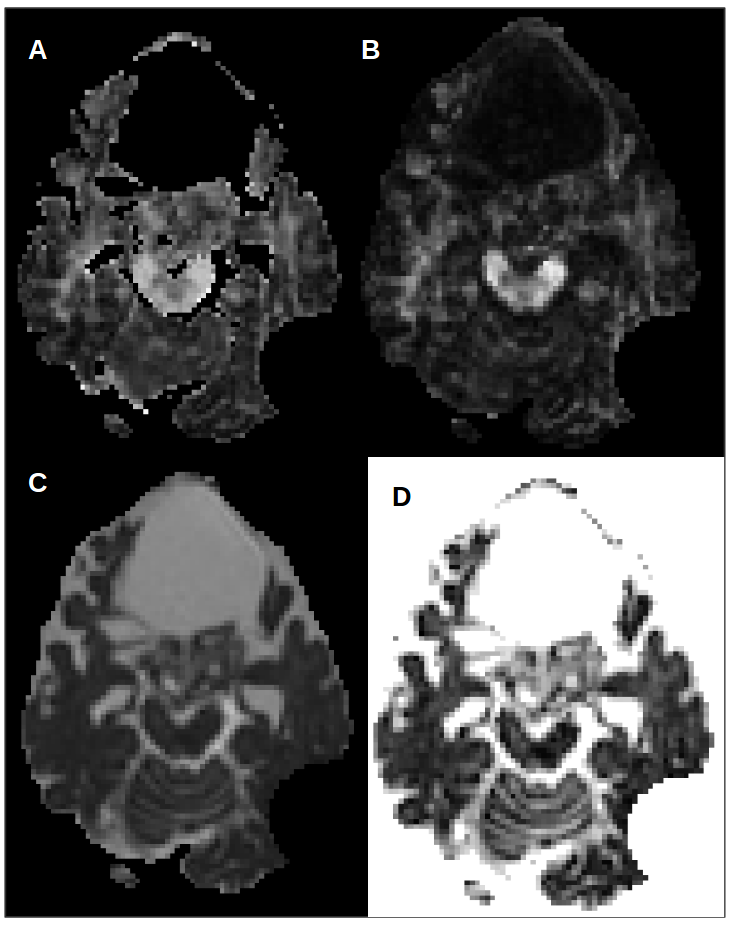
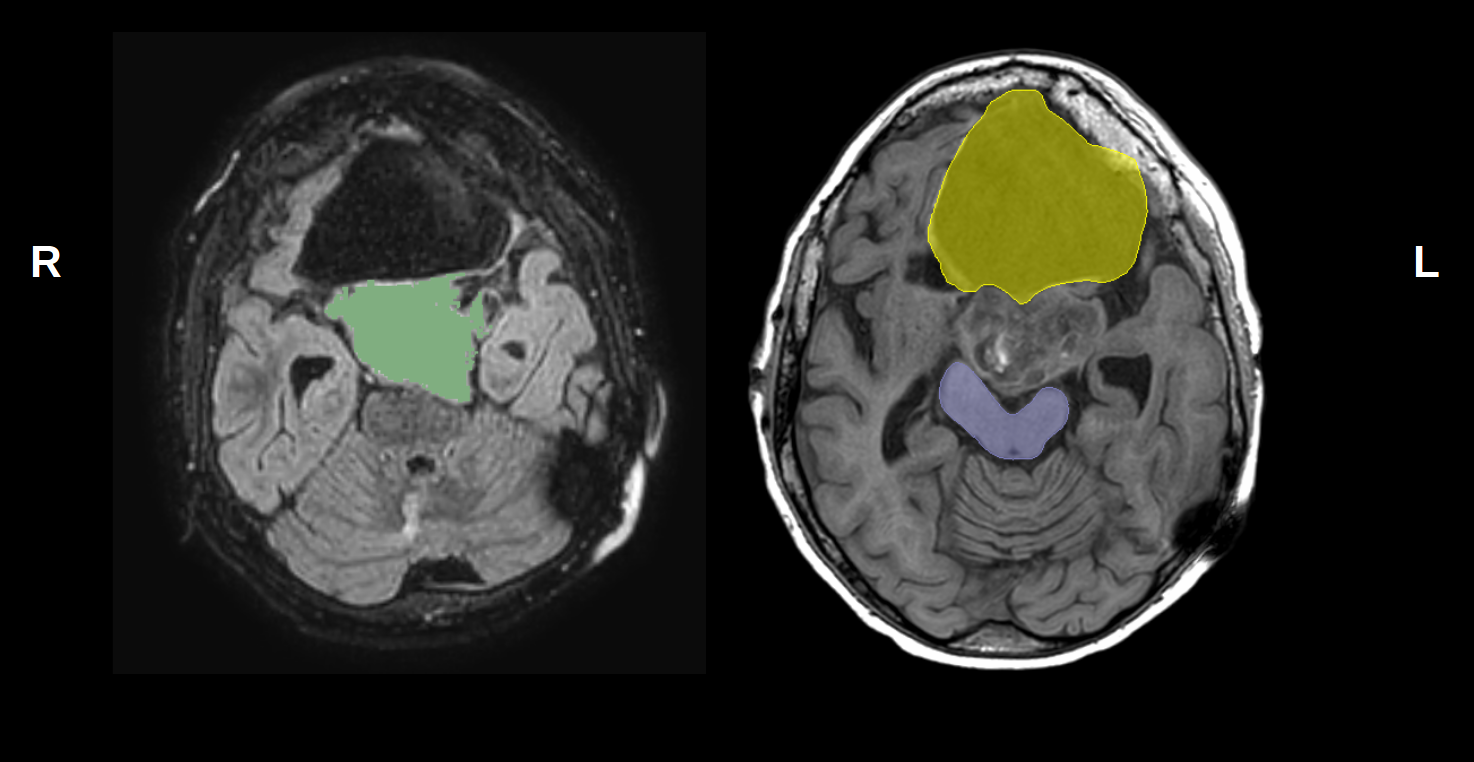
A 13 years old male presenting a pilocytic astrocytoma, grade I WHO, in orbitofrontal cortex extending cranially towards the left inferior and medial frontal gyri in proximity to the brainstem was investigated before, during, and at the end of his PT treatment (dose prescription 54 Gy, fractionated in 30 treatment sessions). A total of 5 diffusion (time points 1-4: 2mm isotropic voxel; time point 5: 1.75mmx1.75mmx2mm voxel, 32 gradients with b = 800s/mm2 and 1 b0 volumes, TE=102ms) and T1 anatomical (MPRAGE, time points 1, 4, 5: 0.45mmx0.45mmx0.8mm; time points 2, 3: 0.47mmx0.47mmx1mm) MRI acquisitions were collected corresponding to the following cumulative delivered PT dose respectively: 0 (pre-treatment), 16.2Gy, 30.6Gy, 43.2Gy, 52.2Gy. Before treatment an additional CT brain image was acquired. Diffusion MRI (dMRI) data was denoised4, corrected for Gibbs ringing5, eddy currents and motion6, skull stripped, and bias field corrected7 in MRtrix. DTI was used to compute Fractional Anisotropy (FA) and Mean Diffusivity (MD). The Free-Water elimination algorithm8 was applied to compute Free-Water-Corrected tissue-FA (FAt), and Free-Water (FW) maps (Fig. 1) from each dMRI time point. Free-Water elimination algorithm has been shown to increase test-retest reproducibility9. Co-registered pre-treatment T1, CT, and a FLAIR image were used to draw contours of (i) tumor, (ii) a cyst in the frontal lobe extending anteriorly from tumor, and (iii) brainstem (Fig. 2). All time points were aligned with the pre-treatment time point. We used these segmentations as Regions Of Interest (ROIs) from which median and standard deviation values of diffusion scalars were computed. Effect of treatment was then assessed per each ROI through a Kruskal-Wallis test on voxel values, and post-hoc comparisons were run between pre- and end-treatment values (Wilcoxon Rank Sum tests).Results
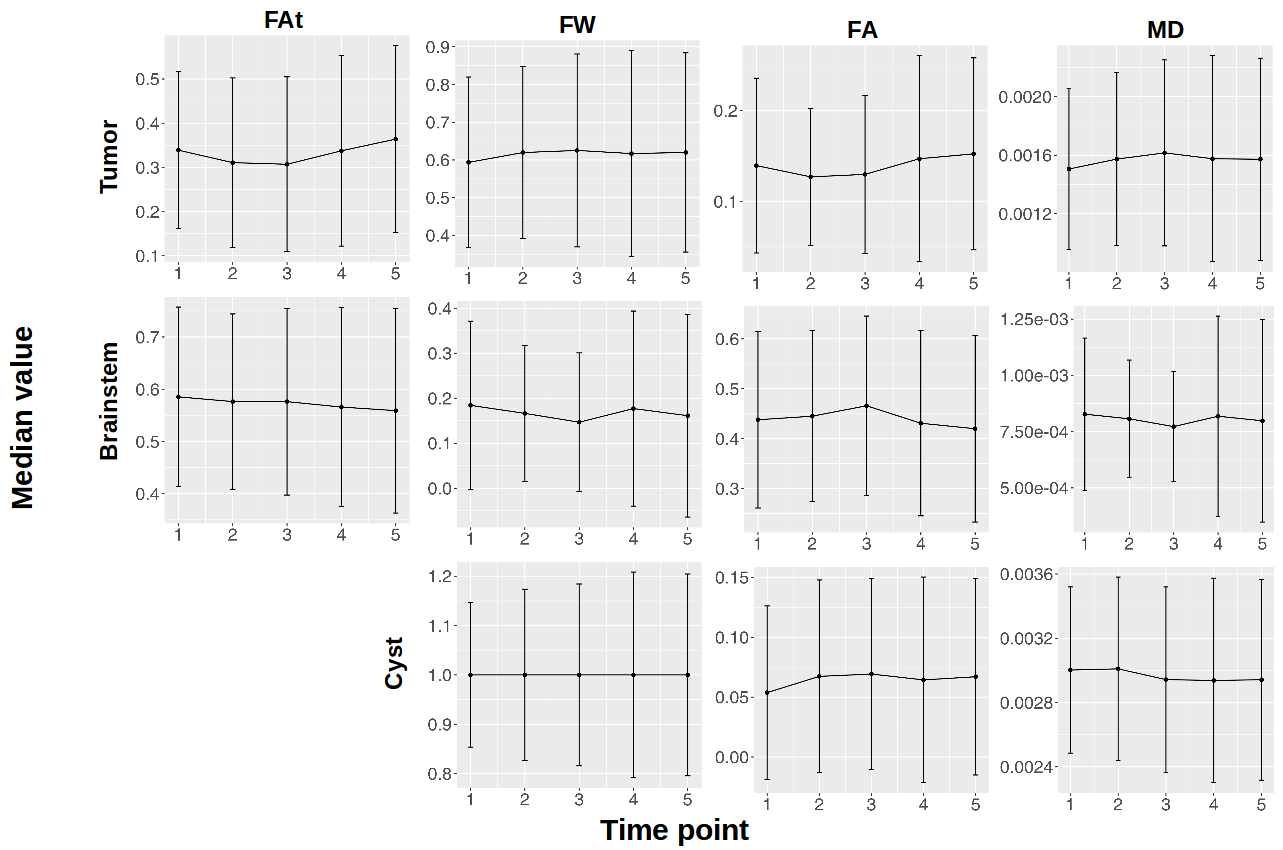
Statistically significant effects of time point (p < 0.001) were observed for all ROIs and diffusion scalar maps measured during PT course. Median diffusion scalar values per each ROI and scalar map are plotted in Fig. 3. In the tumor ROI, at treatment end, we measured small but significant increases with respect to pre-treatment values in FAt, FA, MD, and FW (median difference percentage: 5%, 6%, 3%, 3% respectively, p < 0.001), while in the brainstem we measured decreases in FAt, FA, MD, FW (median difference percentage: -3.3% (p < 0.001), -3% (p < 0.01), -2.5% (p < 0.01), -9% (p < 0.01), respectively). The cyst showed a significant increase in FA, and decreases in MD and FW (median difference percentage: FA: 15.4%, MD: -1.4%, changes in FW values distribution did not correspond to a variation in median, p < 0.001).Discussion and Conclusion
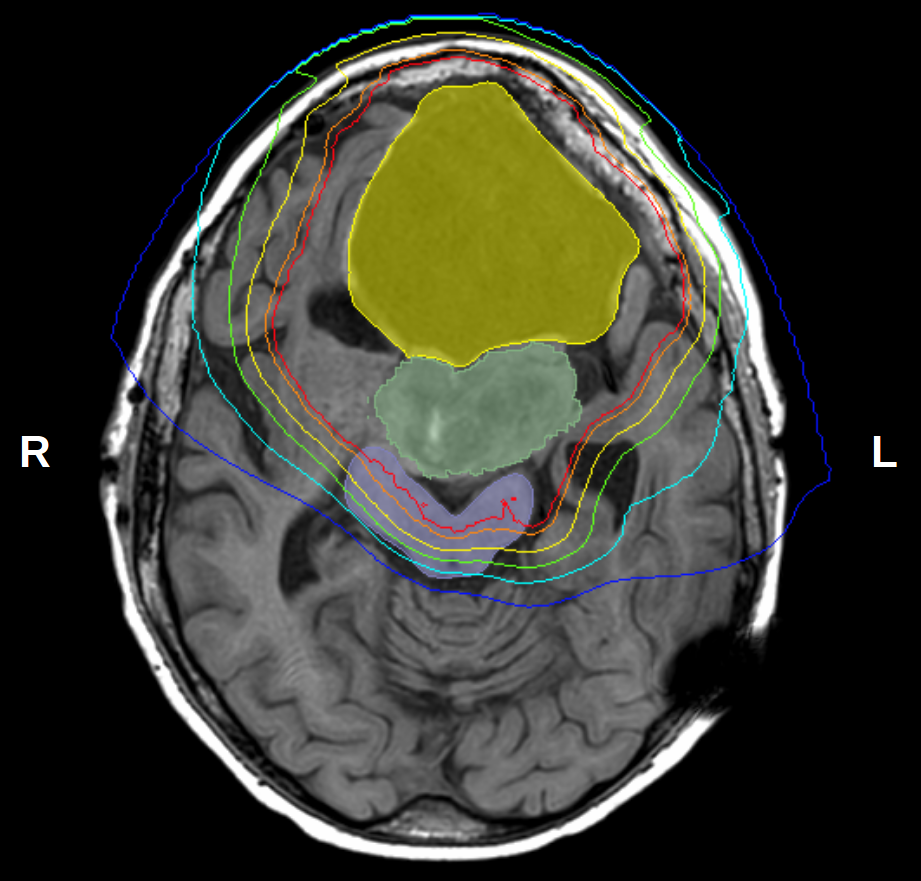
With the separation of the diffusion signal in tissue and water compartments, our analysis shows significant changes in diffusion indices within fully irradiated structures (Fig. 4). More specifically, we observed concurrent increases in both free-water and anisotropic compartments within the solid tumor portion of the lesion suggesting a possible treatment-related “necrosis-like” effect10 with possibly preserved fibrillary structure of the tumor at this early stage. In addition, observed changes in cyst diffusion indices point to possible treatment-induced modifications of its tissue component. We further observed changes of microstructural indices in the brainstem, however these changes were not as significant as those observed in tumor and cyst, in agreement with the lower dose exposure in brainstem. The investigation of tissue modifications during PT treatment might provide new understandings of tumor response mechanisms and might represent valuable new opportunities to assess tumor and surrounding tissue responses for treatment adaptations.Acknowledgements
No acknowledgement found.References
[1] Jones, DTL et al., Present status and future trends of heavy particle radiotherapy, in: E. Baron, M. Lieuvin (Eds.), Cyclotrons and Their Applications. 1998;13-20
[2] Mohan, R & Grosshans, D, Proton therapy - Present and future. Advanced Drug Delivery Reviews. 2017;109:26-44
[3] Hou, P et al., Proton Therapy for Juvenile Pilocytic Astrocytoma: Quantifying Treatment Responses by Magnetic Resonance Diffusion Tensor Imaging. IJPT. 2017;3(3):414-420
[4] Veraart, J et al., Denoising of diffusion MRI using random matrix theory. Neuroimage. 2016;142:394-406
[5] Kellner, E et al., Gibbs-ringing artifact removal based on local subvoxel-shifts. Magn Reson Med. 2016;76(5):1574-1581
[6] Jesper LR et al., An integrated approach to correction for off-resonance effects and subject movement in diffusion MR imaging. Neuroimage. 2016;125:1063-1078
[7] Tustison, N et al., N4ITK: Improved N3 Bias Correction. IEEE Trans Med Imaging. 2010;29(6):1310-20
[8] Pasternak, O et al., Free water elimination and mapping from diffusion MRI. Magn Reson Med. 2009;62(3):717-30
[9] Albi, A et al., Free Water Elimination Improves Test–Retest Reproducibility of Diffusion Tensor Imaging Indices in the Brain: A Longitudinal Multisite Study of Healthy Elderly Subjects. Hum Brain Mapping. 2017;38(1):12-26
[10] Thoeny H & Ross, B, Predicting and Monitoring Cancer Treatment Response with Diffusion-Weighted MRI, J Magn Reson Imaging, 2010;32(1):2-16
Figures