3622
Assessing inter-vender reproducibility of diffusion tensor imaging of the spinal cord for multi-center imaging studies1Orthopedic Surgery, Chiba University Graduate School of Medicine, Chiba City, Japan, 2radiology, Chiba University Hospital, Chiba City, Japan, 3radiology, Asahi General Hospital, Asahi City, Japan
Synopsis
In this study, we assessed the inter-vendor precision of diffusion tensor imaging (DTI) metrics using consensus acquisition protocol across 3T scanners from 3 main vendor at the two sites. The data were acquired from the traveling human healthy volunteer. DTI data and anatomical images were also acquired and imaging data were processed using the Spinal Cord Toolbox (SCT). Relatively higher inter vender reproducibility of fractional anisotropy (FA) in and cross-sectional area were demonstrated and it is considered feasible to conduct multicenter DTI studies of the spinal cord using FA value as biomarker and SCT as postprocessing tool.
Intoroduction
Magnetic resonance imaging (MRI) is routinely used in practice to diagnose spinal cord pathology. However, the information acquired by conventional MRI does not provide specific and quantitative measurements. To overcome these imprecisions, diffusion tensor imaging (DTI) has been applied to spinal cord providing quantitative information about the microstructure of tissue in vivo. The evidence level of DTI study of the spinal cord has been remained low, because number of the participants of the studies are limited. (ARM review 2016) In order to improve the quality of evidence for DTI studies of the spinal cord, multicenter study can be an option to increase number of participants and statistical power. However, how difference in MR scanner vender and model affects the parameter of spinal cord DTI has not been well studied. In this study, we assessed the inter-site precision of DTI metrics from a harmonized DTI protocol across 3T scanners from 3 main vendor at the two sites. The data were acquired from the traveling human healthy volunteer.Methods
After approval from the
local review board and signed consent, the travelling 7 healthy
volunteers (seven male; aged 25–34
years at scan timing; mean 29
years) were enrolled in this study. Data were acquired on 3T scanners from 3
main vendor at the two sites. Each subject was scanned twice using three 3T
scanners as follows: site 1, Discovery
750 (GE Healthcare, Milwaukee,
WI, USA) and Ingenia
(Philips Healthcare, Best, the Netherlands); and site 2, Verio (Siemens
Healthineers, Erlangen, Germany). A recent study introduced a consensus
acquisition protocol dedicated to the spinal cord. This protocol is freely
available for GE, Philips, and Siemens platforms (https://osf.io/tt4z9/). (Cohen adad 2018) We used this protocol with
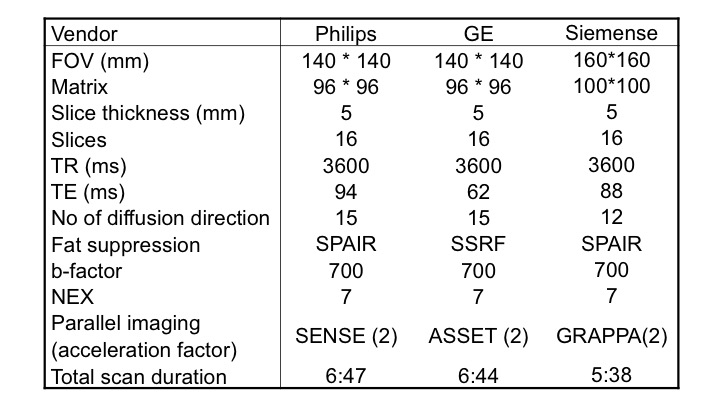
slight modification. DTI data were acquired with a single-shot
echo–planar sequence with the parameters in each
scanner, which is shown in Table
1. Additionally, anatomical imaging was
acquired using a multi-echo gradient echo sequence and isotropic 3D fast spin
echo sequence in all scanners to enable
template-based analysis of diffusion-weighted data, in process with
co-registration to the template performed via the anatomical images. Imaging
data were processed using the Spinal Cord Toolbox, Version 3.2 (SCT; https://www.nitrc.org/projects/sct/).
(De Leener et al 2017) Spinal
cord segmentation was automatically performed using anatomical images and the
mean diffusivity map of DTI. Images were nonlinearly registered to the
MNI-Poly-AMU template/ atlas in SCT. DTI was motion-corrected and diffusion
tensors were calculated. Fractional anisotropy (FA) and mean diffusivity (MD) were
extracted from three ROIs: whole white matter(WM), lateral funiculi(LF) and
dorsal columns(DC), as implemented in the SCT. Cross-sectional area (CSA)
of the whole spinal cord and WM at each spinal cord segment levels are also
calculated. Inter-vender comparison of FA
and MD in WM, LF and DC and CSA in whole cord and WM at each spinal cord level
were performed. We calculated the coefficient of variation (CVs ;
calculated using CV = 100×(mean/ standard deviation) %) to
assess reproducibility in pair of inter-vendor scans.Results
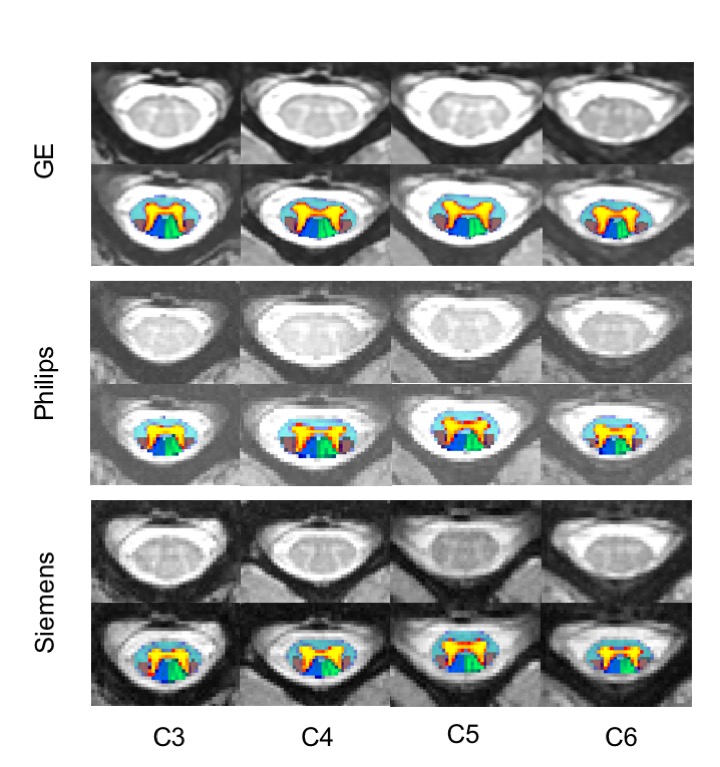
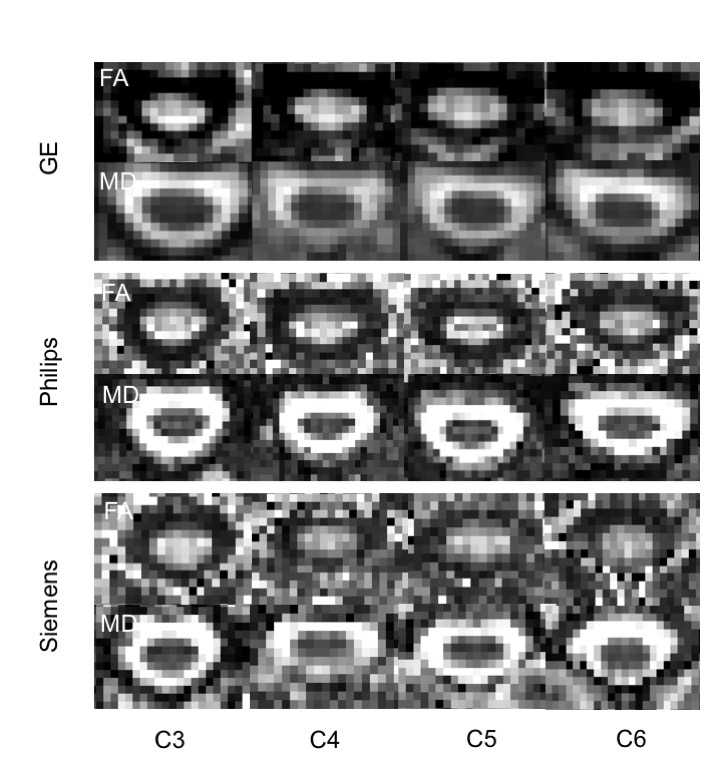
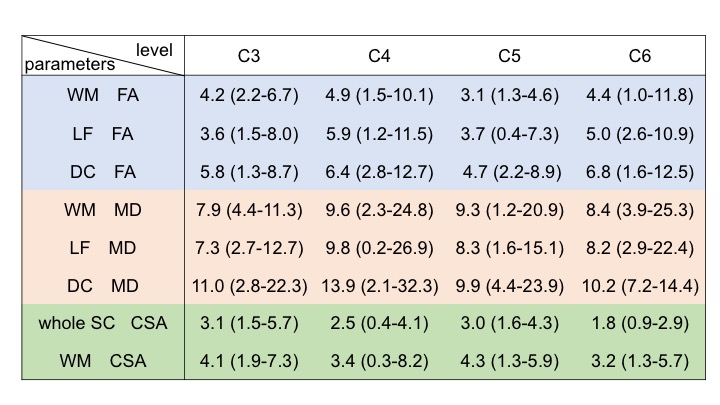
Figure 1 represents axial anatomical structure from a same single healthy volunteer acquired in the scanner from 3 different venders. High-resolution T2*-weighted axial images clearly show the butterfly shaped gray matter and the SCT probabilistic maps were overlaid following registration to the SCT atlas. Figure 2 shows FA maps derived from same subject acquired in the scanner from 3 different venders. Table 2 summarizes the CVs of atlas-based analysis for inter-vender scans. Using SCT atlas-based approach, with consensus acquisition protocol, CVs of inter vender reproducibility of FA in WM, LF and DC were below 7%, showing good reliability. Moreover, CVs for CSA in whole spinal cord and WM were below 5% showing excellent reproducibility. Whereas the mean CVs of MD in WM, LF and DC ranged from 7-14%.Discussion and Conclusions
We have presented the inter-vendor precision of DTI metrics from a harmonized DTI protocol across 3T scanners from 3 main vendor using the data acquired from the traveling human healthy volunteer. Given its good reproducibility, it is considered feasible to conduct multicenter DTI studies of the spinal cord using FA value as biomarker and SCT as postprocessing tool. The systematic review of clinical studies using DTI revealed FA had the strongest evidence of utility, with moderate quality evidence for its use as a biomarker showing correlation with disability in several clinical pathologies. Thus, higher reproducibility of FA in inter-vendor scans supports its use in multi-center study as reliable imaging biomarker.Acknowledgements
NoneReferences
1. Martin AR et al. Translating state-of-the-art spinal cord MRI techniques to clinical use: A systematic review of clinical studies utilizing DTI, MT, MWF, MRS, and fMRI. NeuroImage Clin 2016; 10:192–238.
2. Cohen-Adad J. Microstructural imaging in the spinal cord and validation strategies. Neuroimage. 2018; 182:169–83.
3. De Leener B et al. SCT: spinal cord toolbox, an open-source software for processing spinal cord MRI data. Neuroimage. 2017; 145:24–43.
Figures