3621
Finding the Surrogate Biomarkers of Glioma Infiltration in the Normal Appearing White Matter adjacent to Tumor using Neurite Orientation Dispersion and Density Imaging (NODDI)1Institute of Brain Science, National Yang-Ming University, Taipei, Taiwan, 2Department of Medical Research and Education, Taipei Veterans General Hospital, Taipei Veterans General Hospital, Taipei, Taiwan, 3Department of Radiology, Taipei Veterans General Hospital, Taipei, Taiwan
Synopsis
This work addresses the study in glioma, where Diffusion Tensor Imaging (DTI) provides incoherent information while Neurite orientation dispersion and density imaging (NODDI) may improve the microstructural characterization. Glioma recurrences are mostly located at the margin of the resection cavity as peritumoral area. NODDI, using a compartment-based biophysical model, would potentially provide specific surrogate biomarkers for the microscopic foci of glioma infiltration better than DTI. NODDI reveals that glioma cells can extend beyond the bulk tumor and peritumoral edema into
Introduction
Glioma recurrences are mostly located at the margin of the resection cavity [1] as peritumoral area, where malignant cells existed in macroscopically unsuspicious parenchyma remote from tumor localization [2]. Prognosis, evaluation and management of patients with diffuse gliomas have changed after the identification of mutations in a gene encoding isocitrate dehydrogenase (IDH) [3]. The overall survival rate of patients with IDH mutated (IDHmut) glioma is better than those with IDH wildtype (IDHwt) [4]. Actual tumor margins can microscopically extend for several centimeters beyond the margin detected by clinical imaging [5] The perplexity of peritumoral area may be discovered using Neurite orientation dispersion and density imaging (NODDI) [6] and Diffusion Tensor Imaging (DTI) to redefine the tumor-infiltrated margins and confront the tumor recurrences in long-term treatment of glioma. Microscopic foci of tumor invasion in peritumoral area could cause statistically significant changes in indices derived from NODDI and DTI.Methods
Patients: Eighteen patients with gliomas, who received operation, were recruited for the studies using the 3T MRI. The patients were classified as the groups of 12 IDHmut and 6 IDHwt by the pathological reports.
Image Acquisition: Diffusion weighted images were acquired using the dual spin-echo echo planar image (EPI) sequence with following parameters: TR/TE = 11300/92.6 ms and two shells of spherical 24 and 48 gradients directions at b-values of 700, and 2000 s/mm2, respectively, with ten interleaved b0 (b-value=0).
ROI Definition and Model-based Indices: By subtracting areas of tumor and peritumoral edema, tissue probabilistic maps of white matter (WM) and gray matter (GM) were restricted by a threshold of 0.9 by Segmentation of Statistical Parametric Mapping. Ipsilesional normal appearing area of white matter (NAWM) / gray matter (NAGM) and surrounded concentric areas (surNAWM / surNAGM) were manually created by three voxels-width regions around the edge of peritumoral edema and normal appearing area, respectively by conjunction with tissue segmentation of GM and WM. In the meanwhile, flip-ROIs of each ipsilesional ROIs were also sub-divided as four control areas (flip-NAWM/ flip-NAGM/ flip-surNAWM/ flip-surNAGM. NODDI indices included intra-cellular volume fraction (FICV), isotropic volume fraction (FISO) and orientation dispersion index (ODI), derived from NODDI Matlab toolbox. DTI indices included fractional anisotropy (FA) and mean diffusivity (MD) by “dtifit”, in FMIRB Diffusion Toolbox (FDT).
Statistics: The NODDI and DTI indices of ipsilesional ROIs were compared with those of contralateral areas (flip area) using Mann-Whitney U-tests to identify the characteristics of tumor proliferation. Distinguishability of two groups -IDHmut and IDHwt was also examined using Mann-Whitney U-tests, receiver operating characteristic (ROC curve) and tumor to normal contralateral ratio (T/N ratio). P value less than 0.05 was considered to be statistically significant.
Results
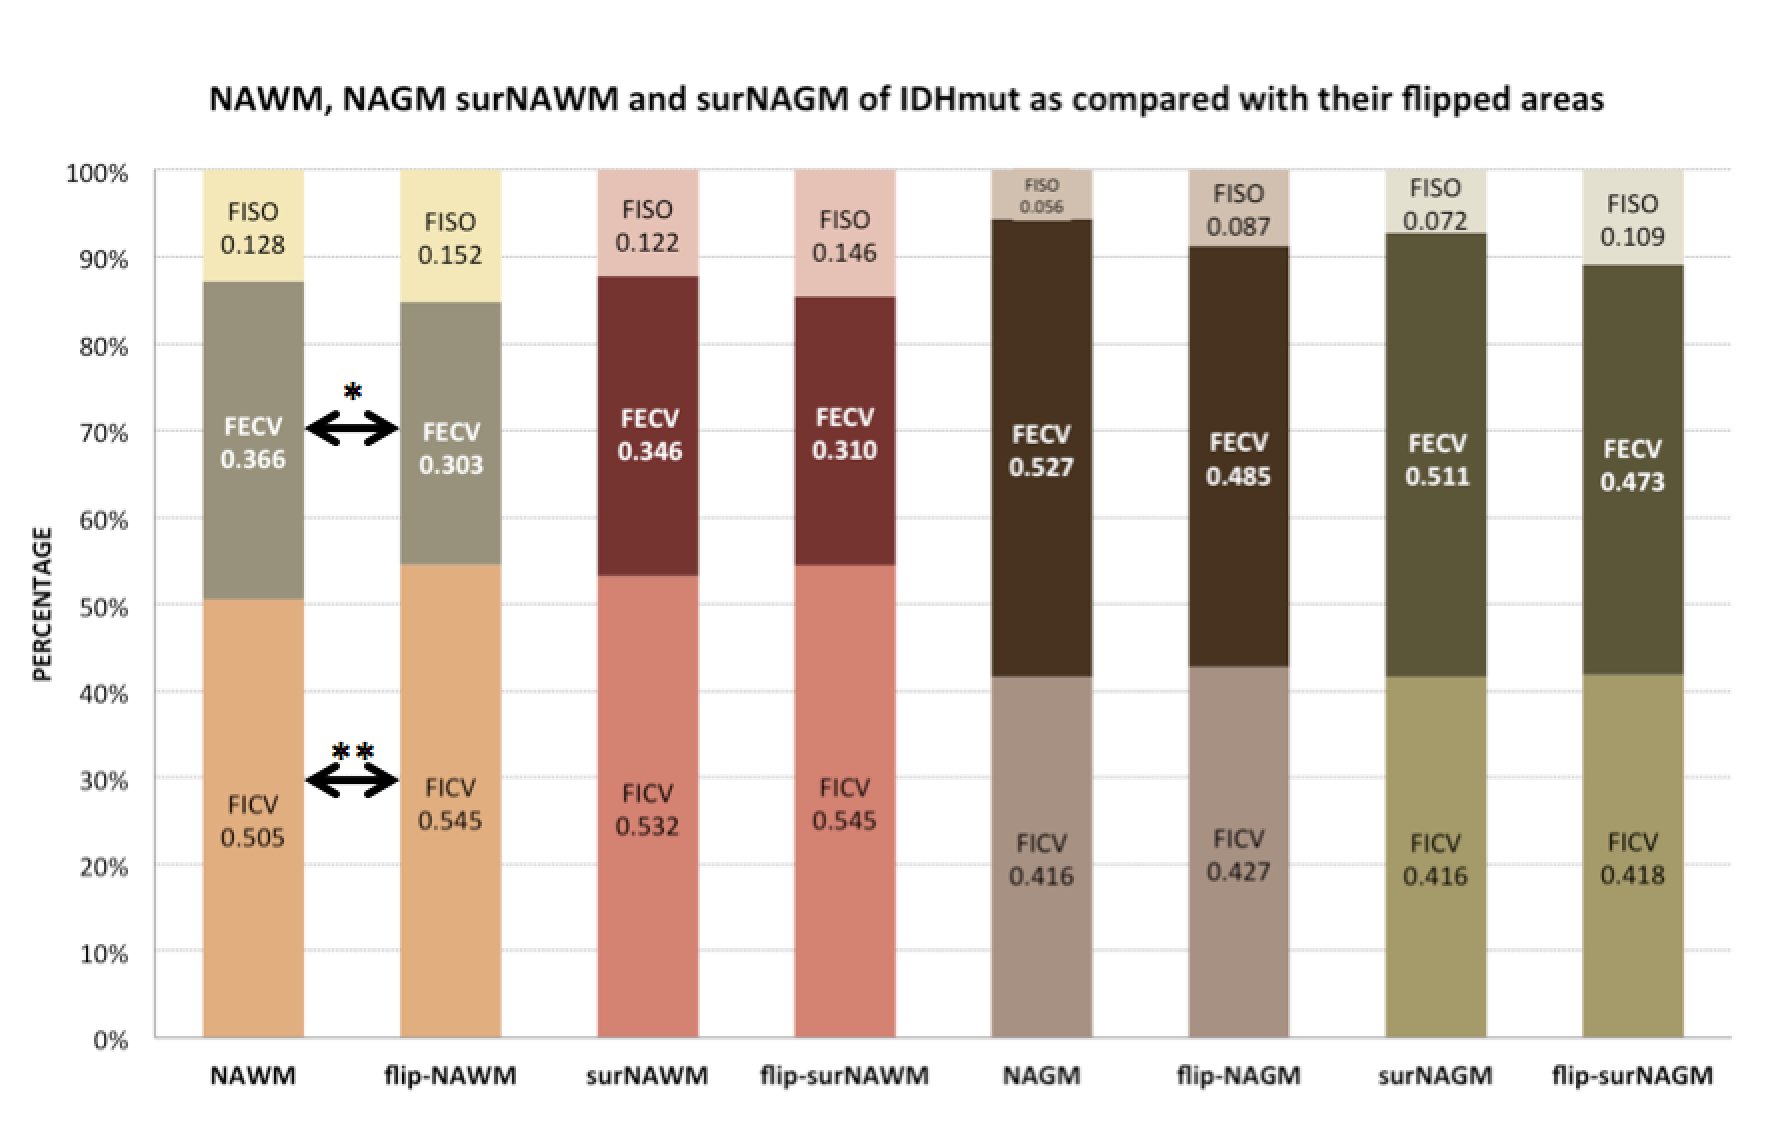
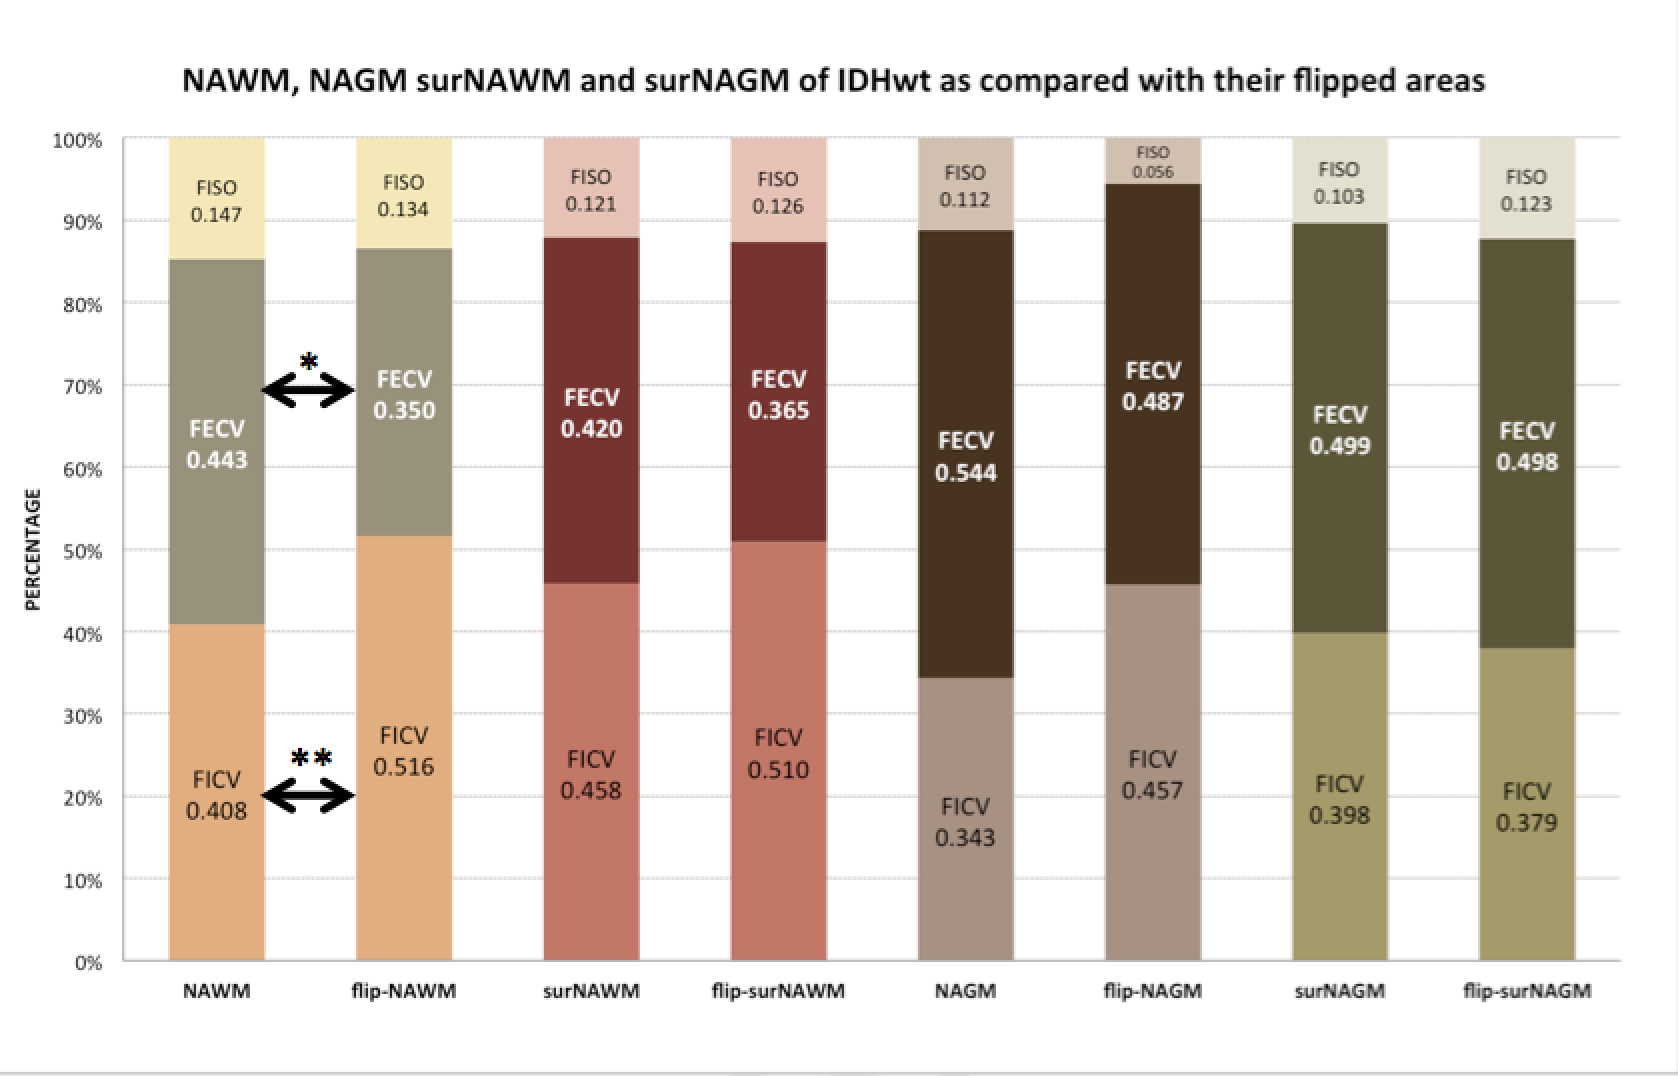
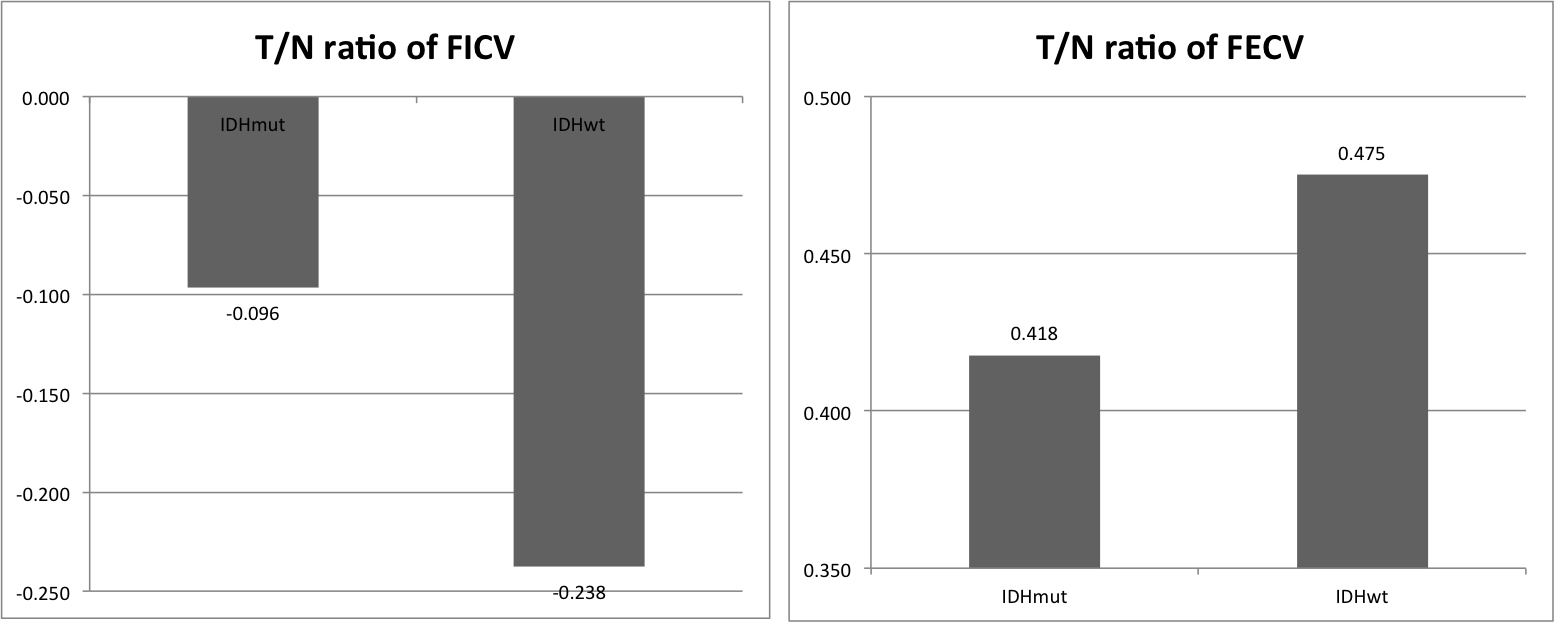
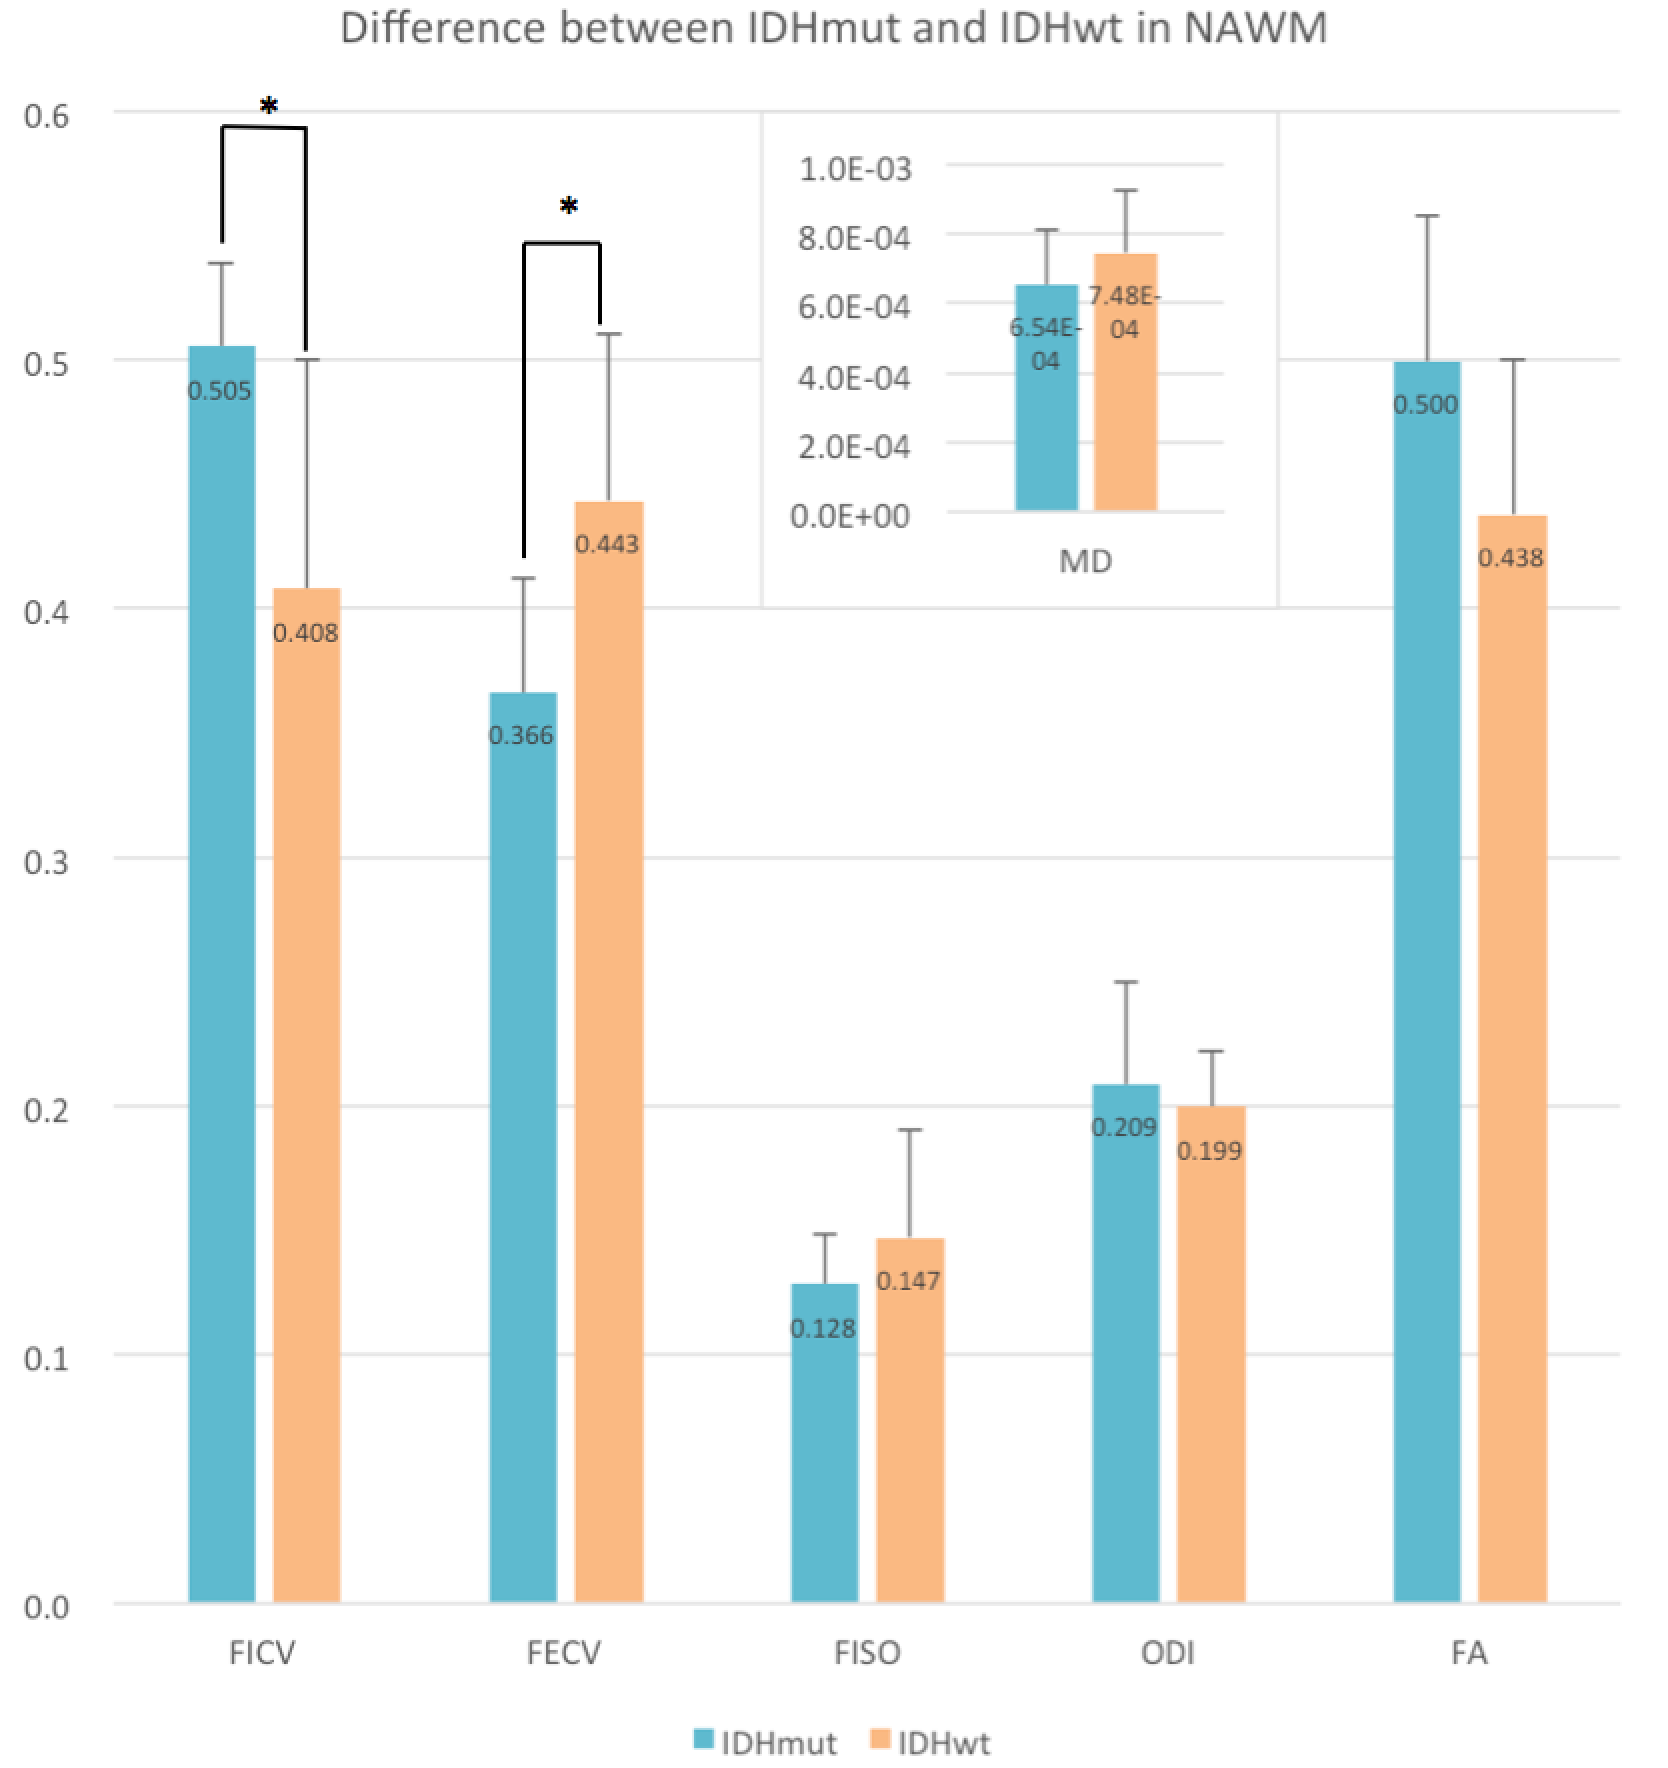
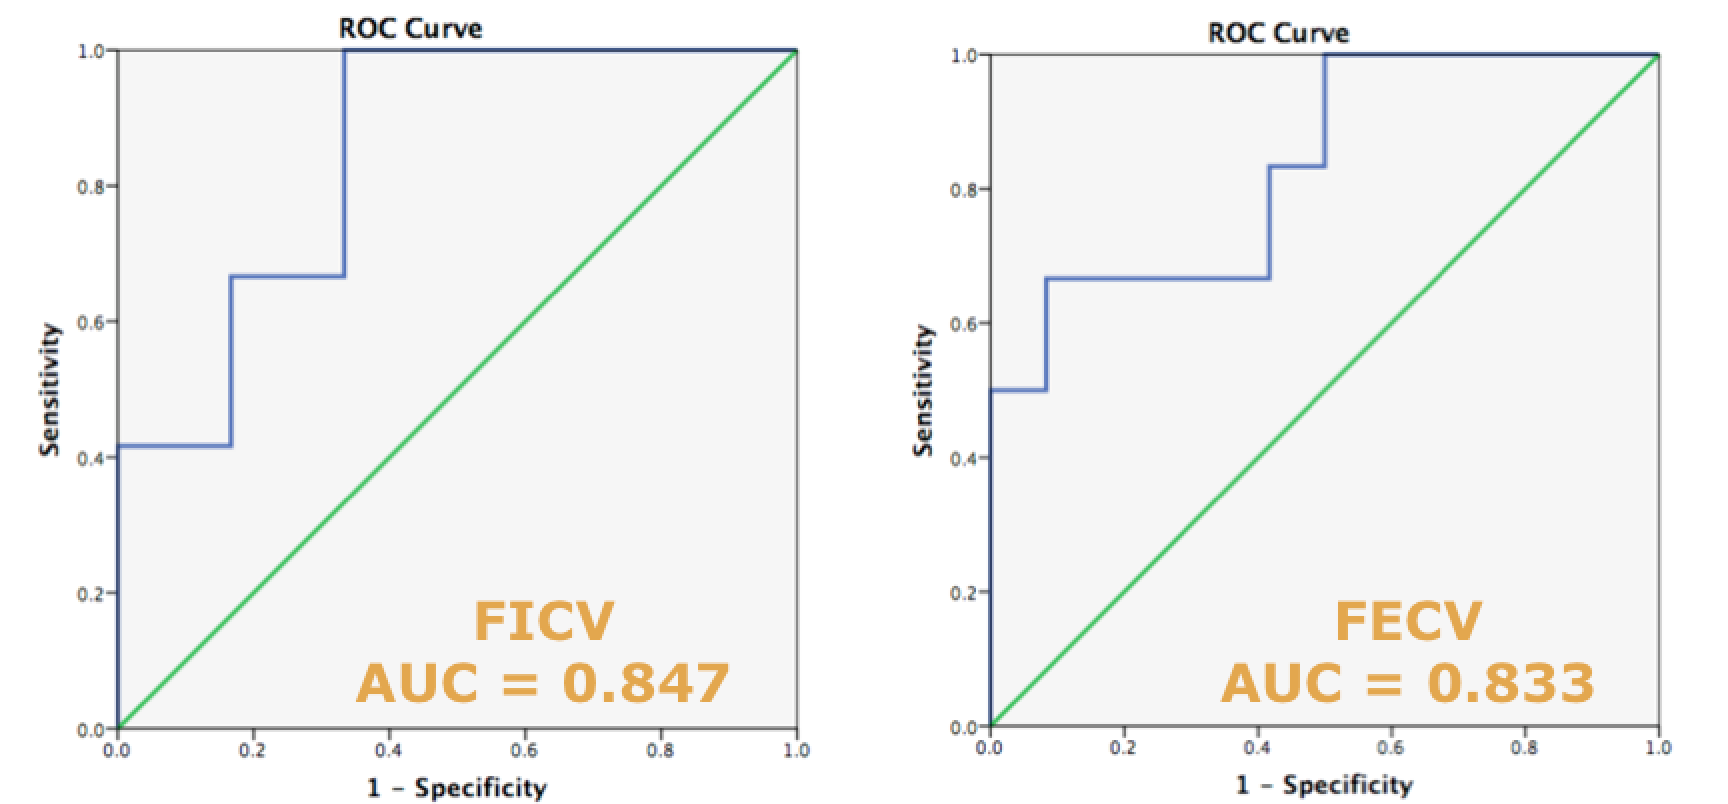
FICV and FECV indicated the significant difference in NAWM of IDHmut (p=0.024 / 0.010, respectively) and IDHwt (p =0.041 / 0.009, respectively) compared to flip-NAWM (Figures 1 and 2). Besides, FISO, FA and MD also showed no difference (p >0.1) between ipsilesional and contralateral areas of IDHmut / IDHwt. Furthermore, there is no significant difference in two contralateral areas of IDHmut and IDHwt (p >0.3). IDHwt was shown to have a higher average of T/N (FICV=-0.238, FECV=0.475) compared to IDHmut (FICV=-0.096, FECV=0.418) (Figures 3). To differentiate IDHmut from IDHwt in the ipsilesional normal appearing areas, significantly increase of FECV (p=0.024) with descended FICV (p=0.018) was demonstrated in NAWM of IDHwt as compared with NAWM of IDHmut (Figures 4). Also, ODI, FISO, FA and MD indices had no discernibility of two geno-type gliomas. The ROC curves were obtained for differentiation between IDHmut and IDHwt using FICV and FECV of NAWM AUC were 0.847 and 0.833, respectively (Figures 5).Discussion
In the brain tumor model, an increase of extracellular space (volume/total tissue volume) is found with overproduction of ECM [7] [8]. As compared to contralateral WM in our results, the dramatically increased FECV and decreased FICV in NAWM of IDHwt may reflect invasion of tumor cells along fiber tracts and co-existence of glial cells in the ECS around the neurites. Infiltration of tumor with higher tumor cellularity did not follow the restricted stick model of anisotropic Gaussian diffusion (FICV), when hindered model of anisotropic non-Gaussian diffusion (FECV) was the suitable model.Conclusion
As compared to their contralateral areas in each IDHmut and IDHwt groups, elevated FECV companied with decreased FICV spread to NAWM. NODDI provide these set of novel diffusion scalar metrics that improve the accurate glioma differentiation of IDHmut and IDHwt in NAWM. As a result, Pattern of increased FECV and decreased FICV could be an early indicator of microstructural changes of the NAWM attributed to increased extracellular space of tumor modal and invading tumor cells along fiber tracts while DTI could not.Acknowledgements
This study was supported by a grant from Taipei Veterans General Hospital.References
[1] Lemee, J.M., et al., Characterizing the peritumoral brain zone in glioblastoma: a multidisciplinary analysis. J Neurooncol, 2015. 122(1): p. 53-61.
[2] Kallenberg, K., et al., Abnormalities in the normal appearing white matter of the cerebral hemisphere contralateral to a malignant brain tumor detected by diffusion tensor imaging. Folia Neuropathol, 2014. 52(3): p. 226-33.
[3] Parsons, D.W., et al., An integrated genomic analysis of human glioblastoma multiforme. Science, 2008. 321(5897): p. 1807-12.
[4] Parsons, D.W., et al., An integrated genomic analysis of human glioblastoma multiforme. Science, 2008. 321(5897): p. 1807-12.
[5] DeAngelis, L.M., Brain tumors. N Engl J Med, 2001. 344(2): p. 114-23.
[6] Zhang, H., et al., NODDI: practical in vivo neurite orientation dispersion and density imaging of the human brain. Neuroimage, 2012. 61(4): p. 1000-16.
[7] Zhang, H. and A.S. Verkman, Microfiberoptic measurement of extracellular space volume in brain and tumor slices based on fluorescent dye partitioning. Biophys J, 2010. 99(4): p. 1284-91.
[8] Vargova, L., et al., Diffusion parameters of the extracellular space in human gliomas. Glia, 2003. 42(1): p. 77-88.
Figures