3618
Characterization of white matter asymmetries in the healthy human brain using diffusion MRI fixel-based analysis1Florey Institute of Neuroscience and Mental Health, Melbourne, Australia, 2Florey Department of Neuroscience and Mental health, Melbourne, Australia, 3The University of Sydney, Sydney Imaging, Sydney, Australia, 4The University of Sydney, School of Aerospace, Mechanical and Mechatronic Engineering, Sydney, Australia
Synopsis
The diffusion tensor model has been used extensively to study asymmetry in various regions of the human brain white matter. However, given the limitations of the tensor model, the nature of any underlying asymmetries remain uncertain, particularly in crossing
Introduction
While the human brain is broadly a symmetric organ, asymmetries have been reported in terms of structure, function and behavior.1,2 Neuroimaging methods, such as fMRI, have demonstrated hemispheric specificity for a range of language, motor, and spatial tasks.3 Structural MRI studies have revealed a number of asymmetries in cortical thickness or gray matter volumes.4 Diffusion tensor imaging (DTI) studies have demonstrated asymmetries of white matter tracts, such as cingulum bundles5,6 and arcuate fasciculus;7,8 however DTI-based metrics, such as fractional anisotropy (FA) or streamline count / tract volumes based on DTI fibre-tracking, are inappropriate for rigorous analysis and interpretation, due to the inability to account for crossing fibre geometry in modeling / tractography / statistical inference.9 In this context, the term “fixel” was previously introduced to denote a specific fibre population within a single voxel, and fixel-based analysis (FBA) proposed as a statistical framework for fibre-specific analysis.10 Here, we provide a more robust characterization of human brain white matter asymmetries based on fibre-specific diffusion metrics and a whole-brain data-driven approach using the FBA framework, using state-of-the-art diffusion MRI data.Methods
Dataset: The study used minimally pre-processed diffusion MRI dataset (b-values=0, 1000, 2000, 3000 s/mm2; 90 directions per shell, 1.25 mm isotropic) acquired on a 3T Connectom Siemens Skyra11 composed of 100 subjects (46/54 males/females; age: 22-35 years), obtained from the S1200 release of the Human Connectome Project (https://www.humanconnectome.org).
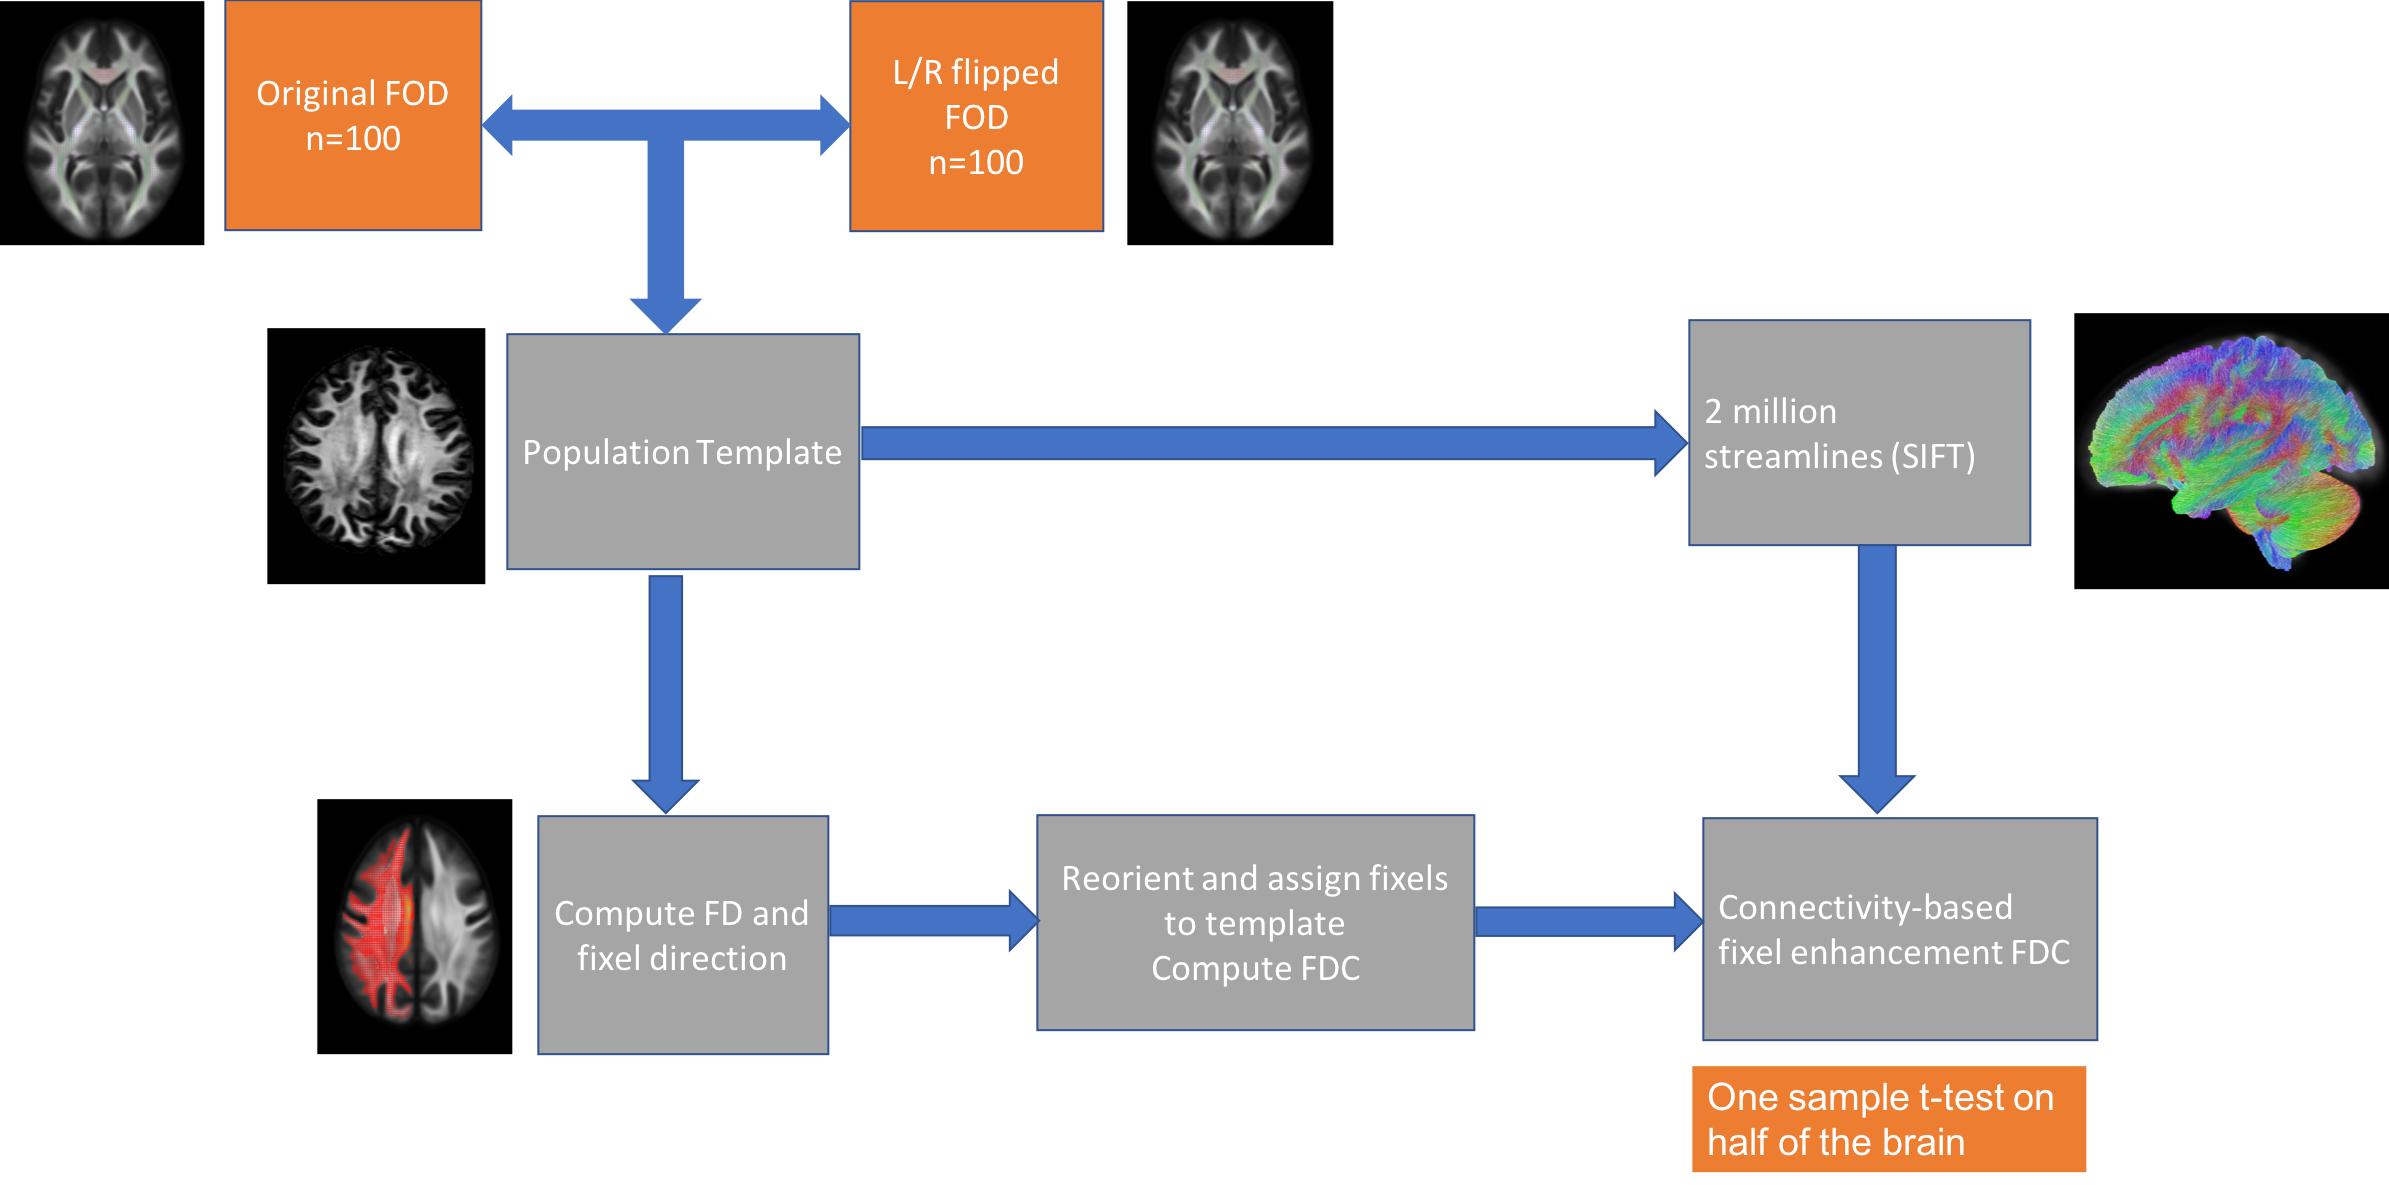
Asymmetry analysis (FBA steps are illustrated in Figure 1): Fibre Orientation Distributions (FODs) were calculated using multi-shell multi-tissue constrained spherical deconvolution (MSMT-CSD)12, with a maximum spherical harmonic degree of 8. For each subject, a duplicate FOD image was reflected along the left-right axis to create a ‘flipped’ dataset; both the original and ‘flipped’ datasets for each subject were subjected to standard FBA processing pipeline steps13 (denoted in grey colored boxes in Figure 1), as provided in MRtrix3 (http://www.mrtrix.org). For simplicity, only the “Fibre Density and Cross-section (FDC)” metric, which incorporates both microstructural and morphological differences13, is reported here. All 200 images were used in the construction of an unbiased symmetrical FOD template image. The Connectivity-based Fixel Enhancement (CFE) method was used for statistical inference10; only one hemisphere of the template image was processed, with the streamlines for connectivity-based smoothing and statistical enhancement cropped accordingly. Two asymmetry hypotheses were tested using the General Linear Model (GLM): FDCR (right) > FDCL (left) and FDCL > FDCR (one-sample t-tests), with age, gender and handedness included as covariates. Family-wise error (FWE) corrected p-values were assigned to each fixel with 10,000 permutations with statistical significance determined at p<0.05. The analysis also included non-stationary correction to account for differences in statistical power across the template14. To further explore those white matter bundles where asymmetry was detected, the whole brain tractogram was edited to isolate those streamlines traversing significant fixels corresponding to known anatomical pathways.
Results
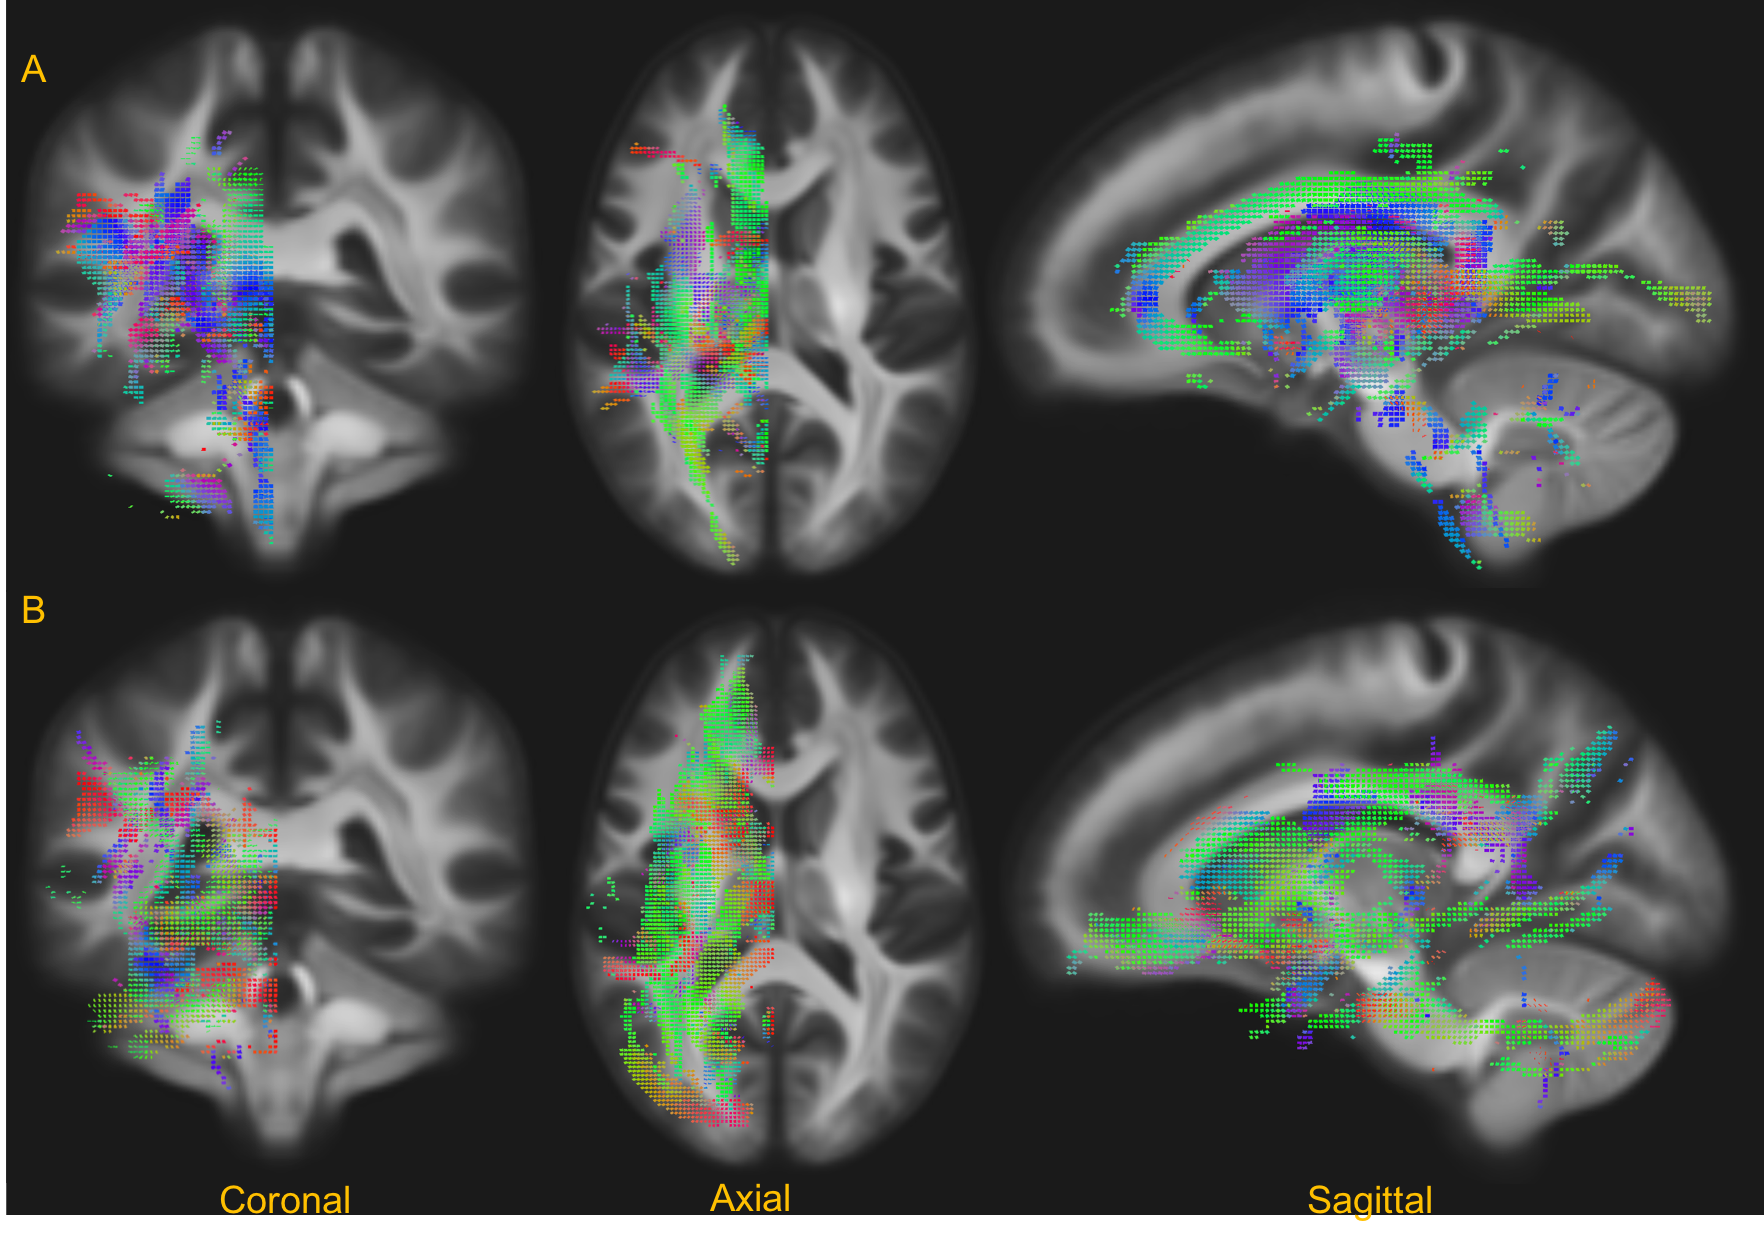
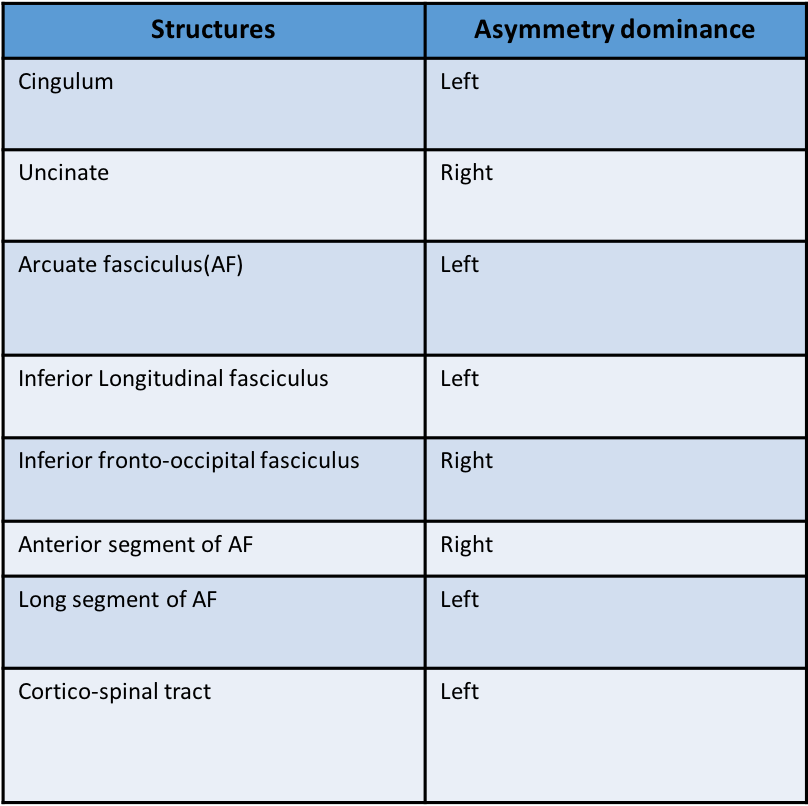
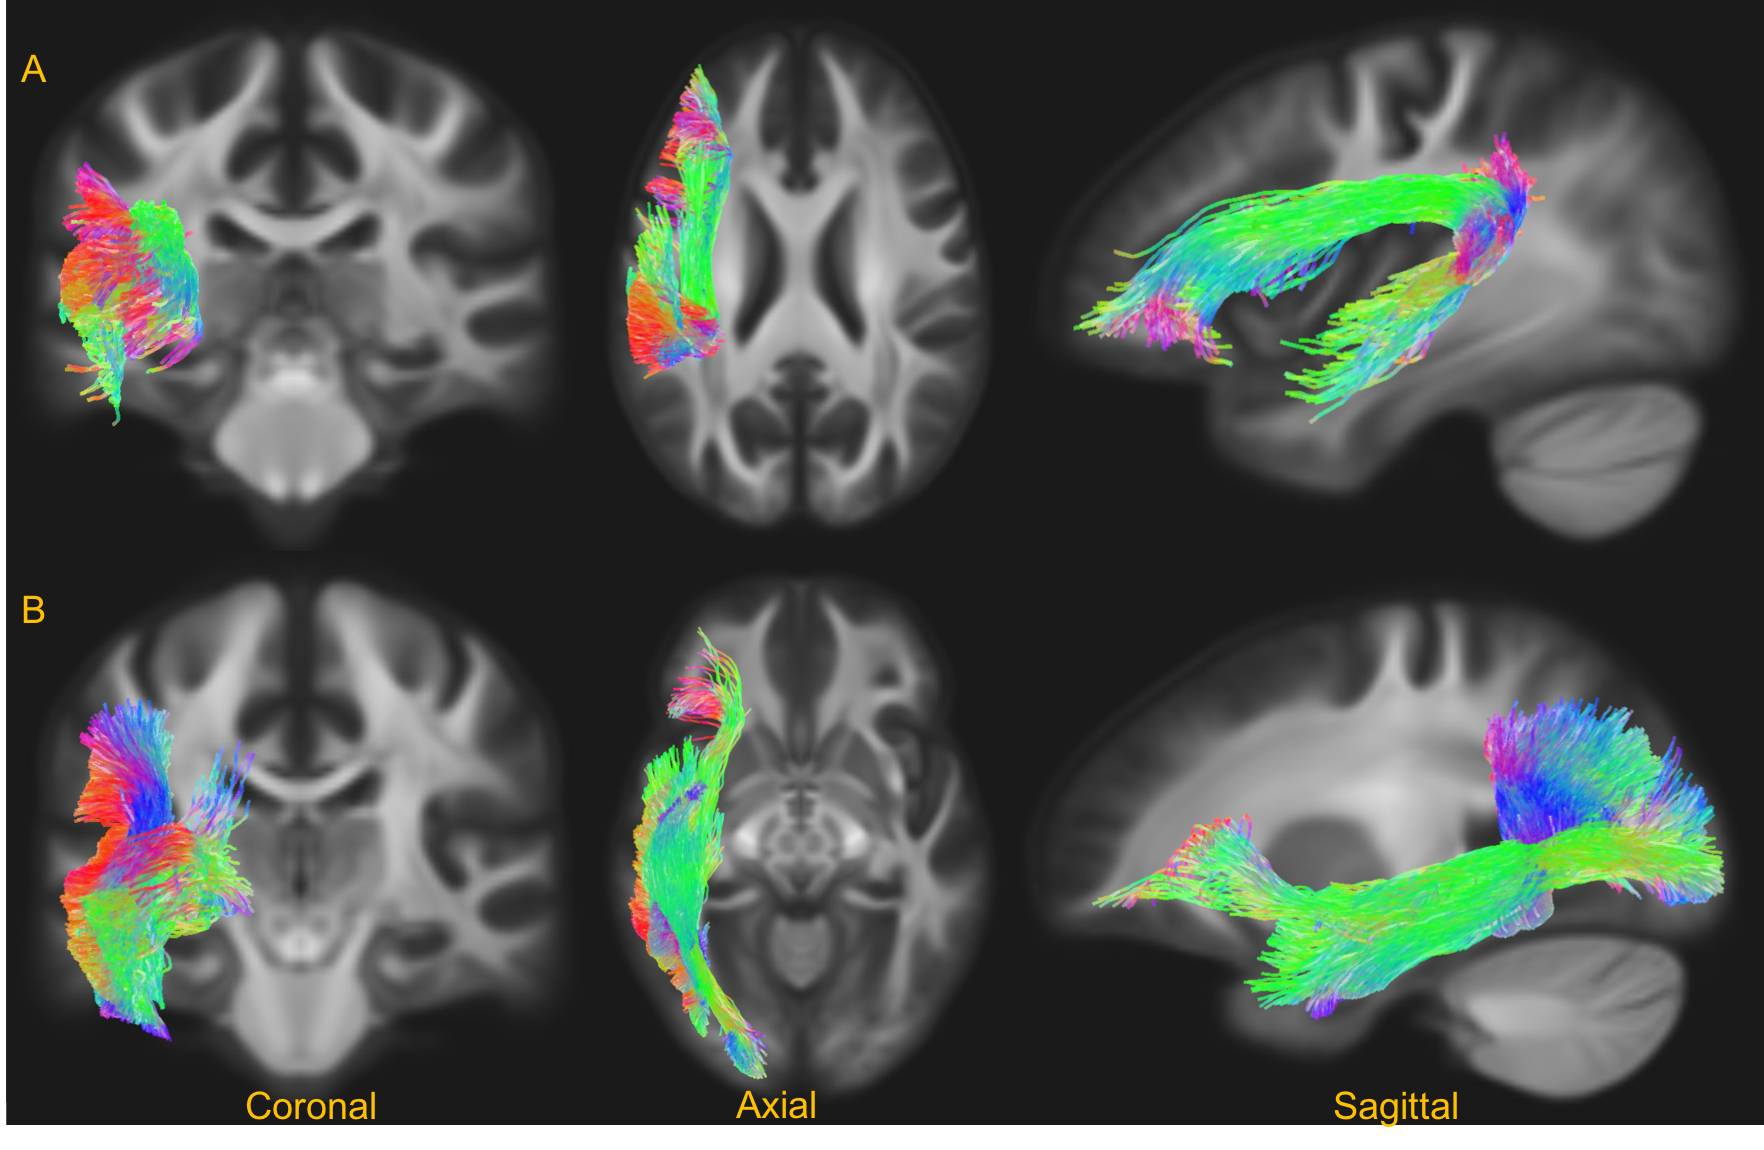
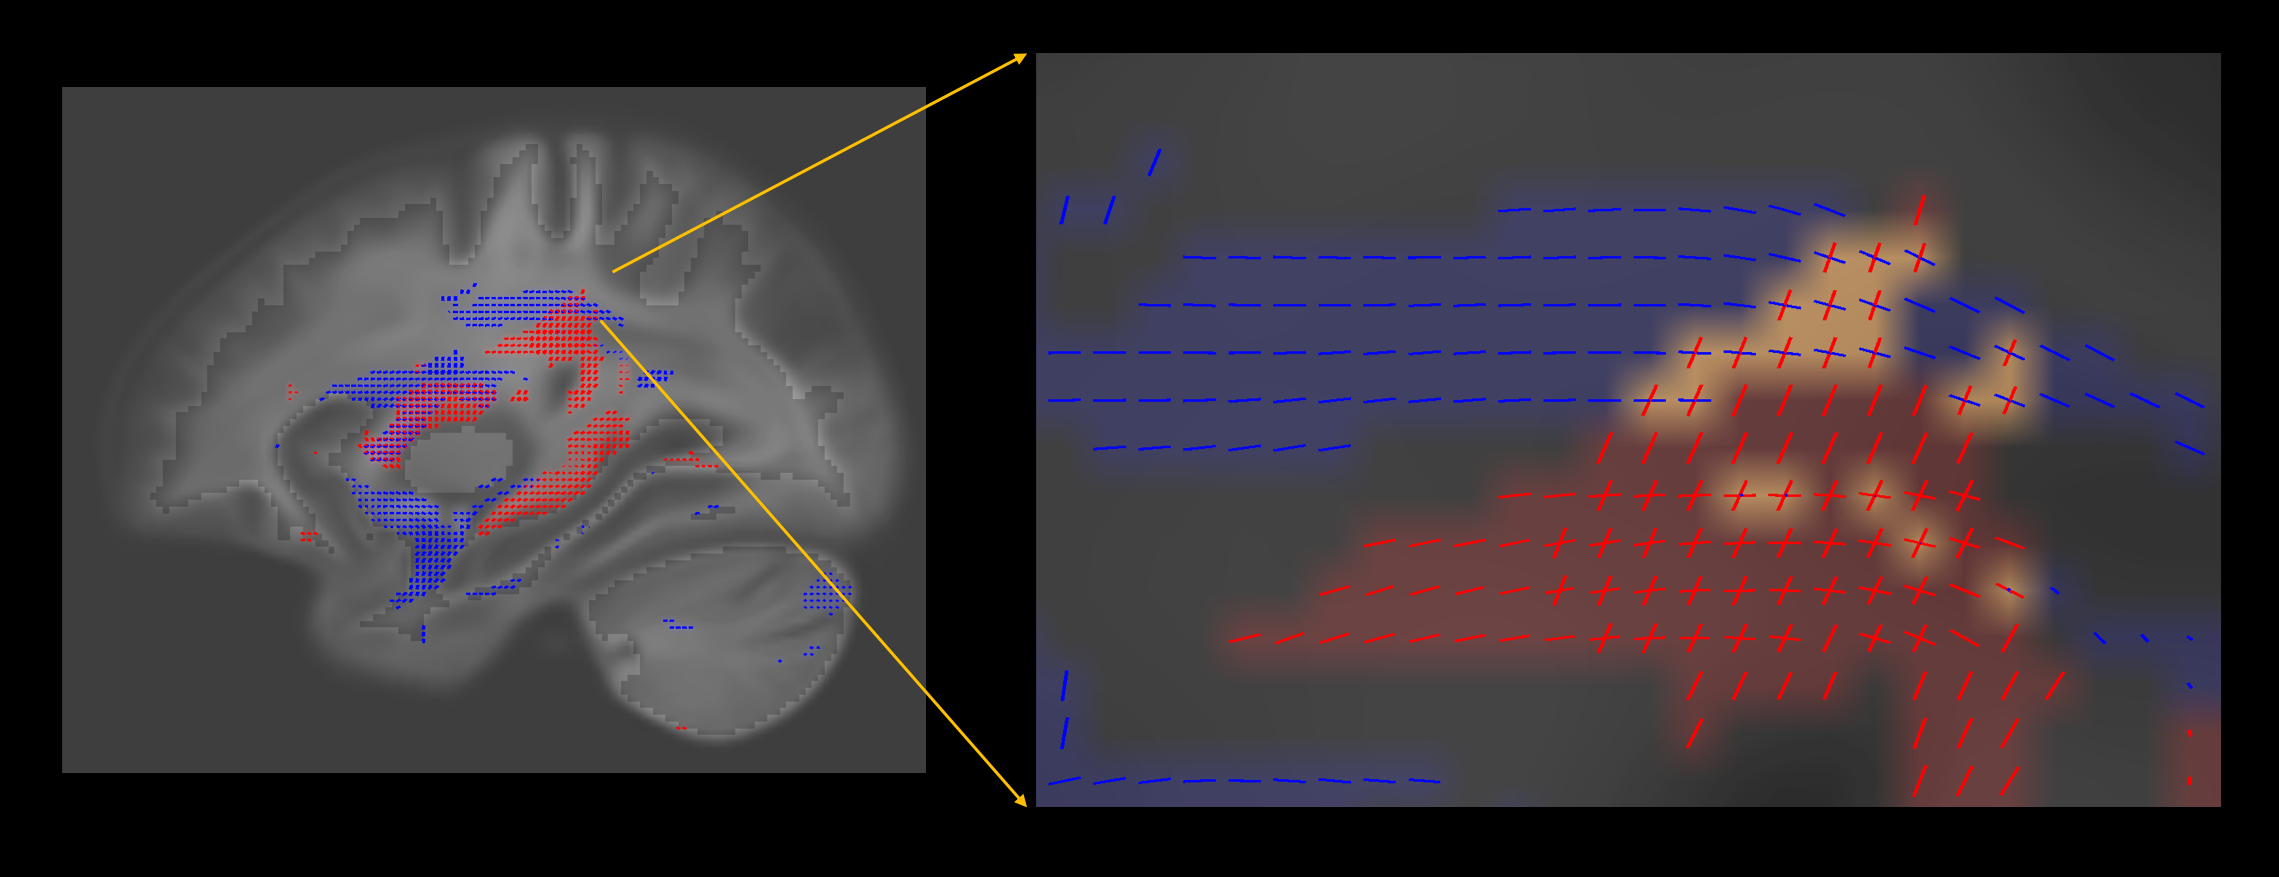
Figure 2A & 2B shows example slices of the template having statistically significant FDCR > FDCL and FDCL > FDCR asymmetry respectively. All significant fixel results from the entire volume are overlaid on the template. Figure 3 shows a table of some of the major fascicles identified in this study. In particular, the arcuate fasciculus and inferior longitudinal fasciculus showed asymmetry dominance in left hemisphere (i.e. FDCL>FDCR, p<0.05), consistent with results reported in DTI-based asymmetry studies.15,16 Post-hoc analyses for influence of gender, age and handedness on asymmetry did not reveal any significance. Figure 4 provides further visualization of a subset of these results by presenting those streamlines that traverse significant fixels corresponding to two known anatomical pathways. Figure 5 illustrates the power of FBA as a tool to investigate fibre-specific measures: voxels may contain fixels with opposite asymmetry (i.e. FDCL>FDCR in one fixel and FDCR>FDCL in another fixel within the same voxel are shown), demonstrating the specificity of the FBA framework.Discussion
In this study we report whole-brain data-driven analysis of white matter asymmetries in the human brain using fibre-specific measurements based on diffusion MRI, accounting for both microscopic and macroscopic changes in the white matter. The reported asymmetries using FBA are generally in agreement with previous findings from post-mortem dissections1,17, DTI-tractography15,16, and voxel-based T1 studies.18 Future studies will involve investigating how these asymmetries are modified with brain development/aging and disease.Acknowledgements
This work was supported by funding from the National Health and Medical Research Council of Australia, the Australian Research Council, the Victorian Government’s Operational Infrastructure Support Program, and the Melbourne Bioinformatics at the University of Melbourne, grant number UOM0048.
Data were provided by the Human Connectome Project, WU-Minn Consortium (Principal Investigators: David Van Essen and Kamil Ugurbil; 1U54MH091657) funded by the 16 NIH Institutes and Centers that support the NIH Blueprint for Neuroscience Research; and by the McDonnell Center for Systems Neuroscience at Washington University.
AHA is supported by a Melbourne International Research Scholarship from the University of Melbourne.
References
1. Toga, A. W., Narr, K. L., Thompson, P. M. & Luders, E. Brain Asymmetry: Evolution. in Encyclopedia of Neuroscience (ed. Squire, L. R.) 303–311 (Academic Press, 2009). doi:10.1016/B978-008045046-9.00936-0 2. Zaidel, E. Brain Asymmetry. in International Encyclopedia of the Social & Behavioral Sciences (eds. Smelser, N. J. & Baltes, P. B.) 1321–1329 (Pergamon, 2001). doi:10.1016/B0-08-043076-7/03548-8 3. Barr, W. B. State of the Art - Brain Asymmetry. R.J. Davidson, K. Hugdahl (Eds.). 1995. Cambridge, MA: The MIT Press. 735 pp., $75.00. J. Int. Neuropsychol. Soc. 2, 471–472 (1996). 4. Luders, E. et al. Hemispheric asymmetries in cortical thickness. Cereb. Cortex N. Y. N 1991 16, 1232–1238 (2006). 5. Gong, G. et al. Asymmetry analysis of cingulum based on scale-invariant parameterization by diffusion tensor imaging. Hum. Brain Mapp. 24, 92–98 (2005). 6. Park, H.-J. et al. White matter hemisphere asymmetries in healthy subjects and in schizophrenia: a diffusion tensor MRI study. NeuroImage 23, 213–223 (2004). 7. Vernooij, M. W. et al. Fiber density asymmetry of the arcuate fasciculus in relation to functional hemispheric language lateralization in both right- and left-handed healthy subjects: a combined fMRI and DTI study. NeuroImage 35, 1064–1076 (2007). 8. Büchel, C. et al. White Matter Asymmetry in the Human Brain: A Diffusion Tensor MRI Study. Cereb. Cortex 14, 945–951 (2004). 9. Tournier, J.-D., Mori, S. & Leemans, A. Diffusion tensor imaging and beyond. Magn. Reson. Med. 65, 1532–1556 (2011). 10. Raffelt, D. A. et al. Connectivity-based fixel enhancement: Whole-brain statistical analysis of diffusion MRI measures in the presence of crossing fibres. NeuroImage 117, 40–55 (2015). 11. Glasser, M. F. et al. The minimal preprocessing pipelines for the Human Connectome Project. NeuroImage 80, 105–124 (2013). 12. Jeurissen, B., Tournier, J.-D., Dhollander, T., Connelly, A. & Sijbers, J. Multi-tissue constrained spherical deconvolution for improved analysis of multi-shell diffusion MRI data. NeuroImage 103, 411–426 (2014). 13. Raffelt, D. A. et al. Investigating white matter fibre density and morphology using fixel-based analysis. NeuroImage 144, 58–73 (2017). 14. Salimi-Khorshidi, G., Smith, S. M. & Nichols, T. E. Adjusting the effect of nonstationarity in cluster-based and TFCE inference. NeuroImage 54, 2006–2019 (2011). 15. Ortibus, E. et al. Integrity of the inferior longitudinal fasciculus and impaired object recognition in children: a diffusion tensor imaging study. Dev. Med. Child Neurol. 54, 38–43 (2012). 16. Thiebaut de Schotten, M. et al. Atlasing location, asymmetry and inter-subject variability of white matter tracts in the human brain with MR diffusion tractography. NeuroImage 54, 49–59 (2011). 17. Rademacher, J. et al. Variability and asymmetry in the human precentral motor system. A cytoarchitectonic and myeloarchitectonic brain mapping study. Brain J. Neurol. 124, 2232–2258 (2001). 18. Hervé, P.-Y. et al. Handedness, motor skills and maturation of the corticospinal tract in the adolescent brain. Hum. Brain Mapp. 30, 3151–3162 (2009).Figures