3617
Needle in a Haystack: Finding connections of interest in the precentral gyrus from diffusion MRI based connectomics1Département de médecine nucléaire et radiobiologie, Université de Sherbrooke, Sherbrooke, QC, Canada, 2Université de Sherbrooke, Sherbrooke, QC, Canada
Synopsis
DMRI tractography and connectomics aim to create comprehensive maps of all neural circuitry in the brain, however, dMRI is a false-positive prone imaging modality. Yet, as it is the only non-invasive and in-vivo method to indirectly study the white matter connectivity of the brain it is heavily utilized. DMRI-Connectomic analyses often end with a “big data” problem, as there are many possible connections. Moreover, this data is likely populated by false-positive connections. By utilizing data-driven criteria to filter matrices this work attempts to narrow the “search window” by adding criteria on which we can discard “connections” or consider them potential candidates for further investigation. Such judgements may also lead to connections being evaluated as true or false-positives.
INTRODUCTION
Population-level and large-scale connectomics is a hot topic commonly in neuroimaging scientific literature. The premise of such studies are to obtain large populations of interest to gain universal “insight” on a particular scientific problem [1]. However, when examining large data bases finding the “insight” can be difficult.
This is particularly problematic in large scale diffusion magnetic resonance imaging studies (dMRI) and dMRI based connectomics. DMRI tractography and connectomics aim to create comprehensive maps of all neural circuitry in the brain, often without an anatomical a priori [2]. However, dMRI tractography is a false-positive prone modality [3]. Based on simulated data of the ISMRM 2015 challenge, for every true connection rendered from dMRI data into a tractogram there is greater than a four times likelihood that a false connection is also being presented [3]. Accurate connectomes can lead into insights about neuroanatomy and neuropathology, however, inaccurate connectomes can lead to false conclusions and wrong insights.
In this work, a data-driven methodology that aims to organize connections of interest based on volume, shape and population level occurrence is presented. The premise is dependent on the assumption that connections that are volumetrically high, with a similar shape and frequently occurring in the population are less likely to be false-positives than connections that are volumetrically low, with a variable shape and not occurring frequently across the population. This methodology does not attempt to identify true positives or identify false-positives. The goal is simply to reduce the “search space” of 10,000+ connections by adding criteria on which we can discard “connections” or consider them potential candidates for further investigation.
METHODS
Data Acquisition and Pre-Processing
HCP dMRI-data of 40 males (270 directions, b=1000s/mm2, 2000s/mm2 and 3000s/mm2) was acquired via EPI spin echo sequence (TR/TE=5520/89.5ms) [4]. The dMRI (1.25mm isotropic-resolution) was processed with anatomically constrained particle-filter probabilistic algorithm to reconstruct tractograms and non-linearly transformed to MNI-152 template [5, 6].
Anatomical Dissection
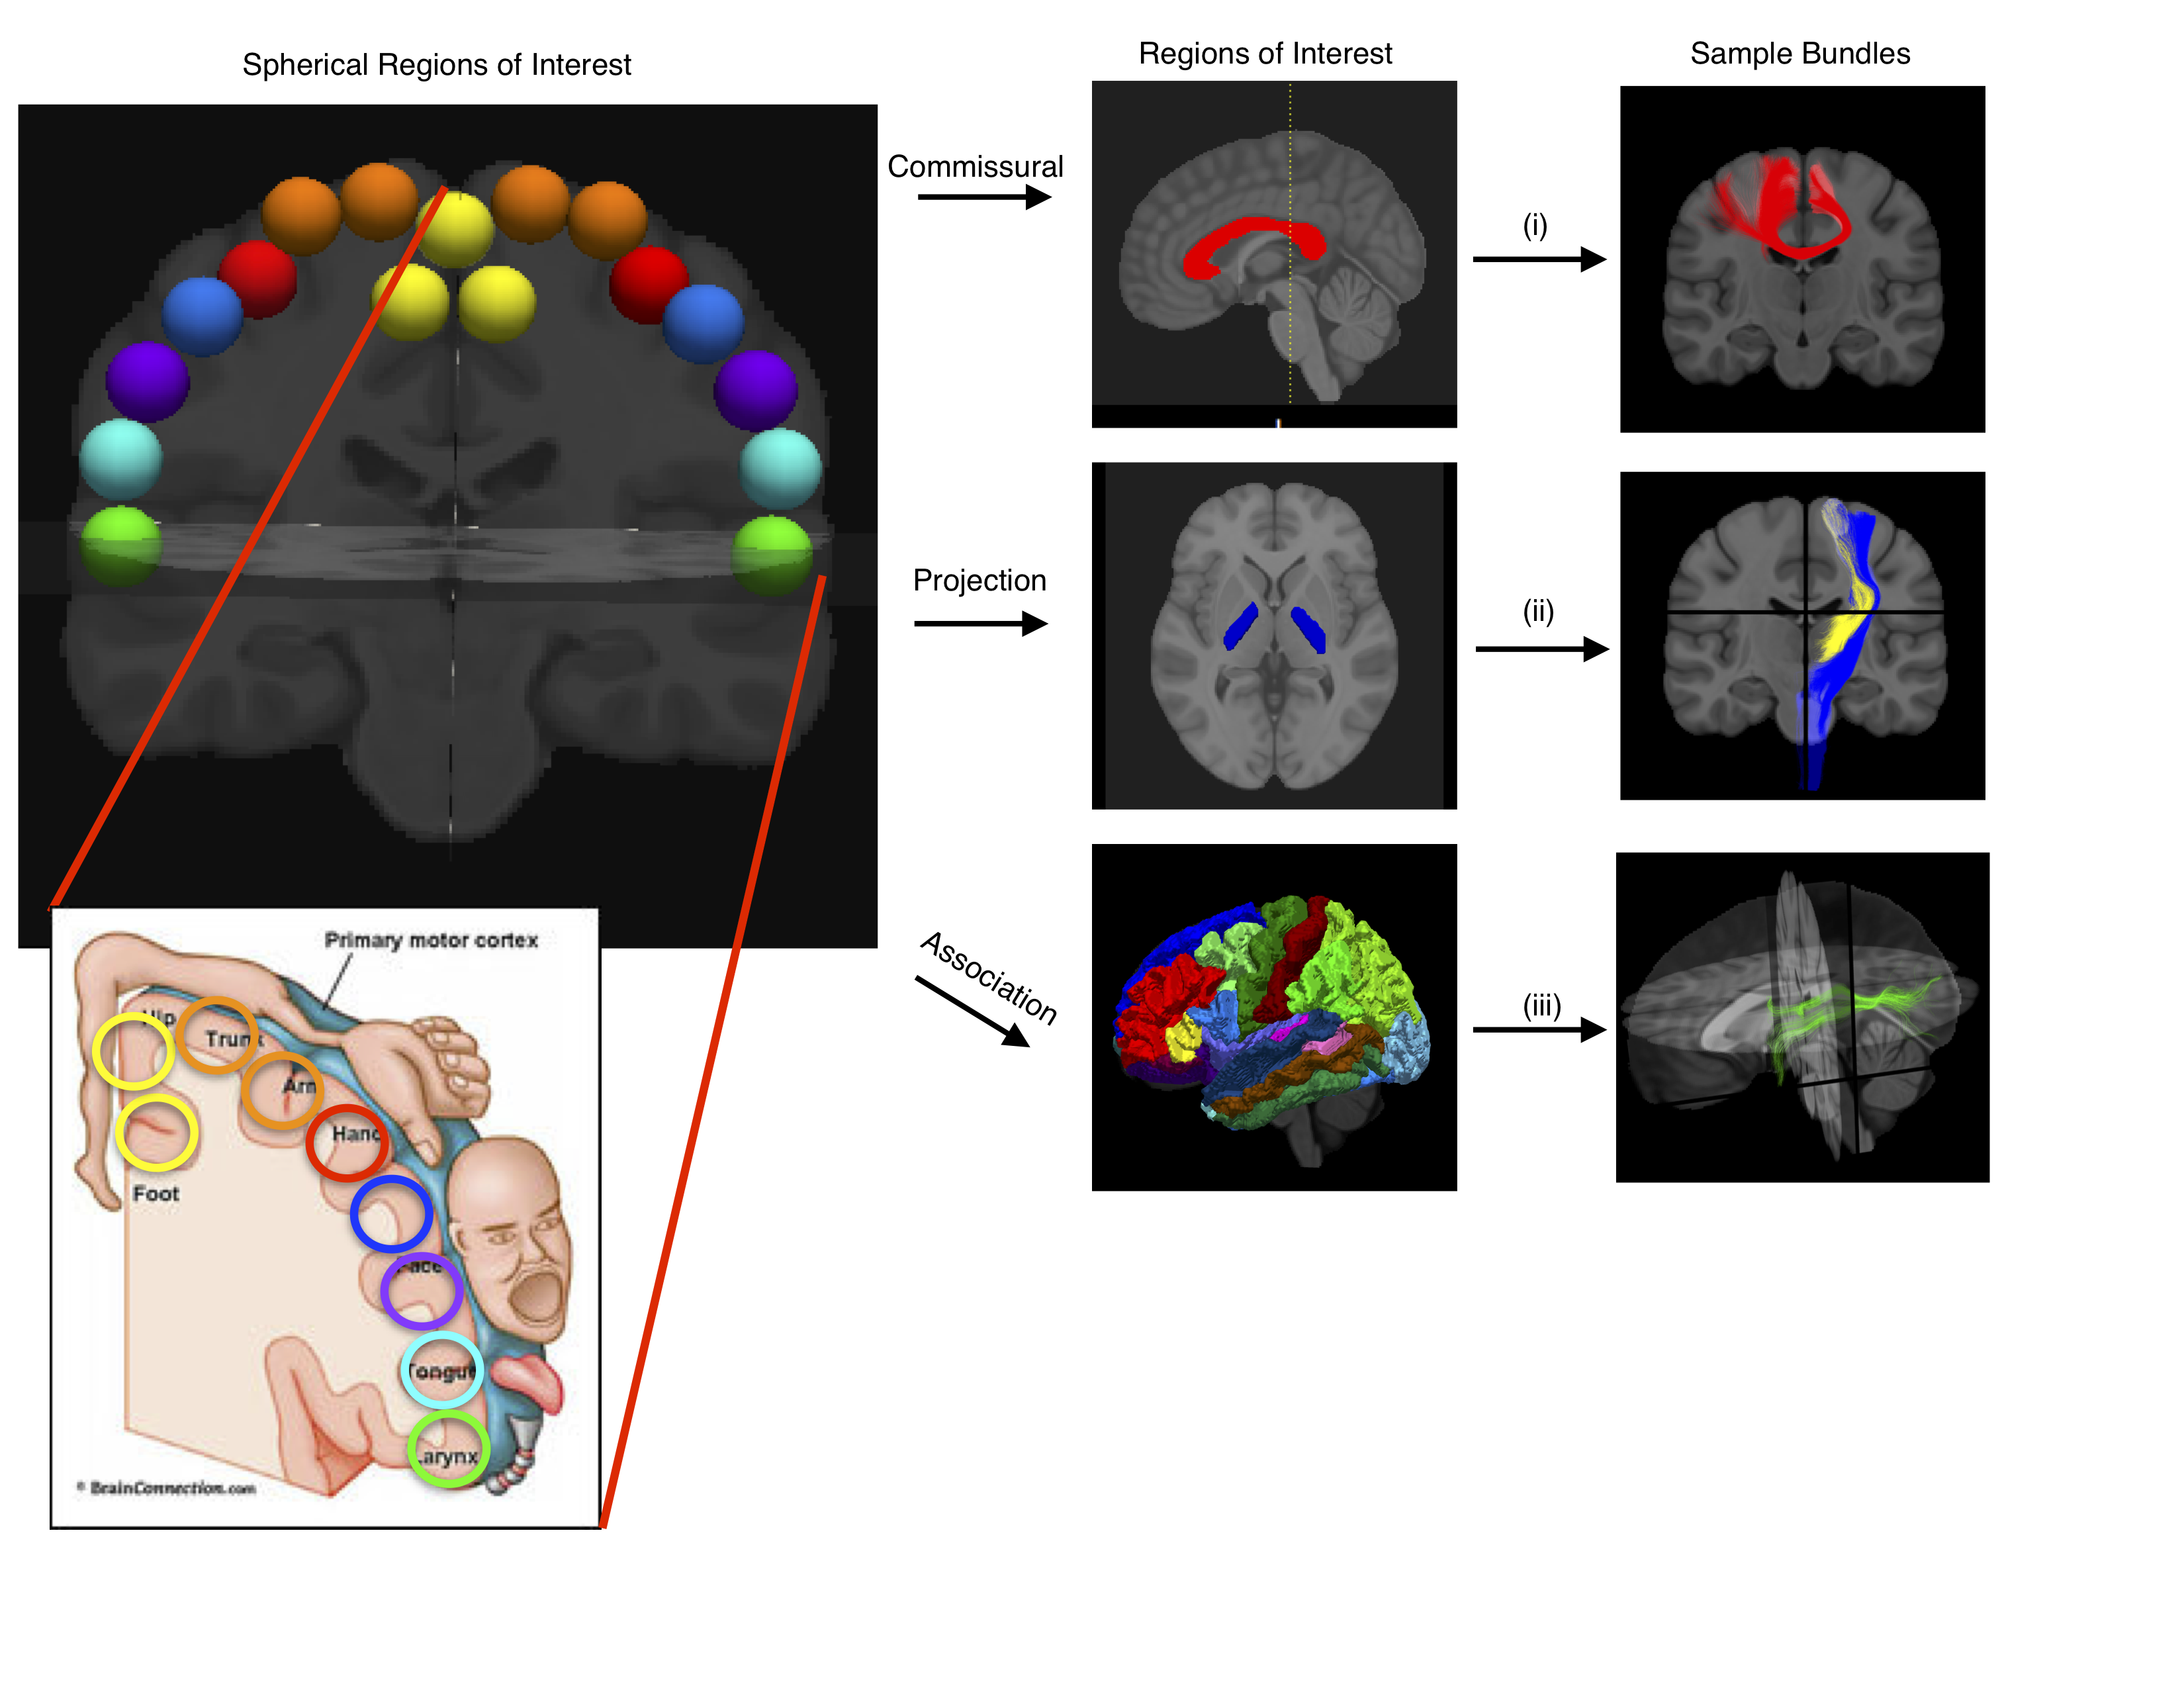
Seventeen spherical regions of interest (ROI) were placed across the precentral gyrus (primary motor region). The placement mimicked the functional parcellation of the motor homunculus (Figure 1). Spherical ROIs with hand-drawn and FreeSurfer ROIs were used to generate a mini-connectme of the motor strip with 10,000+ connections, which were then classed which were then classed into commissural, long projection, short projection, and association connections (Figure 1).
Volume and Shape Analysis
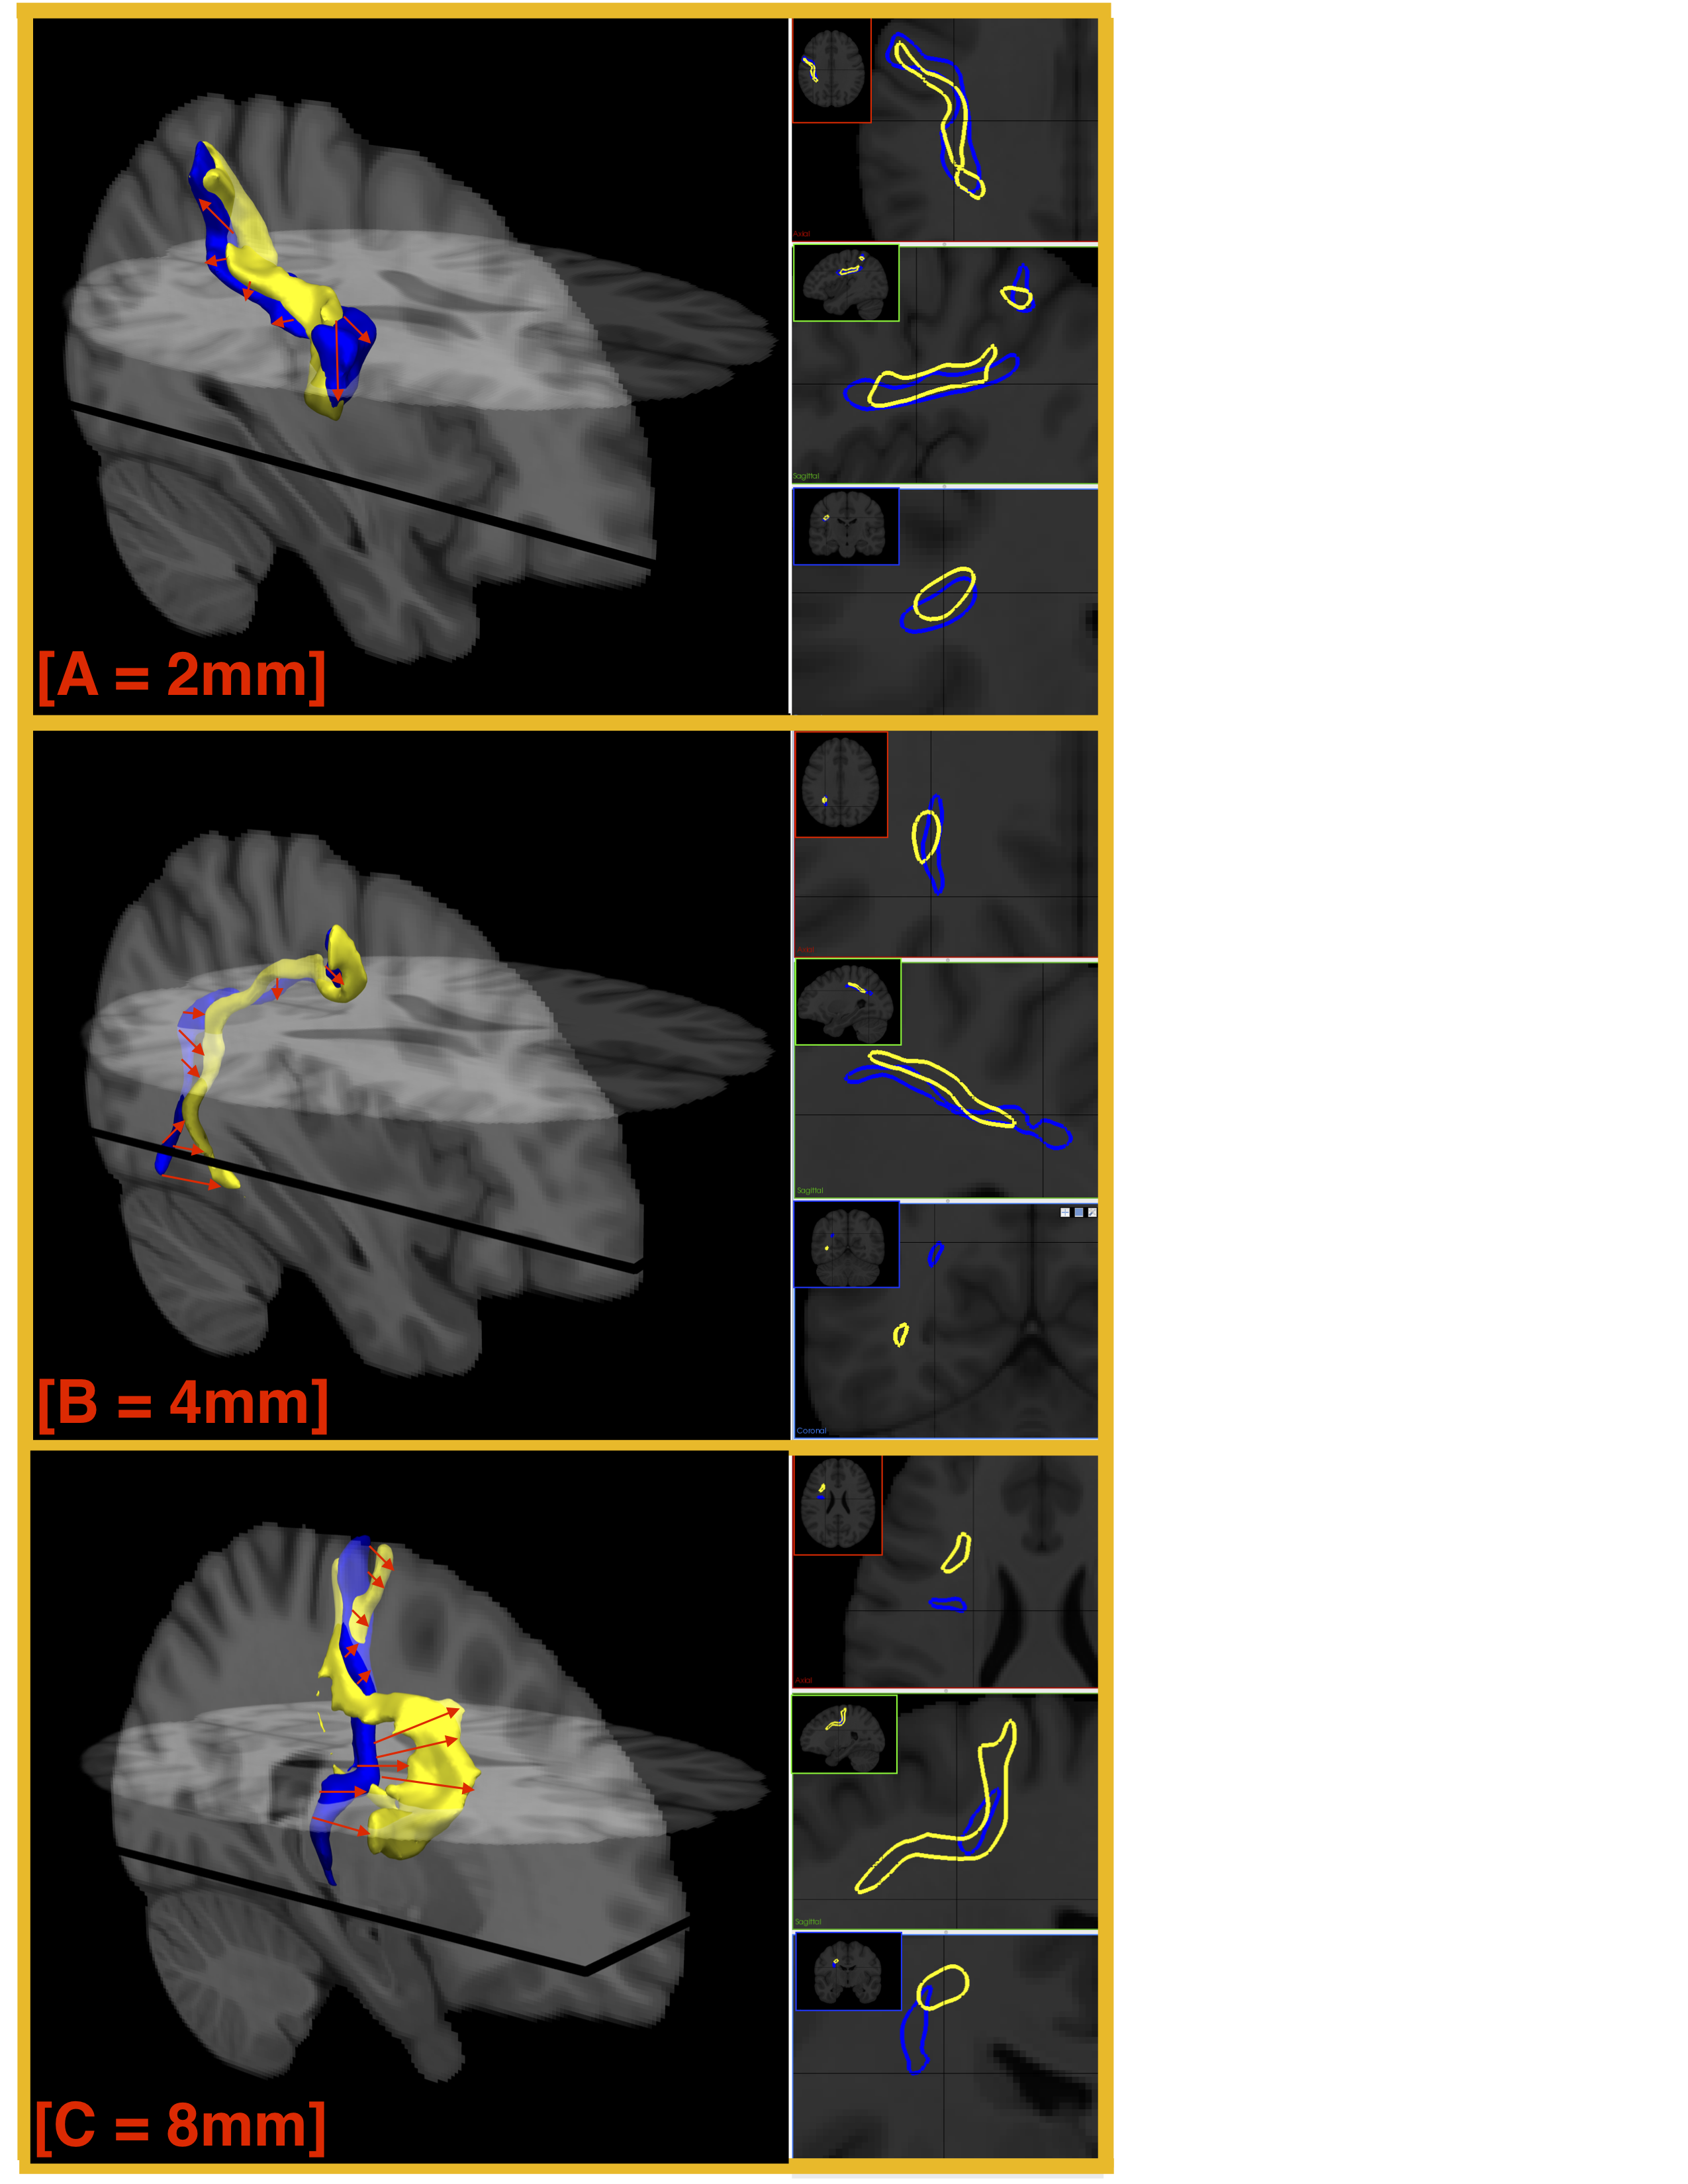
Binary maps were generated from voxels traversed by streamlines. These voxels were then transformed into cm3 and the volume of each connection was calculated. As all 40 subjects and 10,000+ connections were in MNI space, it was possible to quantify the shape similarity of the connection and its occurrence (100% if 40/40 subjects had the connection). Shape similarity is quantified using the mean spatial difference (SPD), which is calculated between the edges of the binary maps of the connections (Figure 2).
RESULTS
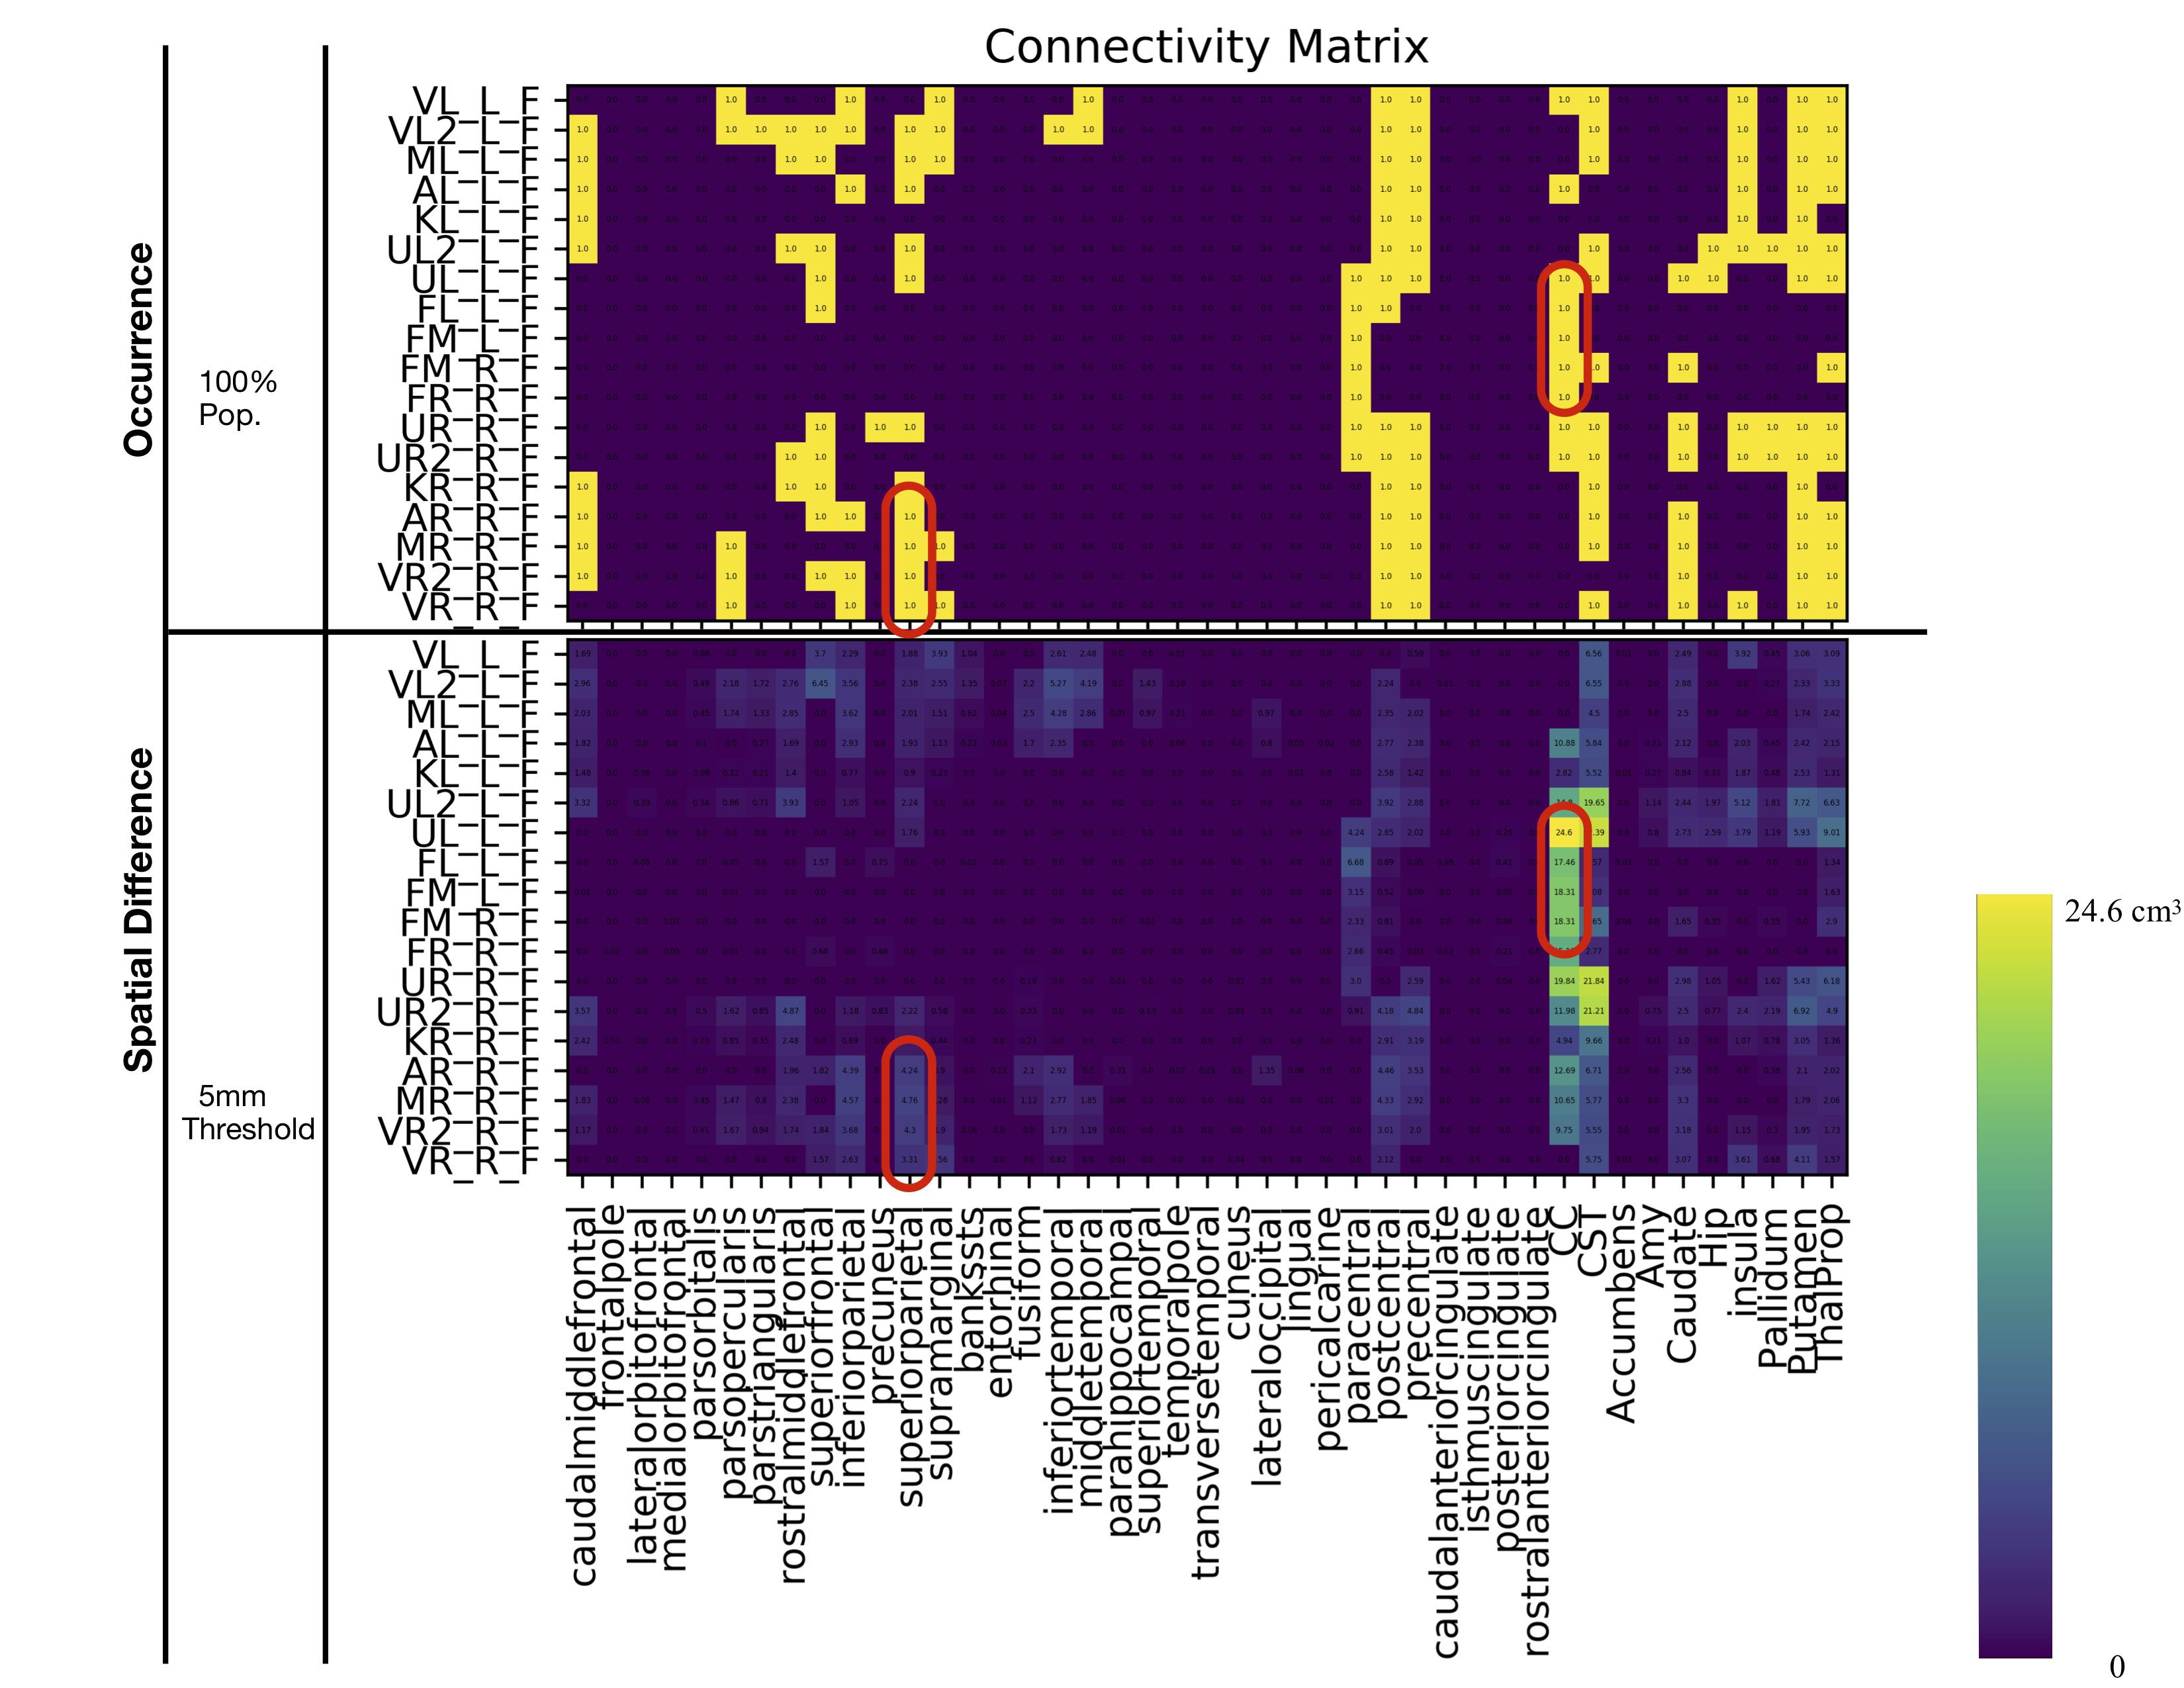
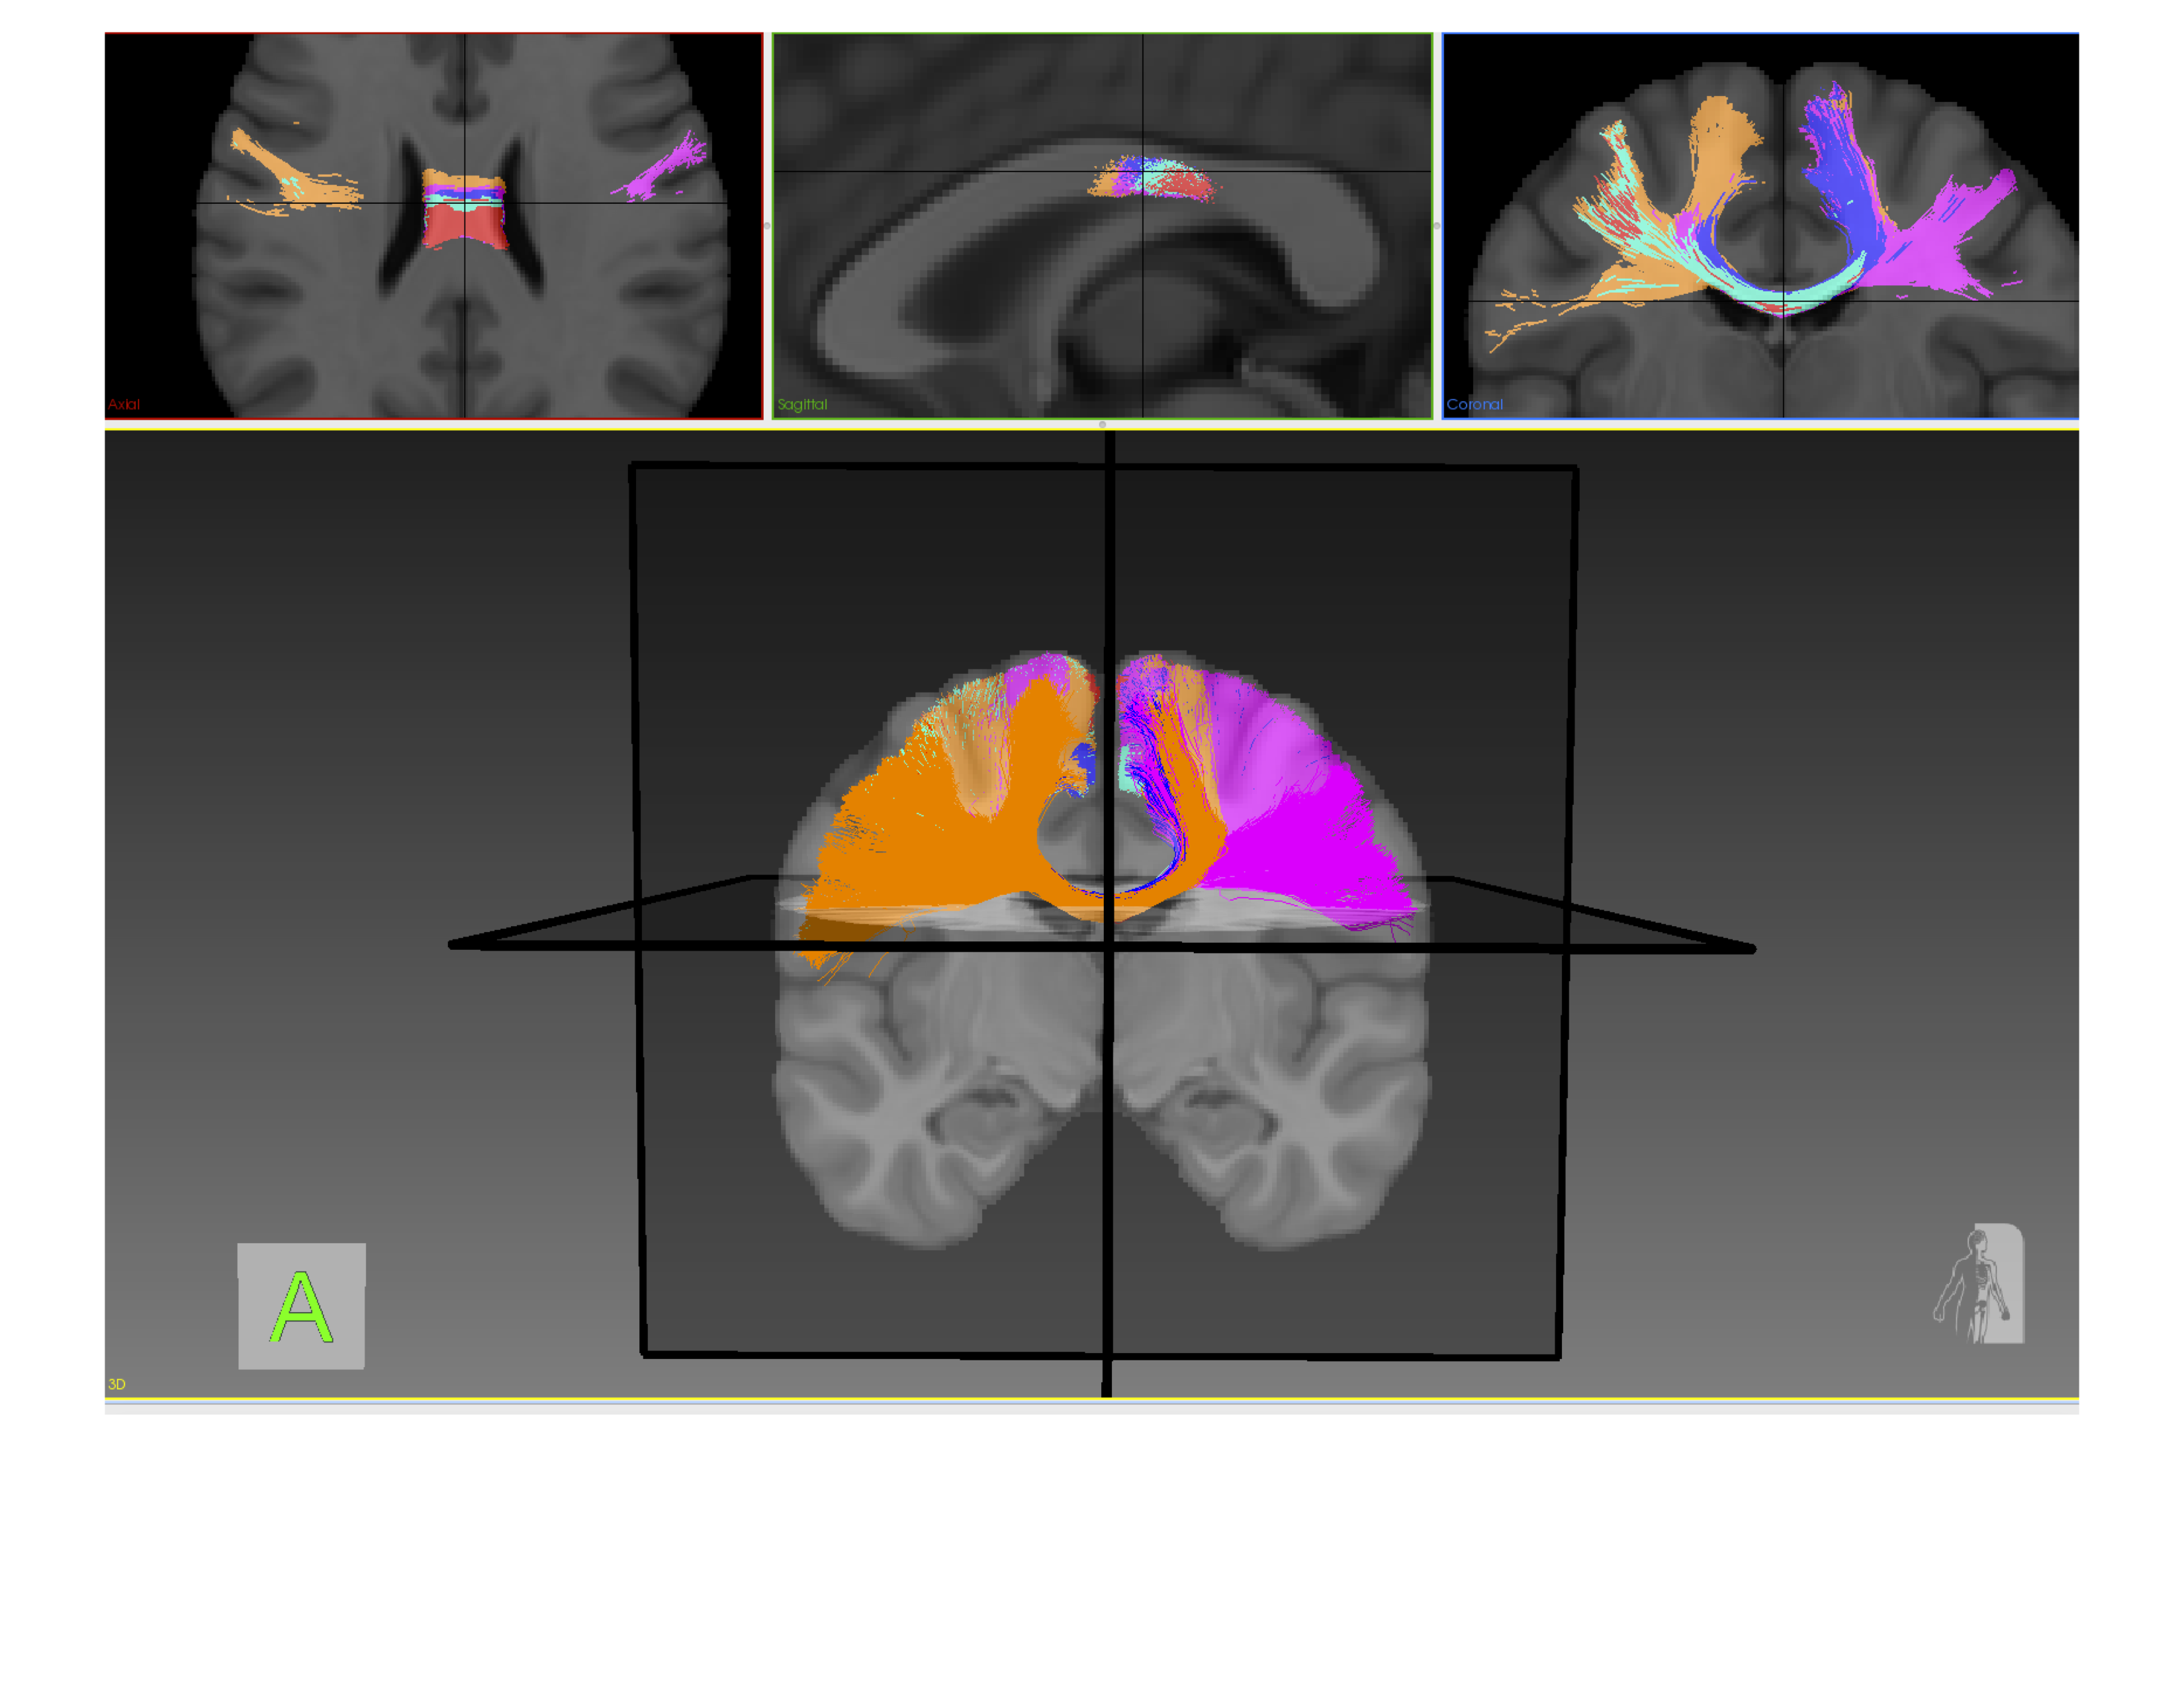
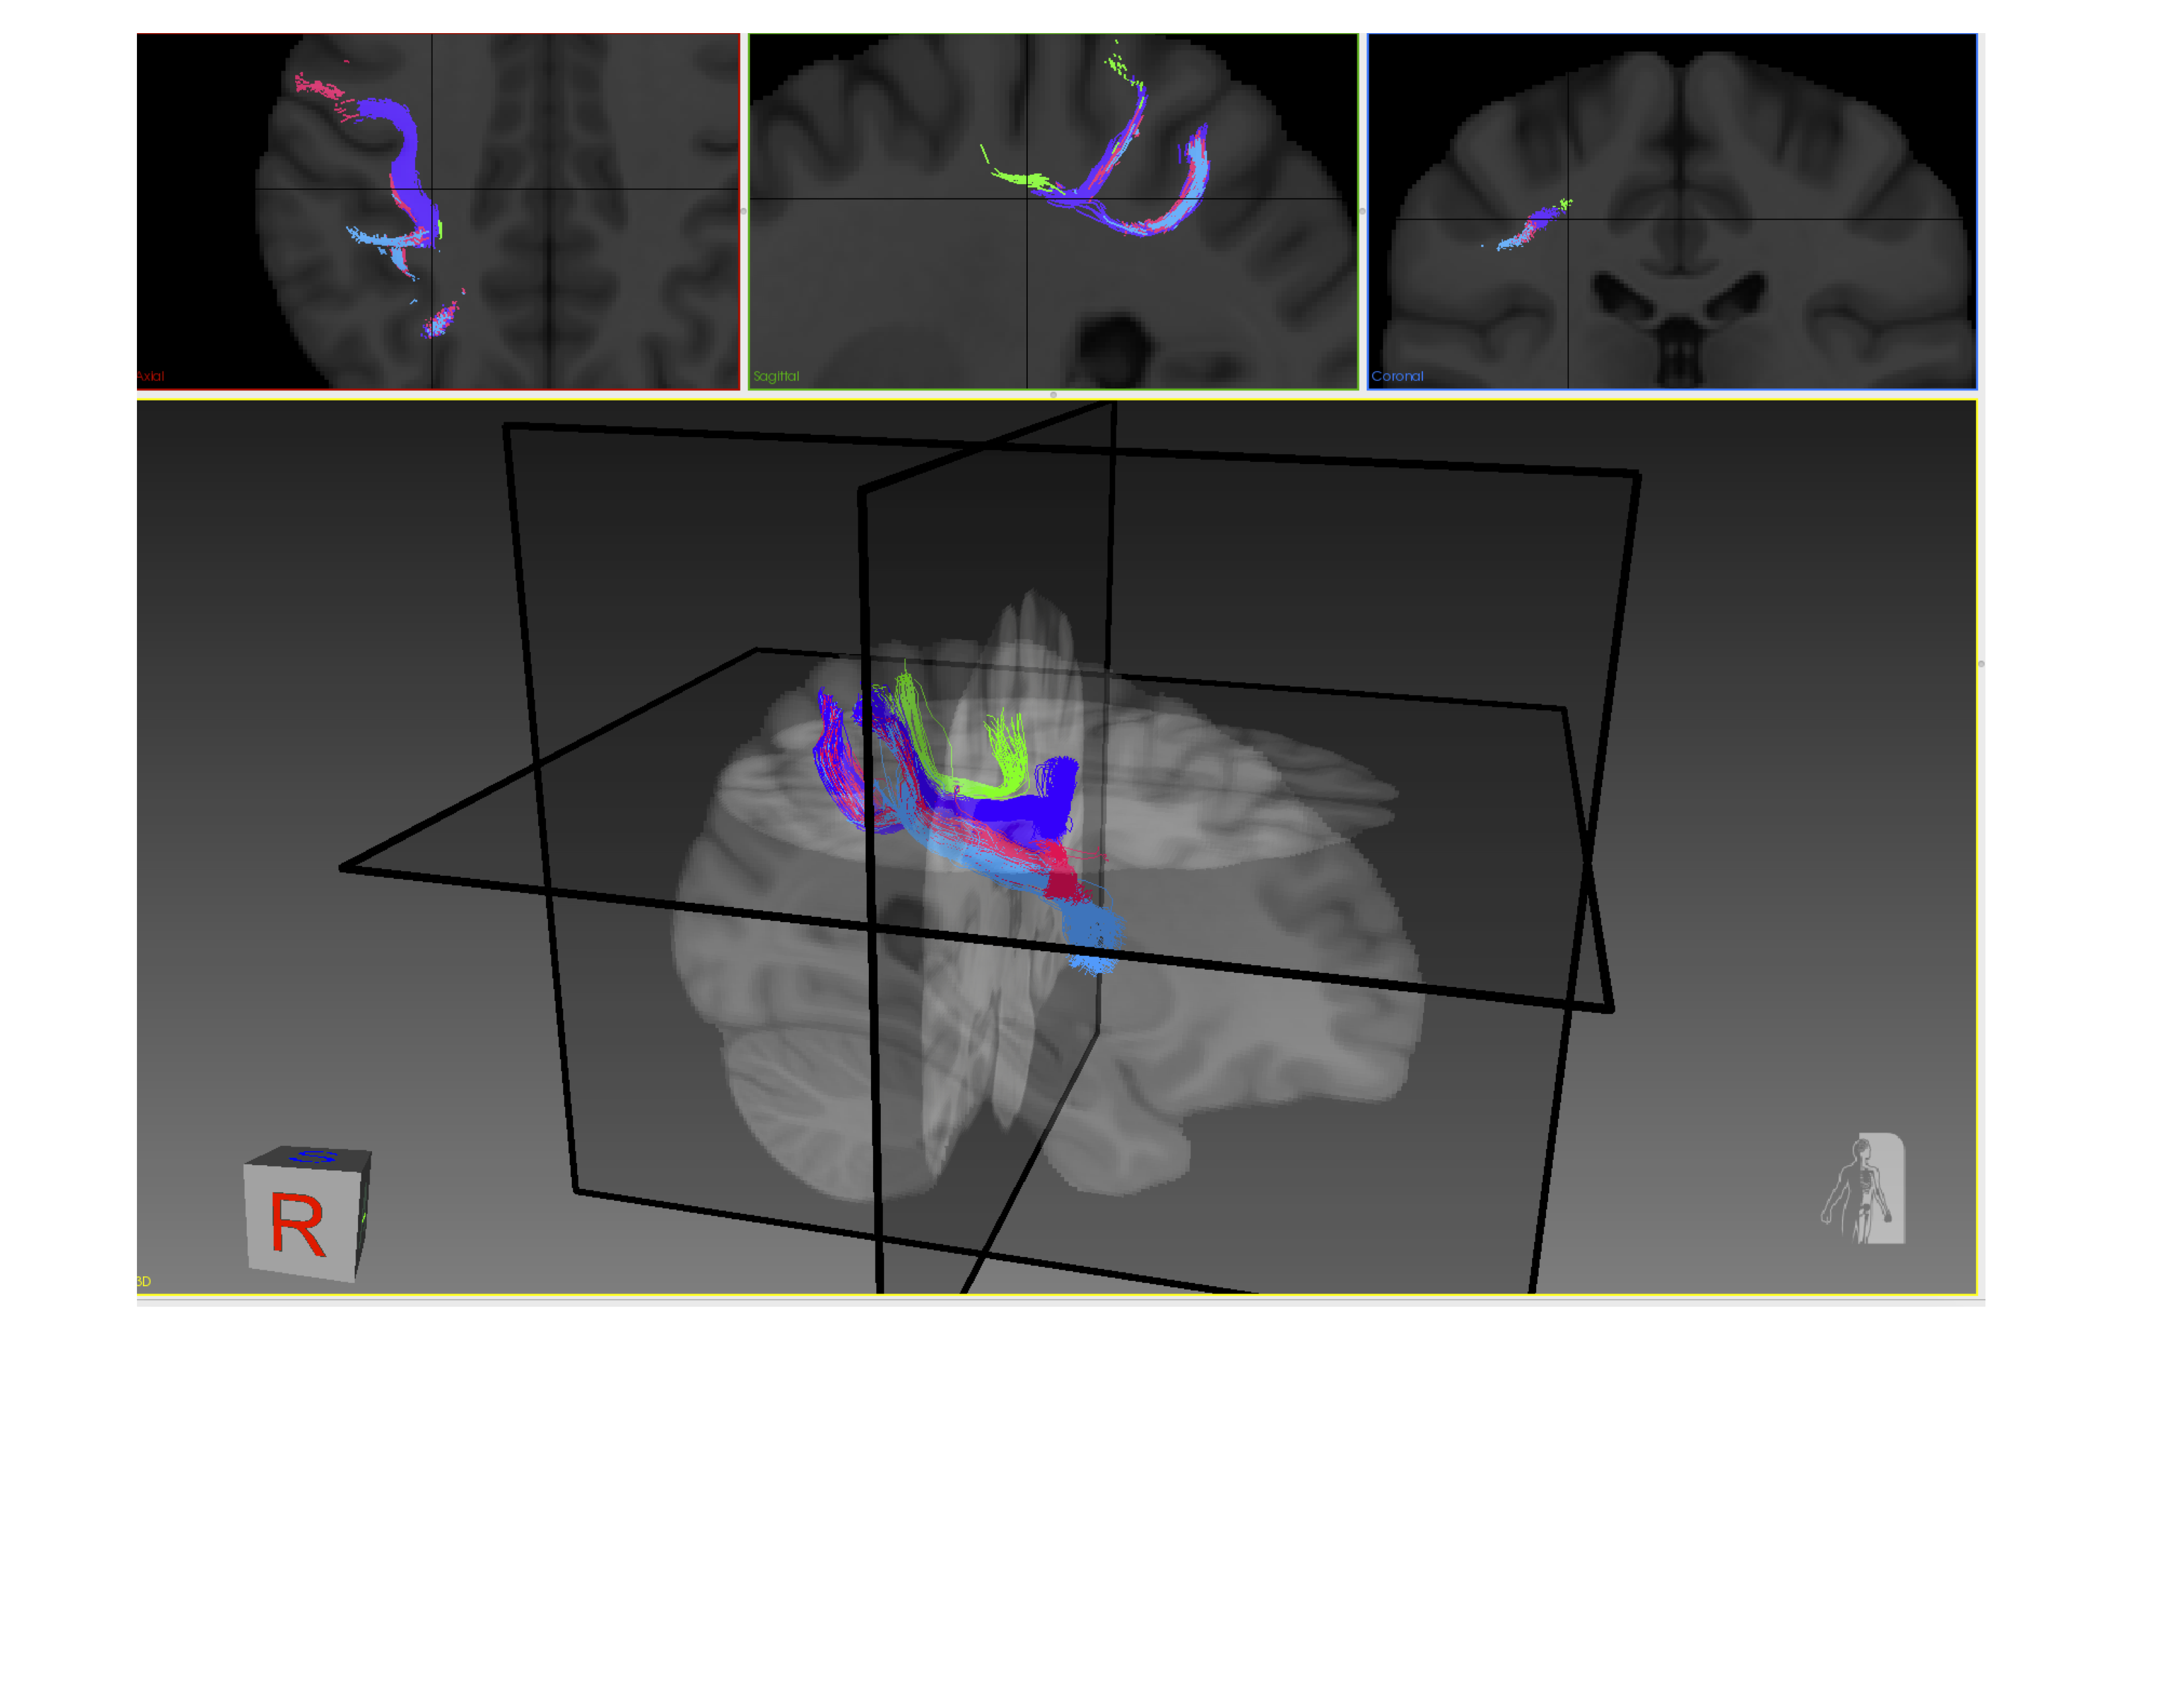
The connectivity matrices were filtered through a set of data-driven (occurrence/volume/shape) criteria to narrow the “search space” (Figure 3). For example, in Figure 3 (top) a matrix representing the occurrence of connections from each spherical ROI to various hand-drawn and FreeSurfer regions present in 100% of the population are represented numerically and in bright yellow. Moreover, on the bottom are the same connections thresholded for a 5mm SPD, reporting average volume numerically and by colour scale. These matrices can be thresholded to different degrees. By examining connections which exist in 100% of the population, with a 5mm SPD and have a comparatively large volume, as highlighted as red circles in Figure 3, the “search space” has been narrowed. This criteria also illustrates a macro-scale trends of motor strip connectivity. The connections highlighted by red circles in Figure 3 are visualized in Figure 4 and 5 and would then be candidates for further investigation.DISCUSSION & CONCLUSION
The key assumption is that high volume, similar path and high occurrence indicates a connection that is less likely to be false-positive. It is possible that a false-positive will exist with such criteria but by filtering the matrices through population occurrence, volume and shape similarity spurious and inconsistent connections would be first detected and avoided. If the aim of connectivity-analysis is to explore potential candidate connections (for future ex-vivo dissections, or multi-modalities validations) using tractography, it is crucial to define a criteria on which to evaluate candidates. At no point does this work claim to identify true positives, or even discard false positives, but by using data-driven criteria and neuroanatomy it is possible to at least to prune/trim potential results, highlight macro-scale patterns and provide focus for future validations work and “insights”.
Acknowledgements
The authors would like to thank the and NSERC Collaborative Research and Training Experience Program in Medical Image Analysis (CREATE-MIA) for funding this research. We also thank the Université de Sherbrooke institutional chair in neuroinformatics for their support and the NSERC Discovery grant from Pr Descoteaux.References
[1] Lichtman, J.W., Pfister, H. and Shavit, N., 2014. The big data challenges of connectomics. Nature neuroscience, 17(11), p.1448.
[2] Sporns, O., Honey, C.J. and Kötter, R., 2007. Identification and classification of hubs in brain networks. PloS one, 2(10), p.e1049.
[3] Maier-Hein, K.H., Neher, P.F., Houde, J.C., Côté, M.A., Garyfallidis, E., Zhong, J., Chamberland, M., Yeh, F.C., Lin, Y.C., Ji, Q. and Reddick, W.E., 2017. The challenge of mapping the human connectome based on diffusion tractography. Nature communications, 8(1), p.1349.
[4] Sotiropoulos, S.N., Jbabdi, S., Xu, J., Andersson, J.L., Moeller, S., Auerbach, E.J., Glasser, M.F., Hernandez, M., Sapiro, G., Jenkinson, M. and Feinberg, D.A., 2013. Advances in diffusion MRI acquisition and processing in the Human Connectome Project. Neuroimage, 80, pp.125-143.
[5] Girard, G., Whittingstall, K., Deriche, R. and Descoteaux, M., 2014. Towards quantitative connectivity analysis: reducing tractography biases. Neuroimage, 98, pp.266-278.
[6] Fonov, V.S., Evans, A.C., McKinstry, R.C., Almli, C.R. and Collins, D.L., 2009. Unbiased nonlinear average age-appropriate brain templates from birth to adulthood. NeuroImage, (47), p.S102.
Figures