3615
Cardiac Fiber Mobility During Contraction Using High Resolution Diffusion Tensor MRI1Radiological Sciences Lab, Department of Radiology, Stanford University, Stanford, CA, United States, 2Department of Radiological Sciences, University of California, Los Angeles, CA, United States, 3Physics and Biology in Medicine IDP, University of California, Los Angeles, CA, United States, 4Department of Bioengineering, University of California, Los angeles, CA, United States
Synopsis
The main cardiomyocyte aggregate orientation, represented by the Helix Angle, remains poorly described in vivo during contractionas it is affected by the imaging resolution and thus by a change of wall thickening. This work evaluated the effect of the imaging resolution using a numerical phantom and ex vivoscans on porcine hearts. High-resolution cDTI was acquired in vivoto measure the transmural mobility of Helix Angle at three cardiac phases. A strong steepening of Helix Angle was observed as the resolution decreased in simulation and ex-vivo. A significant change in the Helix Angle distribution was observed during contraction.
Introduction
The myocardium is comprised of aligned cardiomyocytes aggregates with orientations that vary transmurally from epicardium (Epi) to endocardium (Endo). Probing the microstructural mobility during contraction could differentiate purported mechanisms of wall thickening in diseased hearts1. Cardiac Diffusion Tensor Imaging (cDTI) is an emerging method for assessing the organization of the heart’s microstructure in vivo2,3. cDTI usually suffers from poor resolution and requires advanced techniques to handle cardiac and respiratory motion. The cardiomyocyte aggregate orientation is usually characterized by measuring the helix angle (HA) of the primary eigenvector from cDTI at each voxel. However, the change in HA due to cardiac contraction remains poorly described in vivo as it's affected by the imaging resolution and thus by a change of wall thickening1,4. This work evaluates the effect of the imaging resolution on the HA distribution using a numerical phantom and ex vivo scans on porcine hearts. Subsequently, high-resolution cDTI was acquired in vivo to measure the transmural mobility of HA at three cardiac phases.Methods
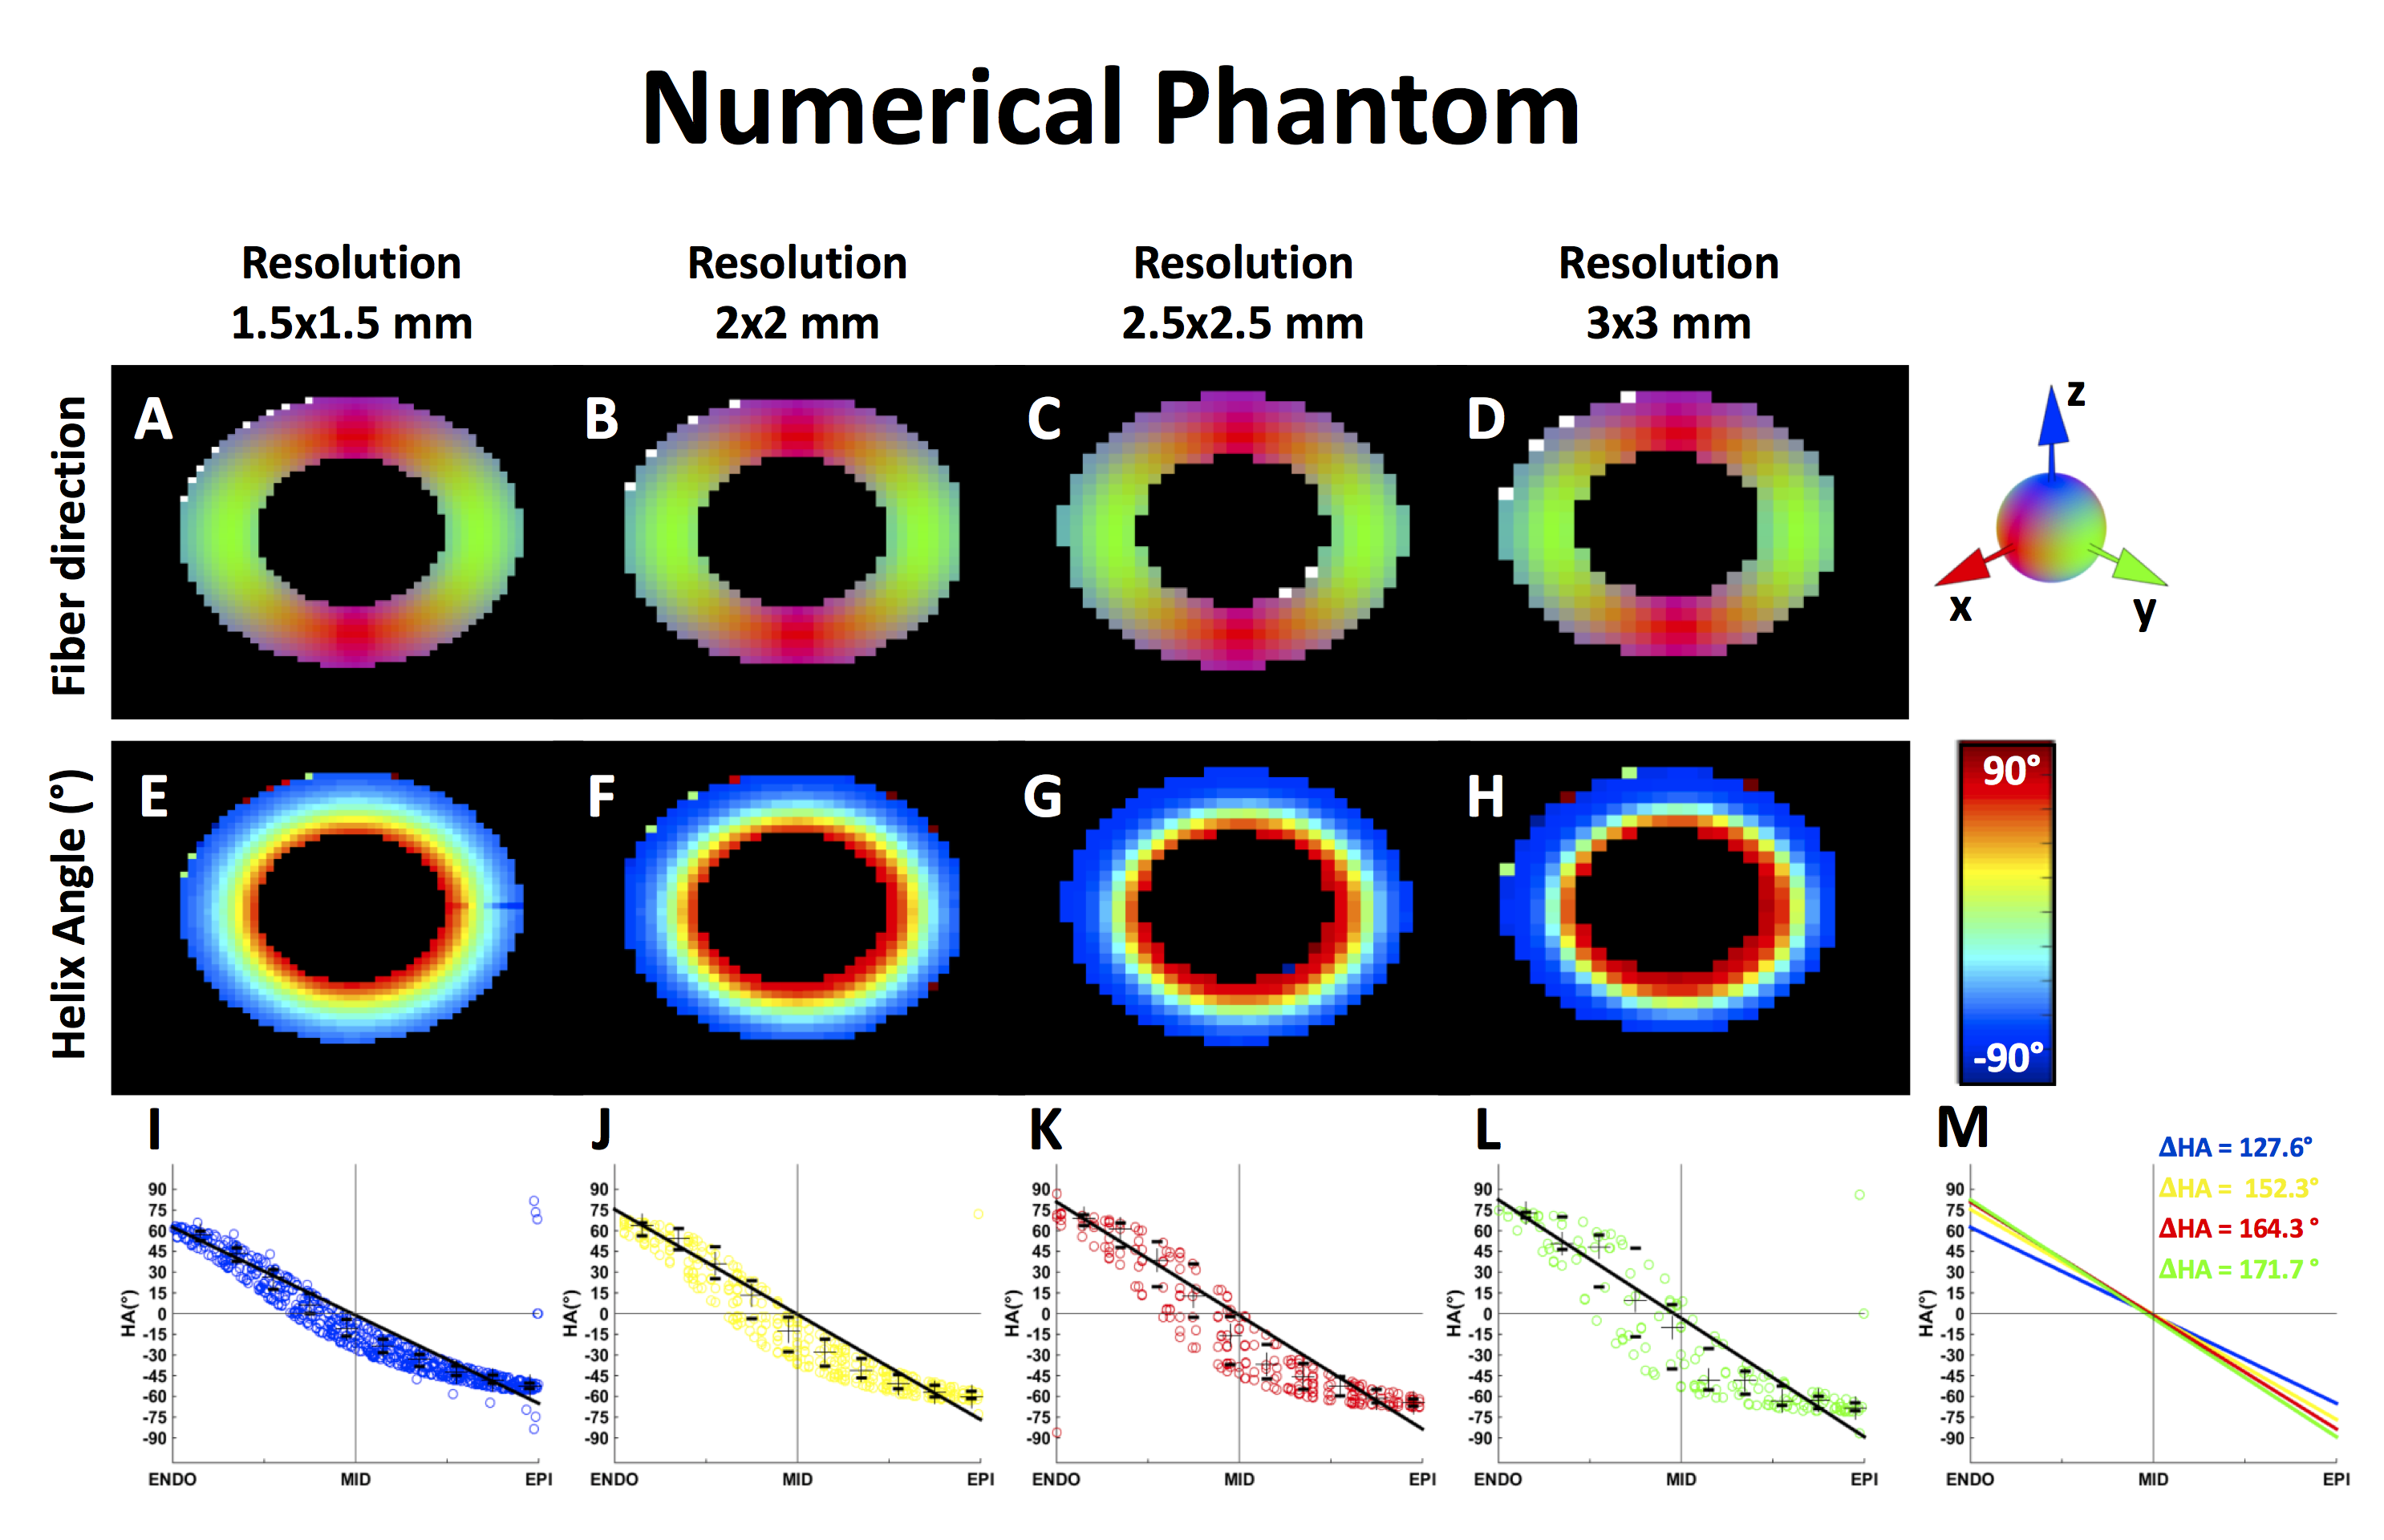
The 2D numerical phantom was generated by imposing a quadratic transmural variation of the fiber HA based on histological data5 with in-plane resolution of 0.1x0.1mm2. Fiber fields corresponding to different pixel resolutions (1.5x1.5mm2, 2x2mm2, 2.5x2.5mm2, 3x3mm2) were generated by averaging at voxel scale the high-resolution fiber field of the numerical phantom.
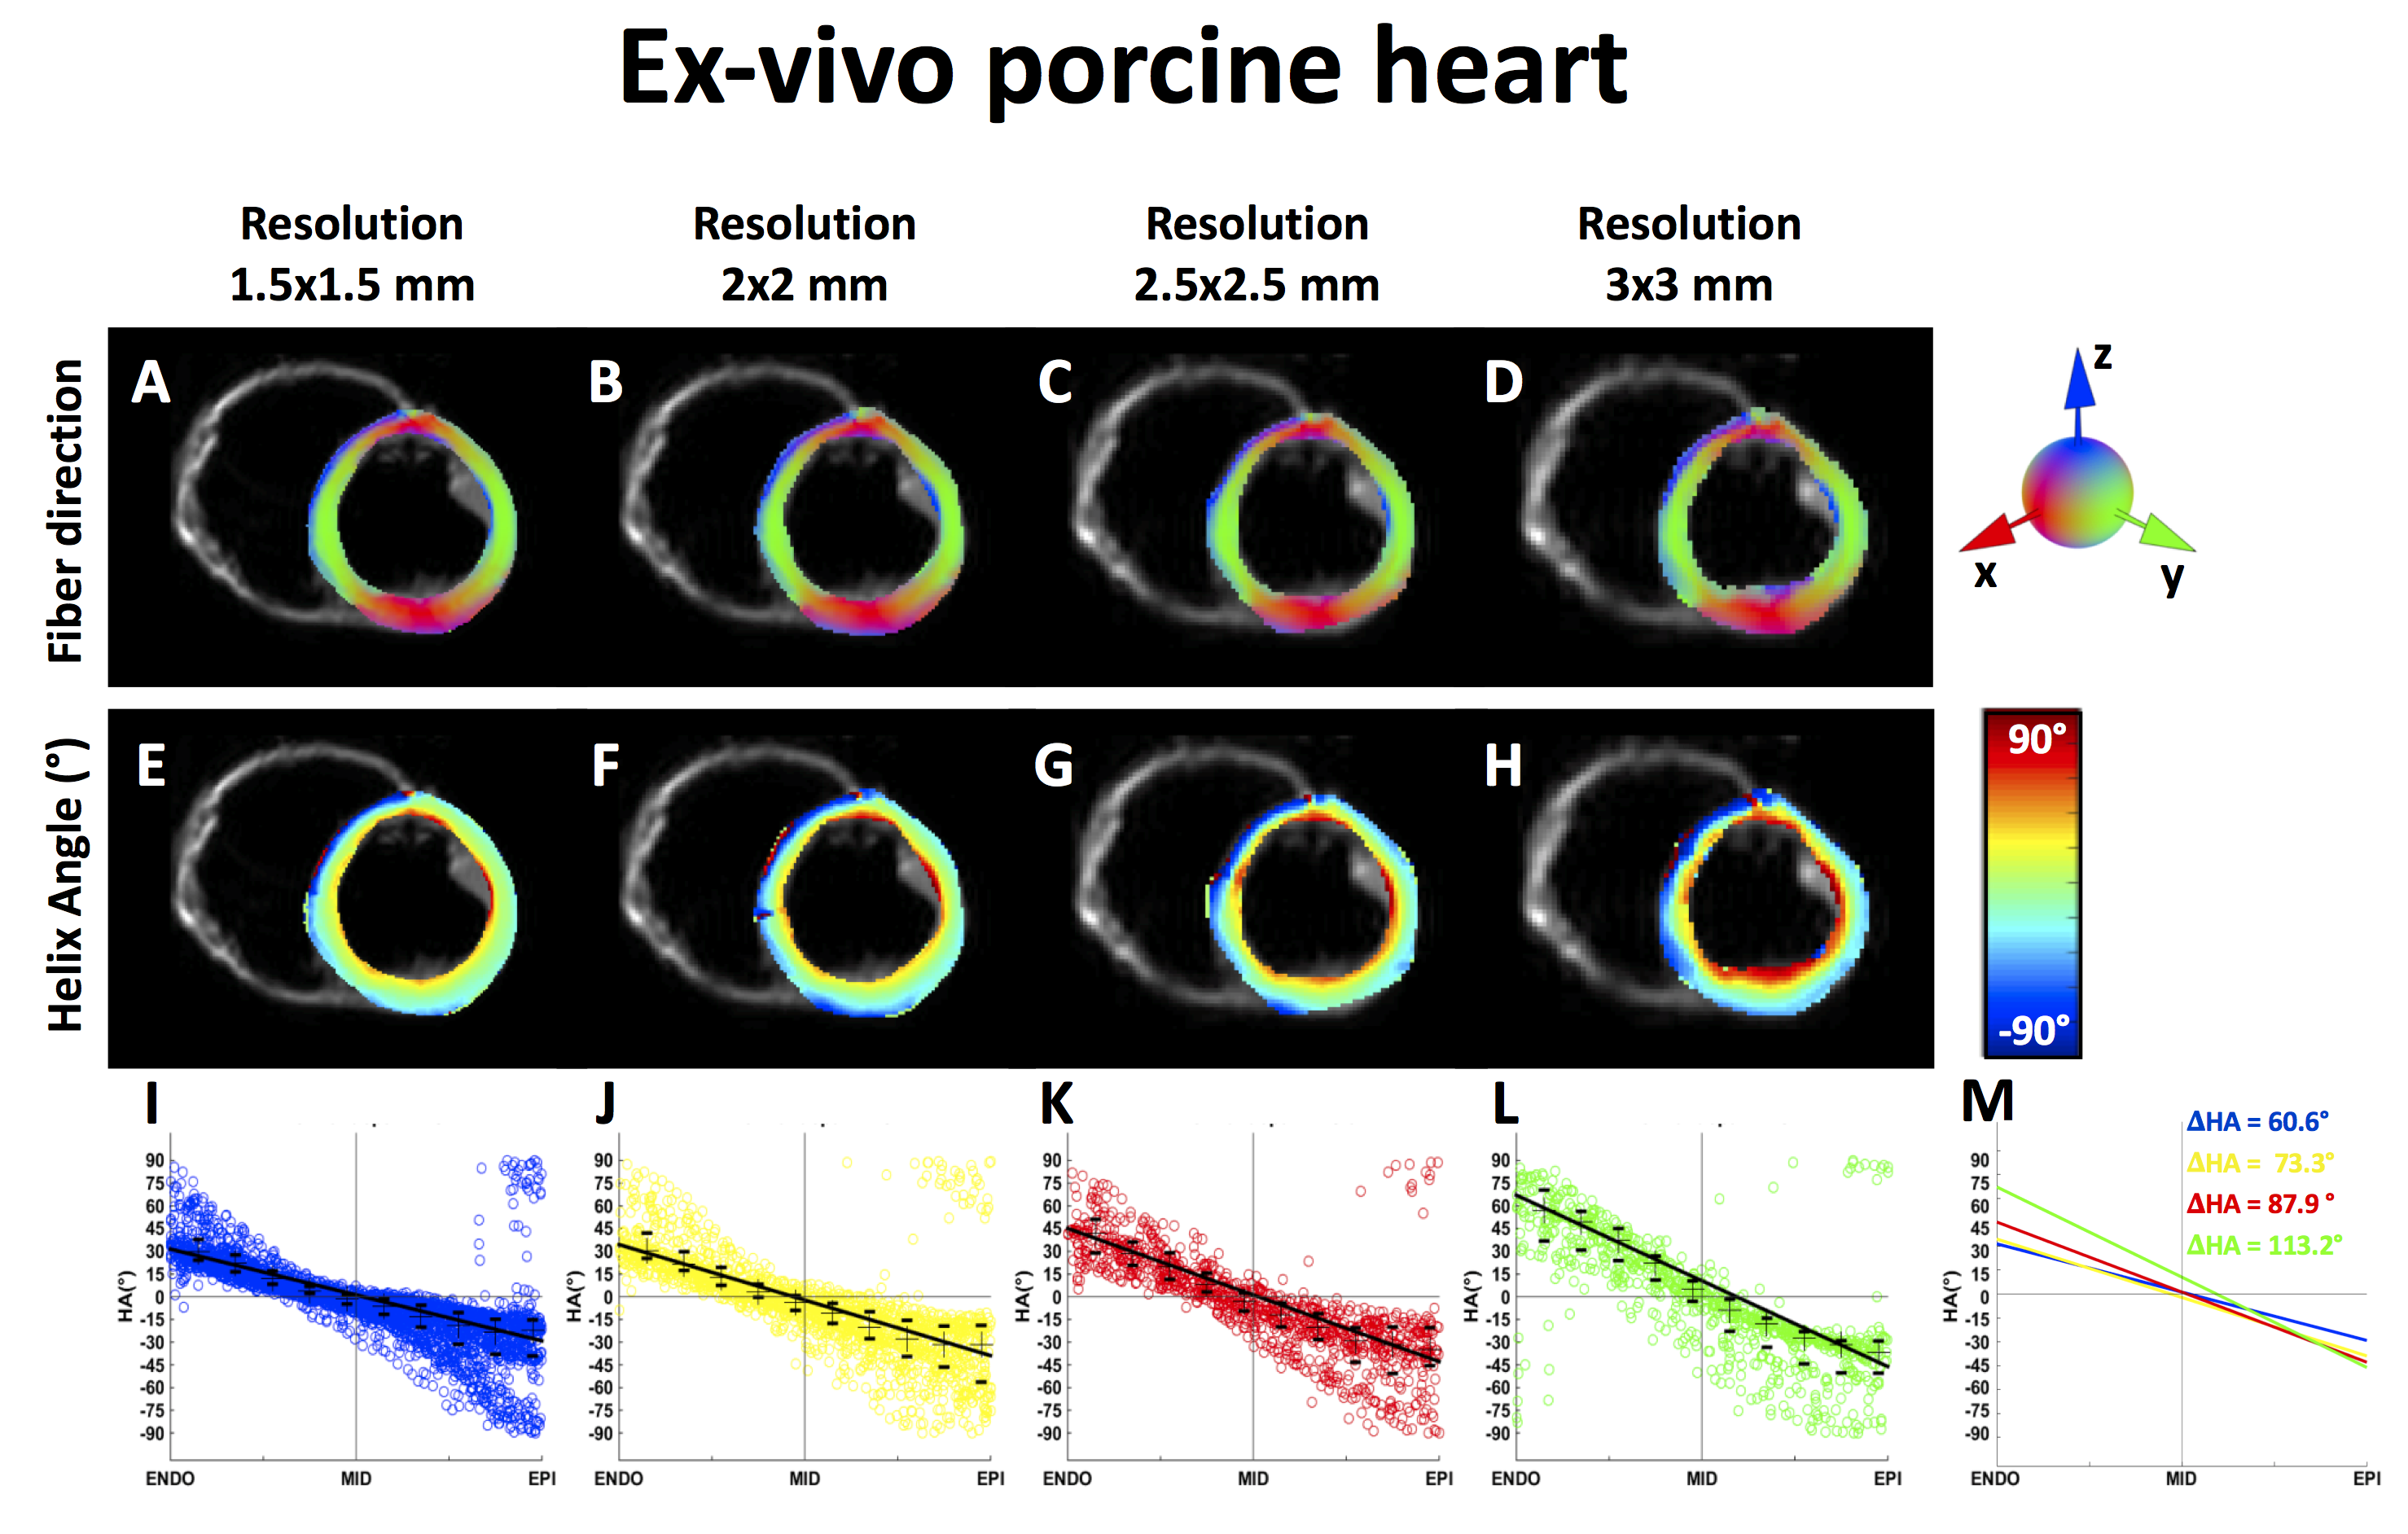
Swine ex vivo images (N=4) were acquired at 3T (Prisma, Siemens) after ethics approval using a first and second order motion compensated diffusion encoding strategy and single-shot spin-echo EPI sequence with the following parameters: TE/TR=61/4000ms, GRAPPA 2x, Partial Fourier=6/8, image matrix=128x128, BW=2250Hz/px, b-value=[0, 350s/mm²], 12 directions and 5 averages. Four acquisitions were realized for each heart with varying spatial resolutions (1.5x1.5x8mm3, 2x2x8mm3, 2.5x2.5x8mm3 and 3x3x8mm3), which was accomplished by only changing the FOV.
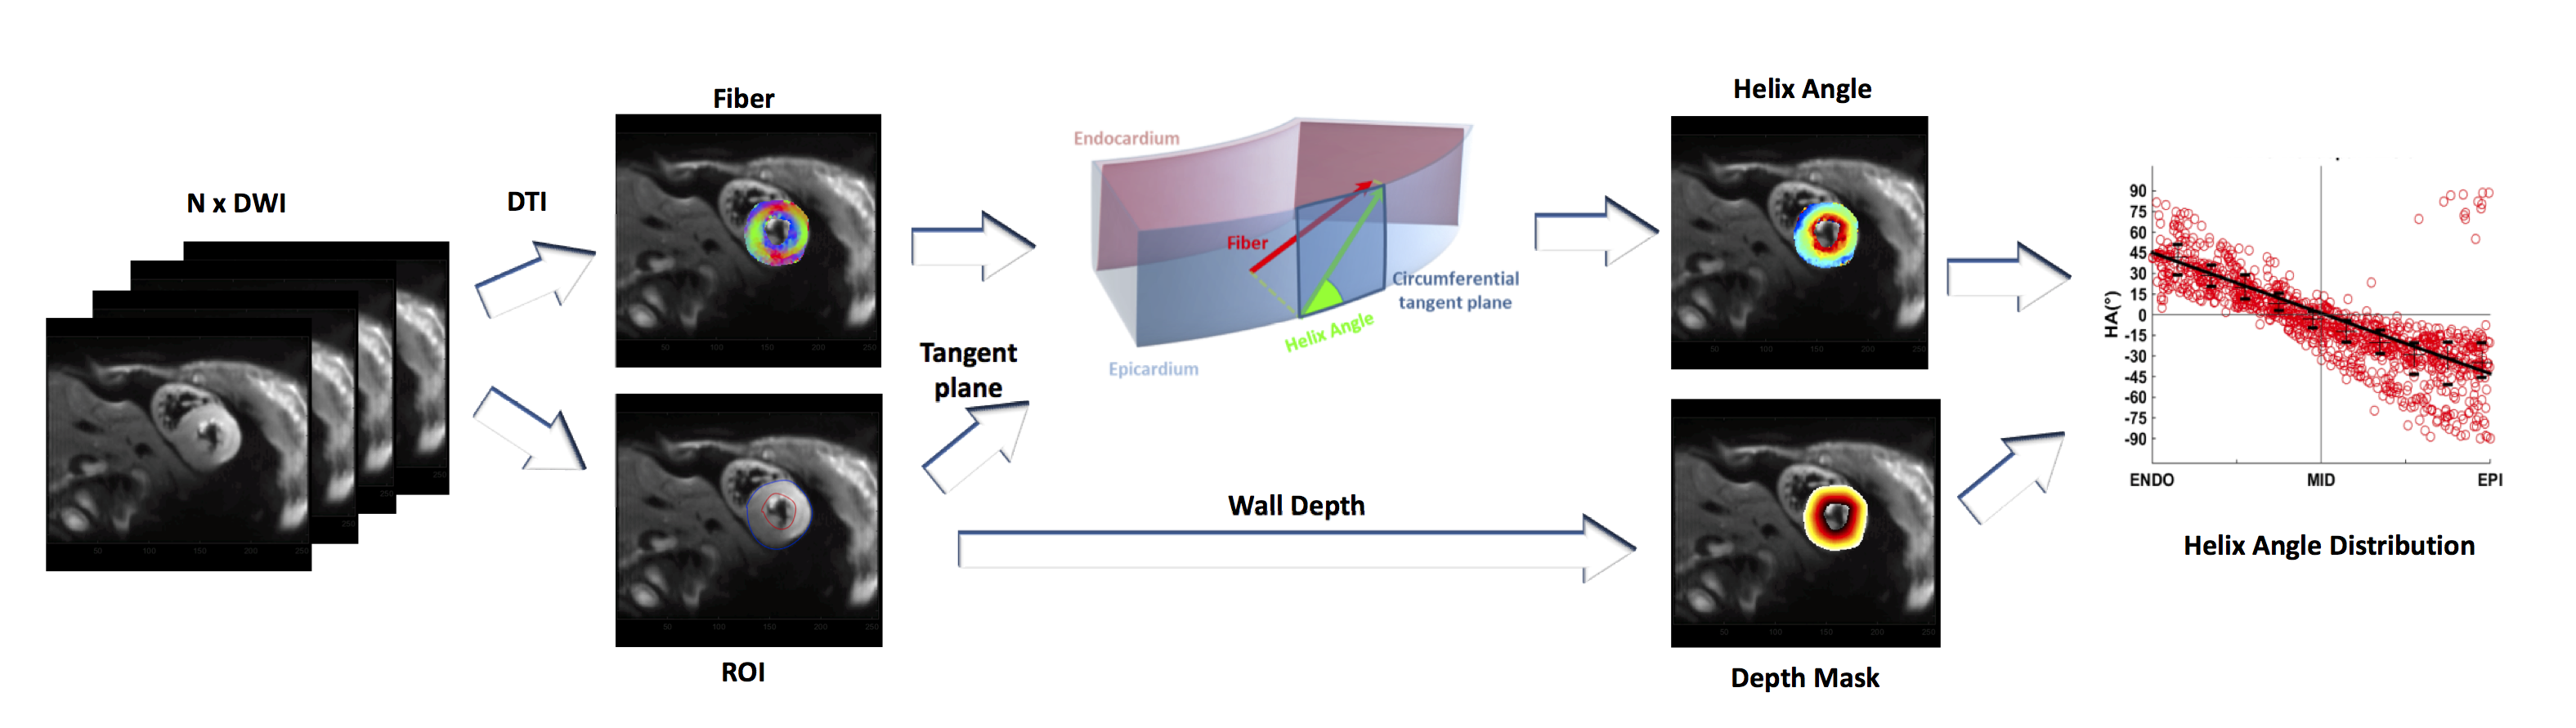
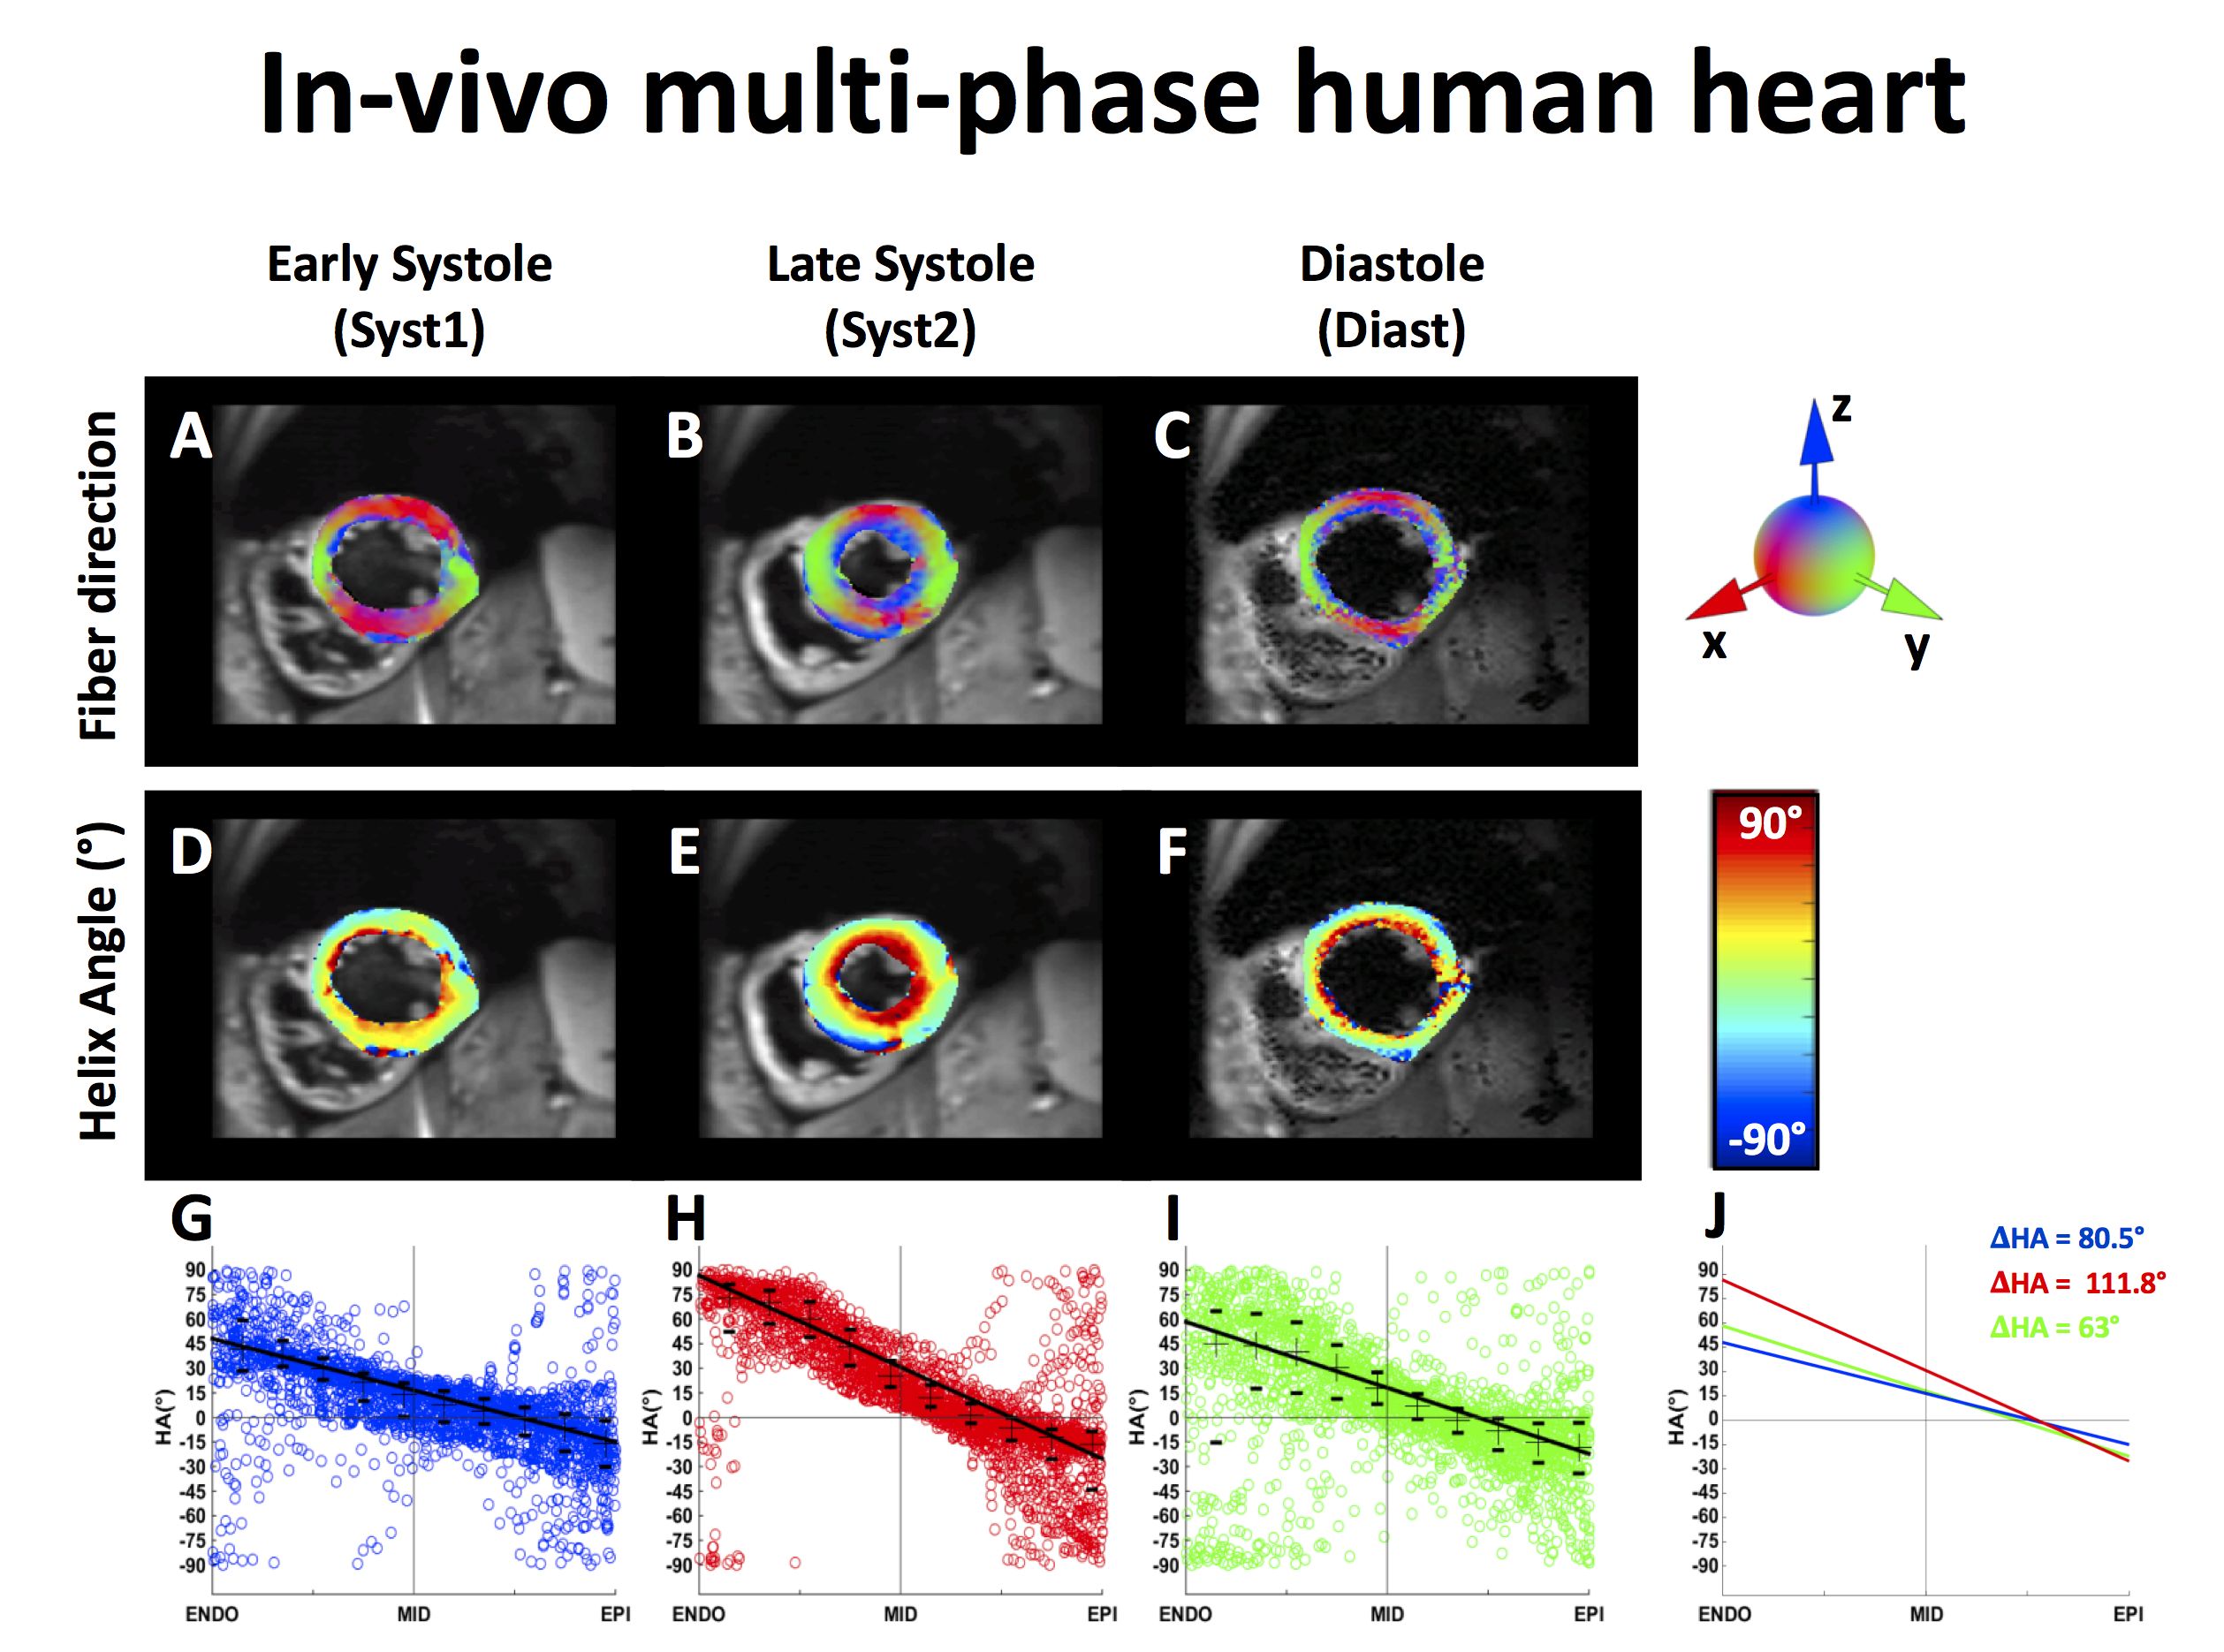
Subsequently, three cardiac phases were imaged in vivo in healthy human volunteers (N=9) after ethics approval: early systole (Syst1), late systole (Syst2), and at diastasis (Diast). Patient-specific Trigger Delays (TD) for the three phases were determined using a prospective TD scout acquisition. High resolution images were acquired under free-breathing conditions in a single mid-ventricular short-axis slice at high resolution (1.5x1.5x8mm3, end-respiratory navigator trigged, ECG triggering, ~5 minutes per cardiac phase). HA maps were computed at each image voxel after manual segmentation of the LV using a ROI based approach to define the local circumferential tangent plane4,6 as shown in Fig. 1. Across each mid-ventricular slice, the HA distribution as a function of transmural Wall Depth (WD) was estimated with linear regression of ten HA medians. The range of Helix Angle ΔHA was then defined as the difference between HAendo and HAepi.
Results
The different imaging resolutions used to reconstruct the images using the numerical phantom impacted the apparent HA distribution (Fig. 2) as function of WD, especially at mid-wall. The calculated ΔHA decreases from 171.7° to 127.6° when the resolution increases from 3x3mm2 to 1.5x1.5mm2.
An example of HA reconstruction ex vivo is given in Fig. 3. Ex vivo results showed similar trend as the simulation wherein higher imaging resolution leads to a tighter distribution of HA. At a resolution of 1.5x1.5mm2, the median transmural HA over the four hearts was [31±1.9°;-3.1±0.9°;-27.9±7.8°] and increased at 3x3mm2 to [48±12.6;-8.4±9.3;-41.9±7.8°] at Endo, Mid, and Epi respectively. The mean ΔHA increased from 67.8±10.1°, to 82.7±13.3°, to 98.3±14.6°, and to 109.1±5.8° for resolution of 1.5x1.5mm2, 2x2mm2, 2.5x2.5mm2 and 3x3mm2, respectively.
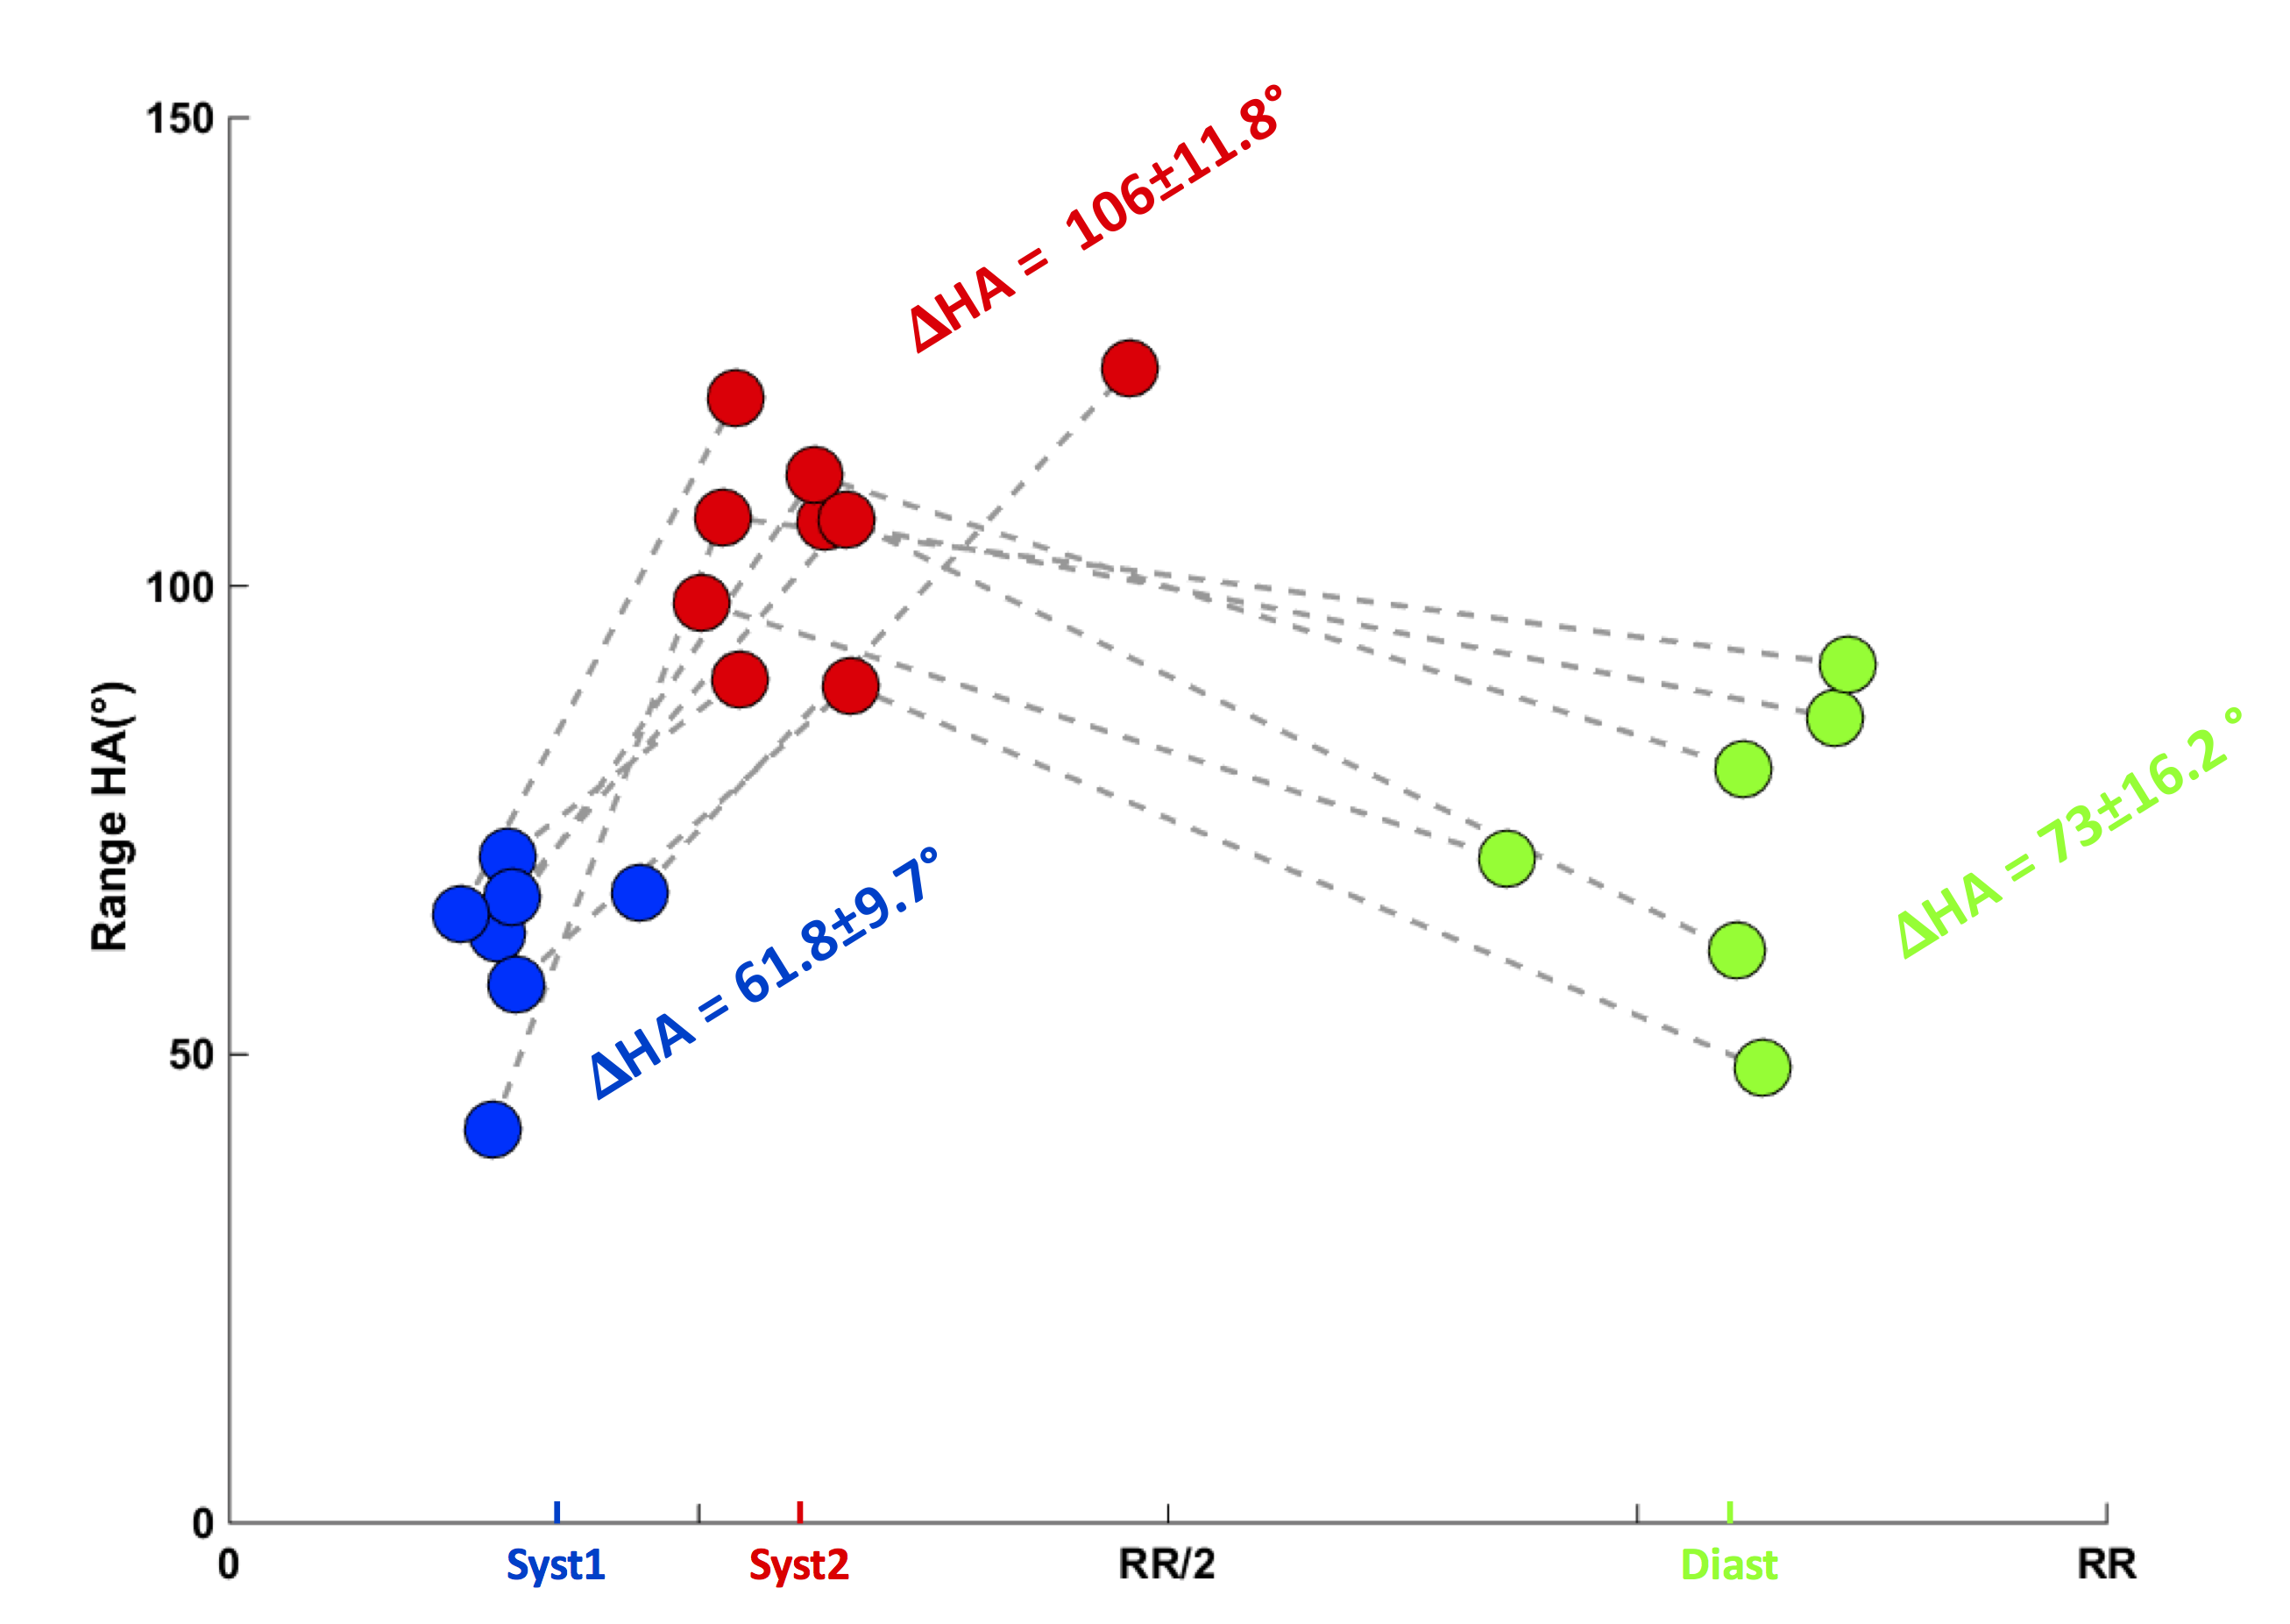
For the in vivo multi-phase acquisitions, cDTI was successfully acquired on all volunteers at Syst2, while the success rate was 66% and 76% for Syst1 and Diast, respectively. An example of multi-phase HA for one volunteer is given in Fig. 4. The median transmural HA across volunteers was [45±6.7°;7.8±6.9°;-9.6±6.4°] for Syst1, [63±6.5°;9.9±6.5°;-24.2±13.6°] for Syst2 and [37.2±9.5°;4.4±6.9°;-18.5±7.5°] for Diast at Endo, Mid, and Epi respectively. As shown in Fig. 5, the ΔHA range significantly increases at late systole (Two-tailed student’s t-test: Syst1 vs Syst2 p<0.01; Diast vs Syst2 p<0.01; Diast vs Syst1 p=0.15).
Discussion
A strong steepening of ΔHA and an increase in the distribution of HA was observed in both simulations and ex vivoscans as the resolution decreased. This indicates that higher resolution is needed to correctly characterize the HA distribution and ΔHA. Furthermore, as a result of imaging resolution only, a lower ΔHA is expected as wall thickening occurs due to contraction. However, we observe a significant increase of ΔHA at peak systole. This indicates that, despite intravoxel averaging, the heart exhibits clear cardiomyocyte aggregate mobility during contraction. This study provides a framework for future analysis of HA mobility in healthy volunteers and in patients with cardiovascular diseases.Acknowledgements
- Funding support from NIH K25 HL135408
- Funding support from NIH R01 HL131975
- Funding support from NIH R01 HL131823
References
[1] Nielles-Vallespin et al. JACC 2017
[2]Aliotta et al. MRM 2016
[3] Stoeck et al. MRM 2015
[4] Stoeck et al. PLoS One 2014
[5] Ennis et al. J Biomech 2008
[6] Lombaert et al. IEEE TransMed Imaging 2012
Figures