3613
Characterising tissue heterogeneity in cerebral metastases using multi-shell multi-tissue constrained spherical deconvolution1School of Psychology, Cardiff University Brain Research Imaging Centre, Cardiff, United Kingdom, 2Velindre University NHS Trust, Velindre Cancer Centre, Cardiff, United Kingdom, 3Department of Cancer and Genetics, Cardiff University School of Medicine, Cardiff, United Kingdom, 4School of Psychology, Australian Catholic University, Victoria, Australia
Synopsis
Considerable attention has focused on characterizing brain tumours using diffusion tensor imaging, and only more recently using advanced modelling techniques. Building on the observation that metastatic tumors exhibit different signal intensities depending on their histological/cellular composition, we investigate how multi-shell multi-tissue constrained spherical deconvolution can characterise tissue heterogeneity within brain metastases.
Introduction
Brain metastases are typically assessed by conventional MRI1 and their impact on white matter remains poorly understood. The value of Apparent Diffusion Coefficient (ADC) derived from Diffusion Weighted Imaging (DWI) for characterising of brain tumours was also explored2. However, ADC and tensor-based metrics such as Fractional Anisotropy (FA) and Mean Diffusivity (MD) typically provides non-specific information about tumor tissue compartments3, 4. With the increased recognition of the limitations associated with the diffusion tensor representation, techniques have been proposed to investigate compartmental microstructural properties of brain tumours5-7, data acquired over multiple b-values, which allows the diffusion signal to be divided into various tissue types8. However, the interpretation of those tissue types remains challenging in diseased brains. Leveraging previous works9, 10 on tissue heterogeneity in white matter hyper intensities, we characterise tissue heterogeneity with brain metastases.
Methods
Acquisition: 2 mm isotropic diffusion MRI data from 15
patients (mean age: 61.6 ± 14.5) diagnosed with brain metastases were
acquired on a Siemens 3T Connectom scanner with b-values = 0, 1000, 2000, 4000,
6000 s/mm² and 60
directions per shells (TE/TR: 59/3000 ms, δ/Δ: 7.0/23.3 ms). 1 mm isotropic T1- weighted and T2 FLAIR images were also acquired for anatomical reference.
Preprocessing: Diffusion data were denoised11, corrected for signal drift12, motion13, distortion14, gradient non-linearities15 and Gibbs ringing16.
Processing: Tumor and edema regions were manually delineated on the high-resolution T1- and T2-weighted anatomical images. A normal appearing white matter (NAWM) mask was obtained by subtracting the tumor and edema mask from a WM mask in each individual’s space. Multi-shell multi-tissue constrained spherical deconvolution8 (MSMT-CSD) was applied to the diffusion data using a set of 3-tissue group-averaged response functions, followed by image intensity inhomogeneity correction of the resulting WM, gray matter (GM) and cerebrospinal fluid (CSF) tissue fractions (WMfrac, GMfrac, CSFfrac). The relative tissue fractions were then normalized10 so that WMfrac + GMfrac + CSFfrac = 1. The T1-weighted images of each patient were registered to their respective total Apparent Fiber Density maps17 using ANTs18. The resulting transformations were then applied to the segmented masks. Finally, the average tissue fractions values were computed within all masks (NAWM, tumor & edema) and subsequently analysed for interpretation.
Results
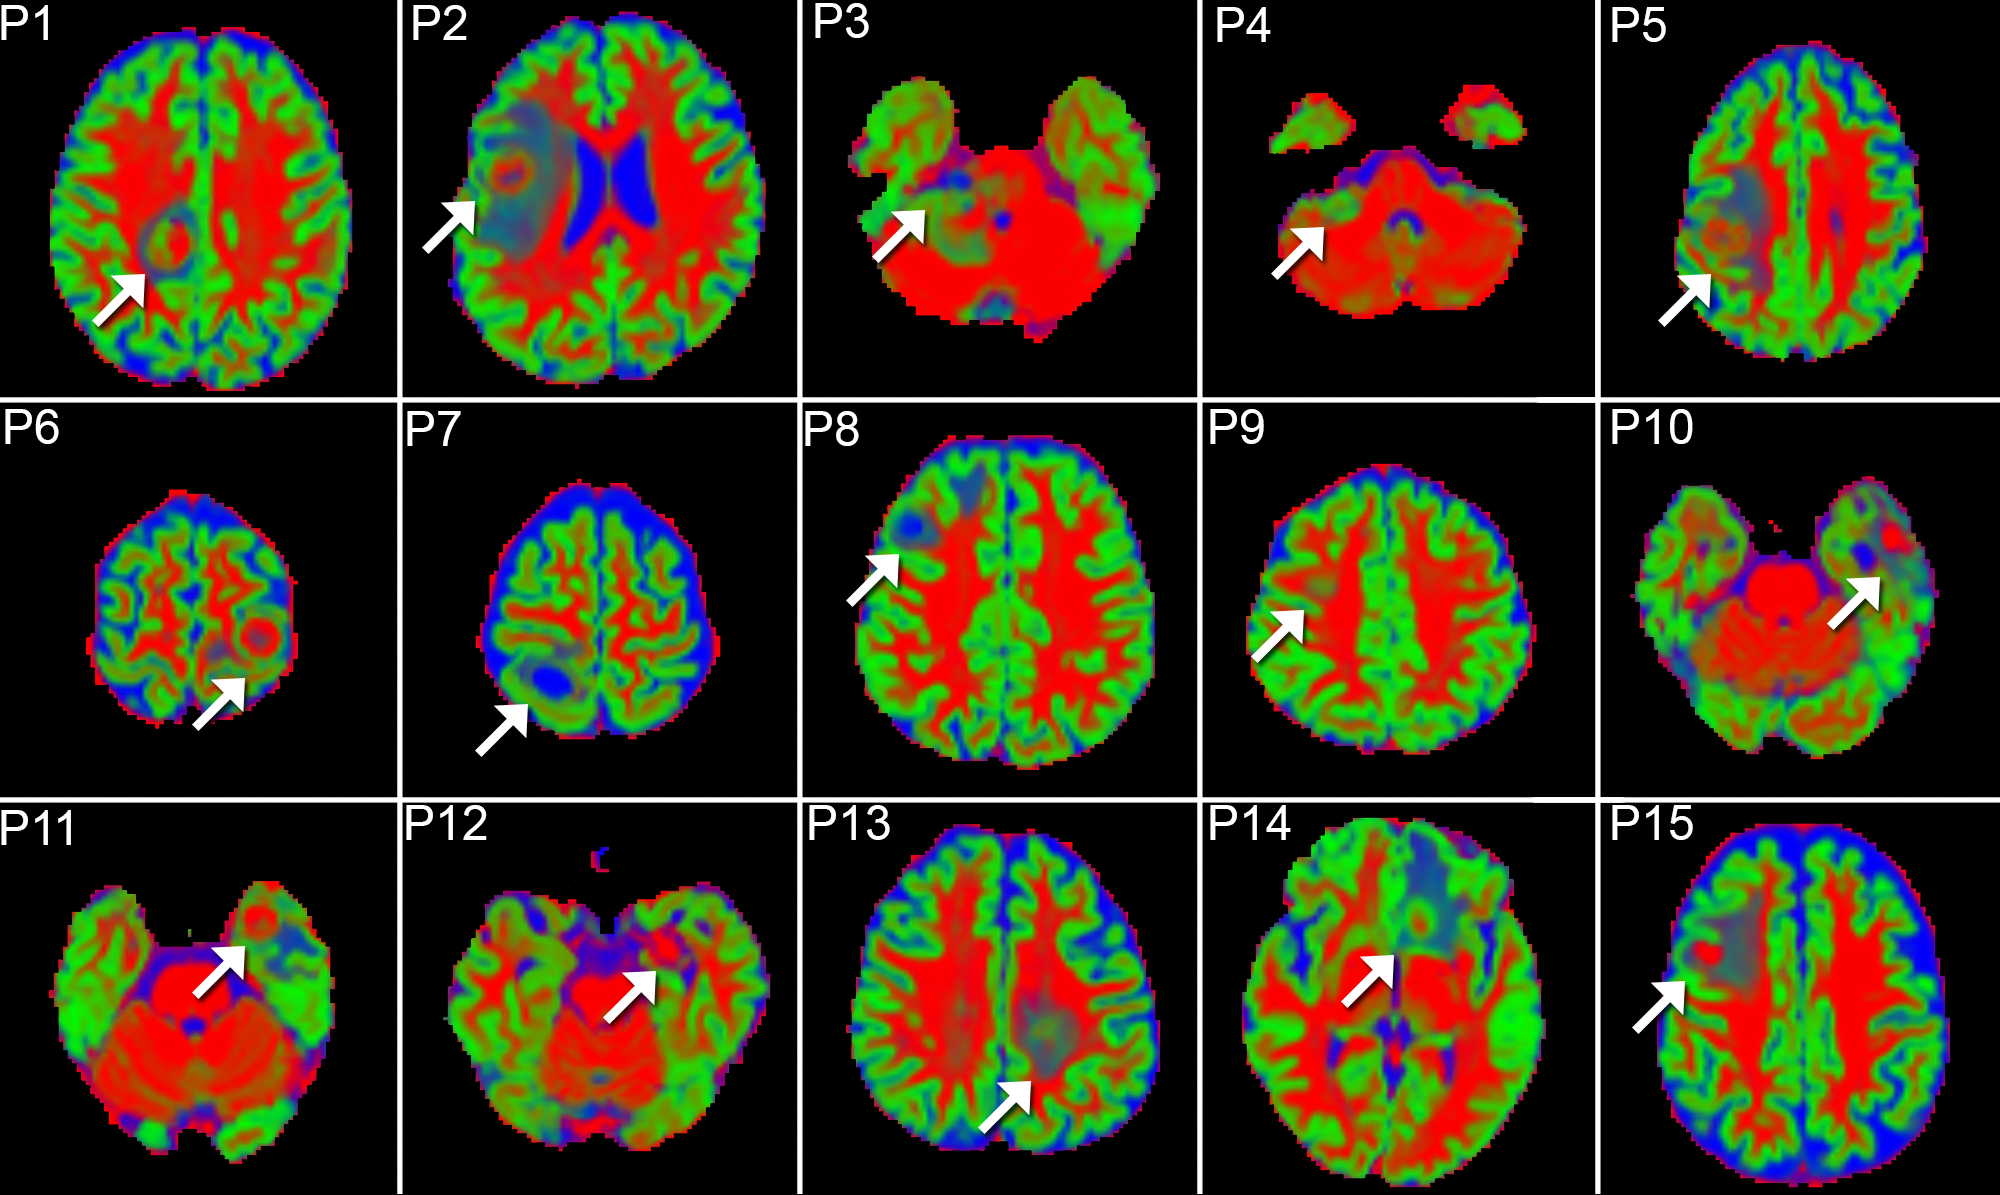
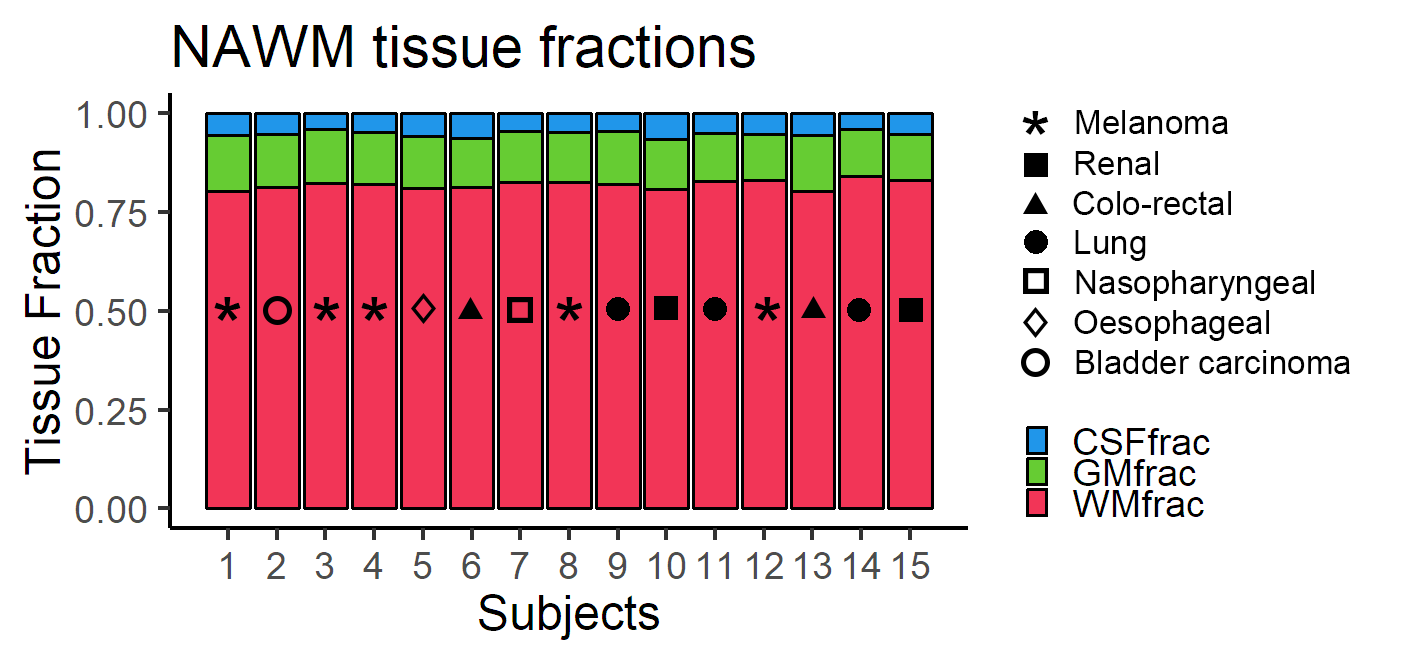
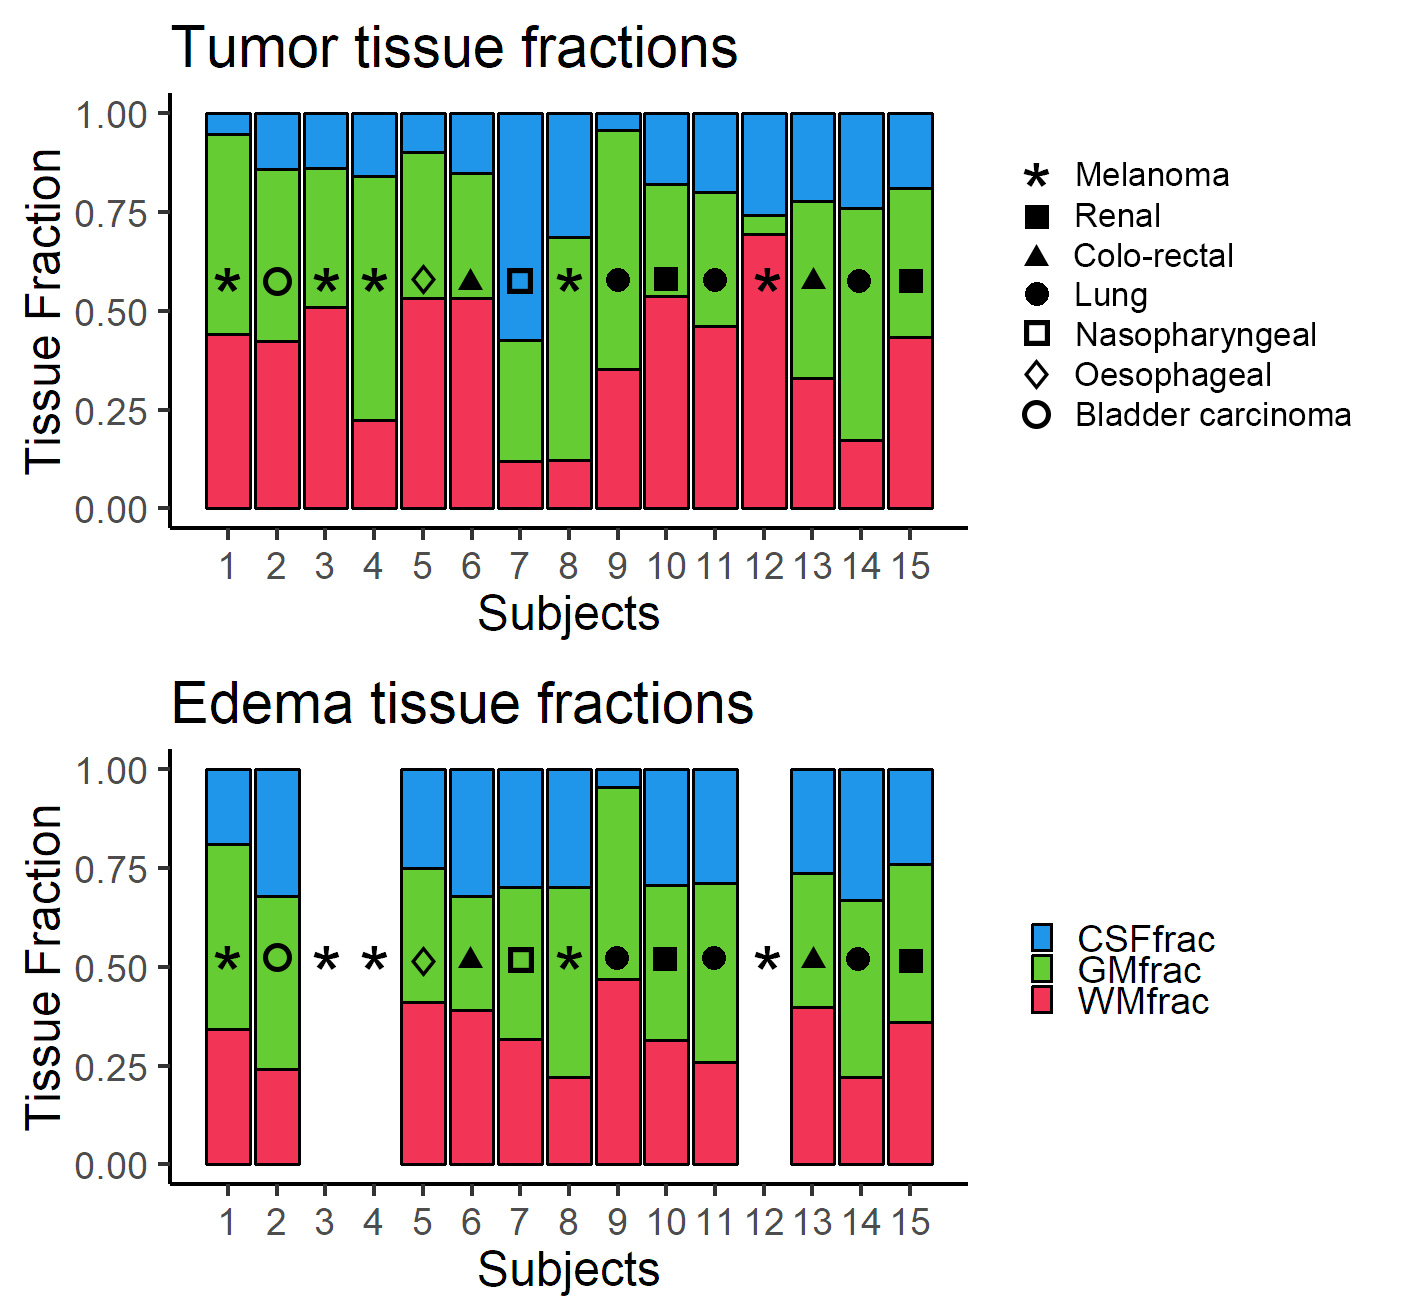
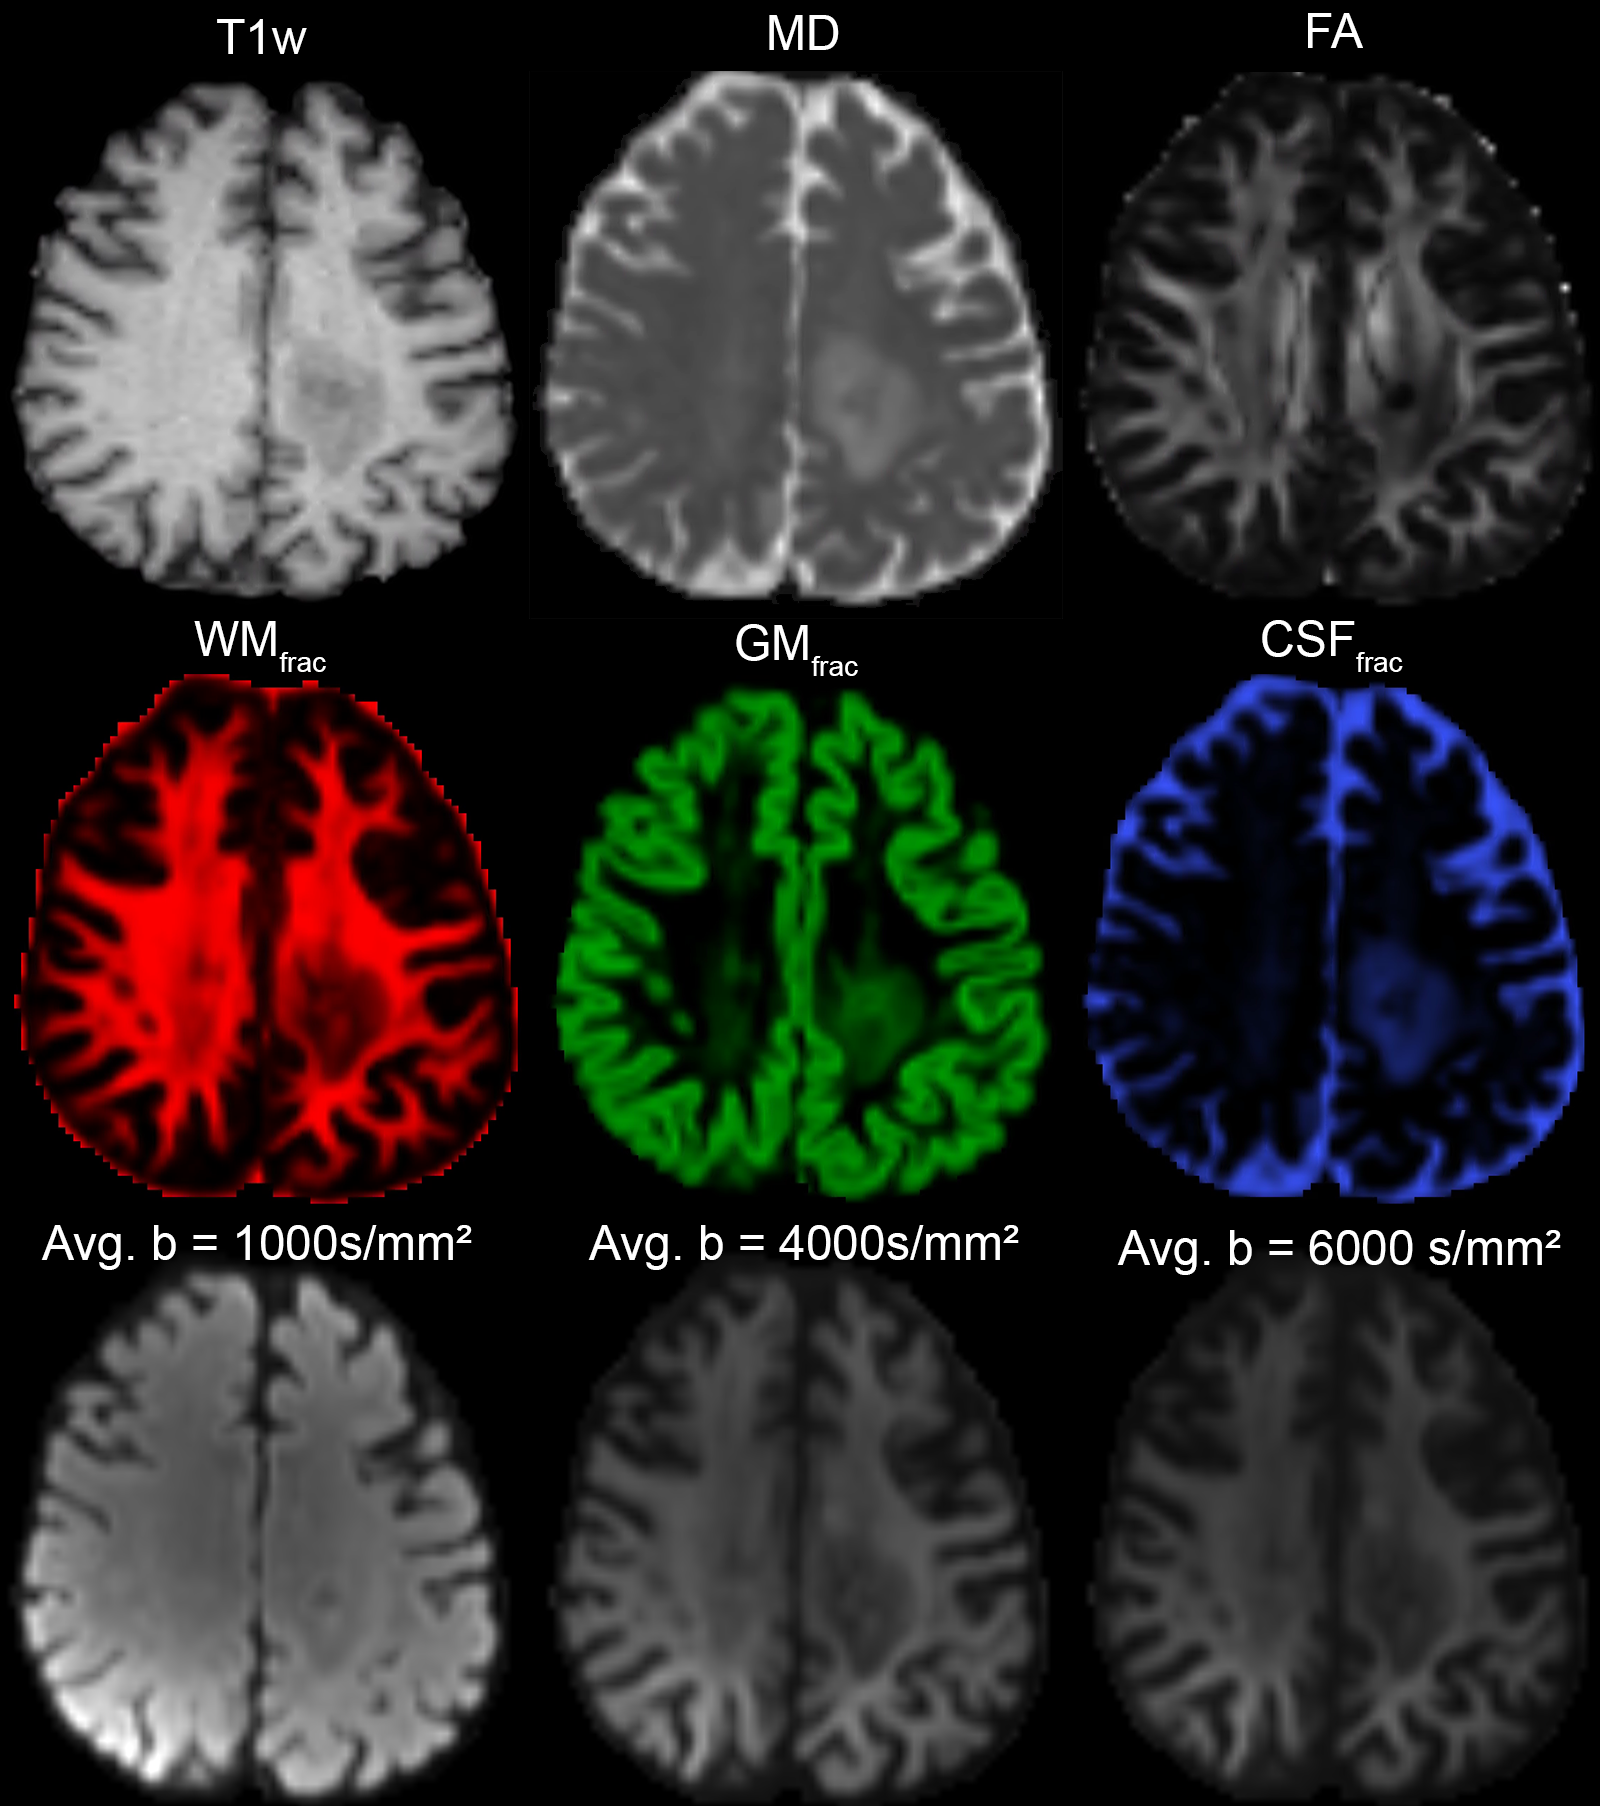
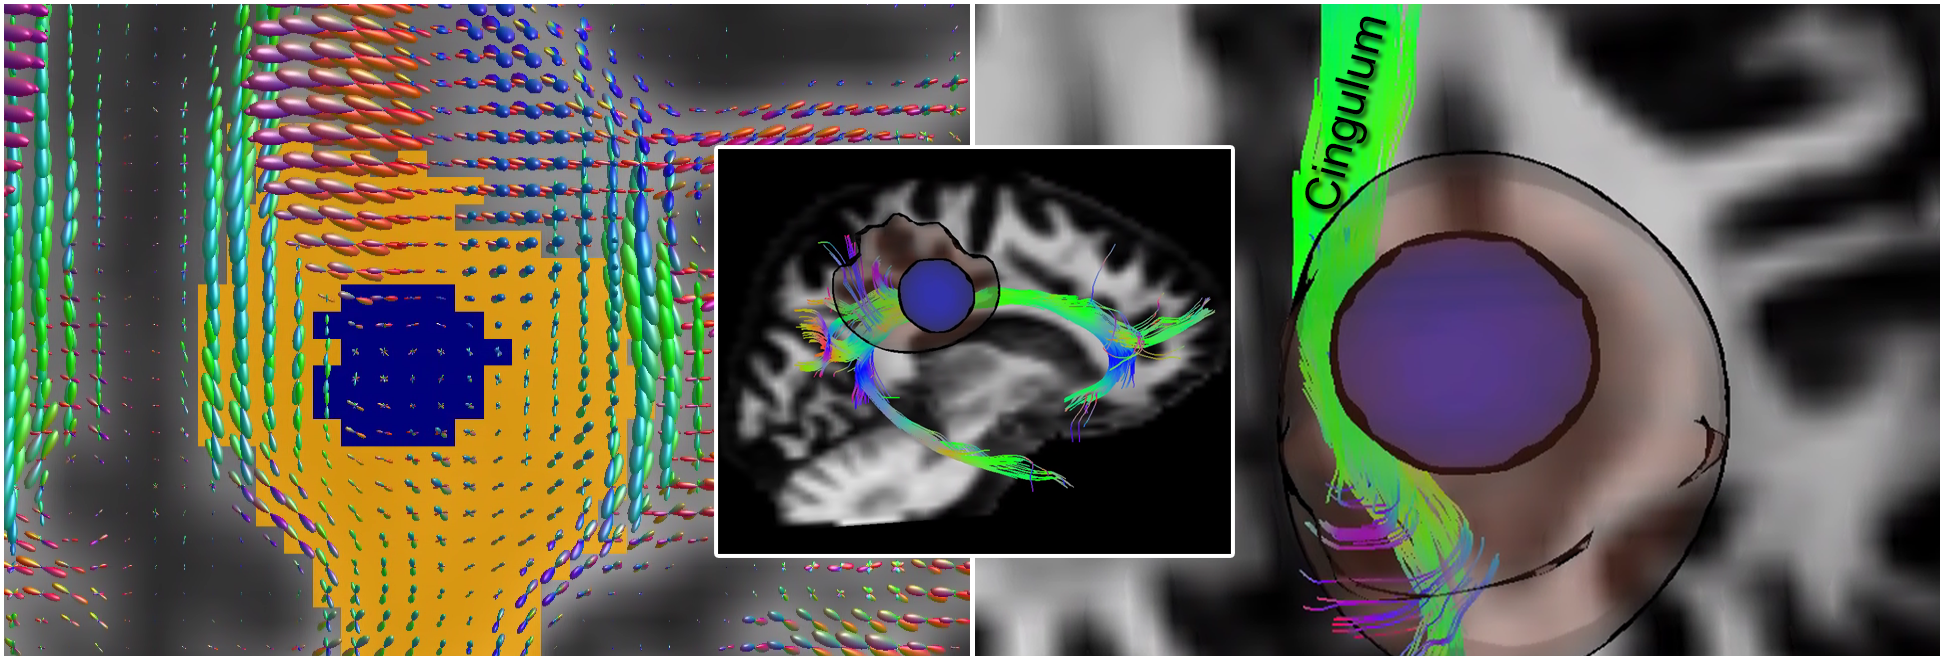
Fig. 1 shows the tissue fraction maps derived from MSMT-CSD. Heterogeneity between the tissue types is observed within and around the tumour of each patient. Fig. 2 establishes a baseline for tissue fractions within NAWM, revealing a non-surprising 82% predominance of WMfrac within that region. Fig. 3 shows increased mixtures of the tissue fractions within the tumour and edema regions. A comparison between various diffusion-derived maps is shown in Fig. 4 for a representative patient (P13). The fiber Orientation Distribution Functions (fODFs) and reconstructed right cingulum bundle show local coherence within the edema region of that same patient (Fig. 5).Discussion
Extrapolating from the recommendations given by Dhollander et al.9 and Miko et al.10 regarding the interpretation of signal fractions obtained from MSMT-CSD, we observed:
- Regions of edema, are associated with a signature of non-zero WMfrac, GMfrac and CSFfrac, which could be interpreted by the additional presence of extracellular fluid in the extra-axonal space. Coherence between neighbouring fODFs within the edematous region (assessed qualitatively) is also indicative of preserved structural architecture (WMfrac). The presence of a GMfrac here captures the hindered isotropic diffusion of the tissue.
- In tumor regions, the increase of GMfrac could reflect deep necrosis or degradation of the extra-cellular matrix within the tumor. The remaining non-zero WMfrac could be a result of the highly-restricted cellularity of the tumor. Furthermore, the fact that brain metastases often occur at the grey-white matter junction, or in the arterial watershed areas, partly explains the heterogeneity in the observed tissue fractions.
Conclusion
These results highlight the capabilities of MSMT-CSD to disentangle tissue heterogeneity (tissue fractions) within brain metastases. Notably, we observed an increase in GMfrac and CSFfrac within the micro-environment of the tumours - which potentially reflects their cellularity level as well as their edema content. Histological confirmation and corroboration of the current results with post radio-therapy images is the subject of ongoing work.Acknowledgements
MC is supported by the Postdoctoral Fellowships Program from the Natural Sciences and Engineering Research Council of Canada (NSERC) and a Wellcome Trust New Investigator Award (to DKJ). NSI is funded by Wales Cancer Research Centre. C.M.W.T is supported by a Rubicon grant from the NWO. This work was also funded by a Wellcome Trust Strategic Award, a Wellcome Trust New Investigator Award and a Moondance charity board at Velindre Cancer Centre.References
[1] Jenkinson, Michael D., et al. "Management of cerebral metastasis: evidence-based approach for surgery, stereotactic radiosurgery and radiotherapy." European Journal of Cancer 47.5 (2011): 649-655.
[2] Hayashida, Y., et al. "Diffusion-weighted imaging of metastatic brain tumors: comparison with histologic type and tumor cellularity." American Journal of Neuroradiology 27.7 (2006): 1419-1425.
[3] Sternberg, E. J., M. L. Lipton, and Judah Burns. "Utility of diffusion tensor imaging in evaluation of the peritumoral region in patients with primary and metastatic brain tumors." American Journal of Neuroradiology 35.3 (2014): 439-444.
[4] Zakaria, Rasheed, et al. "Diffusion-weighted MRI characteristics of the cerebral metastasis to brain boundary predicts patient outcomes." BMC medical imaging 14.1 (2014): 26.
[5] Lima, Mami, et al. "Characterization of glioma microcirculation and tissue features using intravoxel incoherent motion magnetic resonance imaging in a rat brain model." Investigative radiology 49.7 (2014): 485-490.
[6] Panagiotaki, Eletheria, et al. "Noninvasive quantification of solid tumor microstructure using VERDICT MRI." Cancer research (2014).
[7] Szczepankiewicz, Filip, et al. "The link between diffusion MRI and tumor heterogeneity: Mapping cell eccentricity and density by diffusional variance decomposition (DIVIDE)." NeuroImage142 (2016): 522-532.
[8] Jeurissen, Ben, et al. "Multi-tissue constrained spherical deconvolution for improved analysis of multi-shell diffusion MRI data." NeuroImage 103 (2014): 411-426.
[9] Dhollander, Thijs, et al. "Towards interpretation of 3-tissue constrained spherical deconvolution results in pathology", Proc. ISMRM 2017 (#1815)
[10] Miko, Remika, et al. "Investigating microstructural heterogeneity of white matter hyperintensities in Alzheimer’s disease using single-shell 3-tissue constrained spherical deconvolution." Proc. ISMRM 2018 (#0135)
[11] Veraart, Jelle, et al. "Denoising of diffusion MRI using random matrix theory." NeuroImage 142 (2016): 394-406.
[12] Vos, Sjoerd B., et al. "The importance of correcting for signal drift in diffusion MRI." Magnetic resonance in medicine 77.1 (2017): 285-299.
[13] Andersson, Jesper LR, and Stamatios N. Sotiropoulos. "An integrated approach to correction for off-resonance effects and subject movement in diffusion MR imaging." Neuroimage 125 (2016): 1063-1078.
[14] Andersson, Jesper LR, Stefan Skare, and John Ashburner. "How to correct susceptibility distortions in spin-echo echo-planar images: application to diffusion tensor imaging." Neuroimage 20.2 (2003): 870-888.
[15] Glasser, Matthew F., et al. "The minimal preprocessing pipelines for the Human Connectome Project." Neuroimage 80 (2013): 105-124.
[16] Kellner, Elias, et al. "Gibbs‐ringing artifact removal based on local subvoxel‐shifts." Magnetic resonance in medicine 76.5 (2016): 1574-1581.
[17] Raffelt, David, et al. "Apparent fibre density: a novel measure for the analysis of diffusion-weighted magnetic resonance images." Neuroimage 59.4 (2012): 3976-3994.
[18] Avants, Brian B., et al. "A reproducible evaluation of ANTs similarity metric performance in brain image registration." Neuroimage 54.3 (2011): 2033-2044.
[19] Chamberland, Maxime, et al. "Real-time multi-peak tractography for instantaneous connectivity display." Frontiers in neuroinformatics 8 (2014): 59.
Figures