3611
Propagation of Bias in Moment-Matching Based Standard Model Parameter Estimation1Center of Functionally Integrative Neuroscience (CFIN) and MINDLab, Department of Clinical Medicine, Aarhus University, Aarhus, Denmark, 2Department of Physics and Astronomy, Aarhus University, Aarhus, Denmark, 3Champalimaud Neuroscience Programme, Lisbon, Portugal
Synopsis
Moment-matching is one proposed approach for estimating Standard Model parameters which partly overcomes the issues of the model’s notoriously shallow fitting landscape. The method achieves robustness by matching the model’s moments to the cumulants of the data determined by diffusion kurtosis imaging which is stable and clinically feasible. However, estimates of cumulants generally suffer from bias due to the use of finite b-values. Here, it is demonstrated that this bias propagates to the model-parameter estimates resulting in substantial inaccuracy even for small b-values.
Introduction
The pursuit of resolving microstructure below nominal imaging resolution has led to the development of the so-called “Standard Model”[1] (SM), a compartment model of diffusion representing axons as sticks. It was previously shown that parameter estimation from direct fitting of the model to clinical grade data is unstable due to a shallow fitting landscape with multiple plausible minima[2,3]. One proposed scheme for increasing robustness seeks to exploit the stability of diffusion kurtosis imaging[4] (DKI) and works by matching the moments or cumulants of SM to those determined from the data[3,5,6]. Unfortunately, estimated DKI metrics suffer from bias caused by using finite b-values even though the cumulants are formally defined at b = 0[7]. Here, we compare moment-matching and full nonlinear SM fitting, and demonstrate that while the DKI based approach is robust, the moments’ bias propagates to the estimated standard model parameters.Methods
We employ simulated as well as real diffusion data obtained from a rat cervical spinal cord. To connect with earlier work[6,8], we use an axisymmetric framework but the results are not limited to systems with axial symmetry. The considered SM incarnation consists of an intra- and extra-axonal compartment as detailed in [6]. In all simulations, the ground truth signal was generated by spherical convolution with a Watson ODF using Lebedev’s quadrature[9].
Parameters of a Watson SM are estimated by matching its cumulants to those obtained by an initial axisymmetric DKI fit to the data as detailed previously [6]. Assuming a specific fibre ODF is favourable for the moment-matching method because all simulated data is generated with the same ODF (Watson). The bias can thus only be expected to increase for more general methods with unknown ODFs and the estimation errors obtained here are thus lower limits.
We compare to direct fitting of SM as represented by its Legendre expansion to order $$$l=8$$$. Starting points are obtained from fitting under the constraint of moment-matching (slightly relaxed by “freeing” the $$$l=4$$$ ODF coefficient) which is a reduced problem in the ODF expansion coefficients; only the pair up to $$$l=4$$$ is used. The multiple local minima of this problem initialize the full fit.
Both methods identify up to several candidate solutions with similar fitting quality. We do not consider the question of branch choice and thus only compare performance under the assumption that the correct choice can somehow be made.
Spinal Cord Data
All experiments were preapproved by the local animal ethics committee operating under local and EU laws.
The rat spinal cord was extracted as previously described[10]. A 16.4T Bruker Aeon Ascend magnet with a 5mm birdcage coil mounted on a micro5 probe capable of producing up to 3000mT/m isotropically was employed. The spinal cord was placed in a Fluorinert-filled 5mm NMR tube and kept at 37C throughout the experiments. Data was recorded using an EPI readout [FOV: 6x6mm2, acquisition matrix: 70x70, in-plane resolution: 86x86μm2, slice thickness: 1.35mm]. The number of gradient directions was 64 in each of 33 b-shells linearly varied from 0 to 9ms/μm2. Gradient pulse width was 2ms with a separation of 45ms. Data was denoised[11] and corrected for Rician bias[12] and Gibbs ringing[13] prior to further analysis.
Results
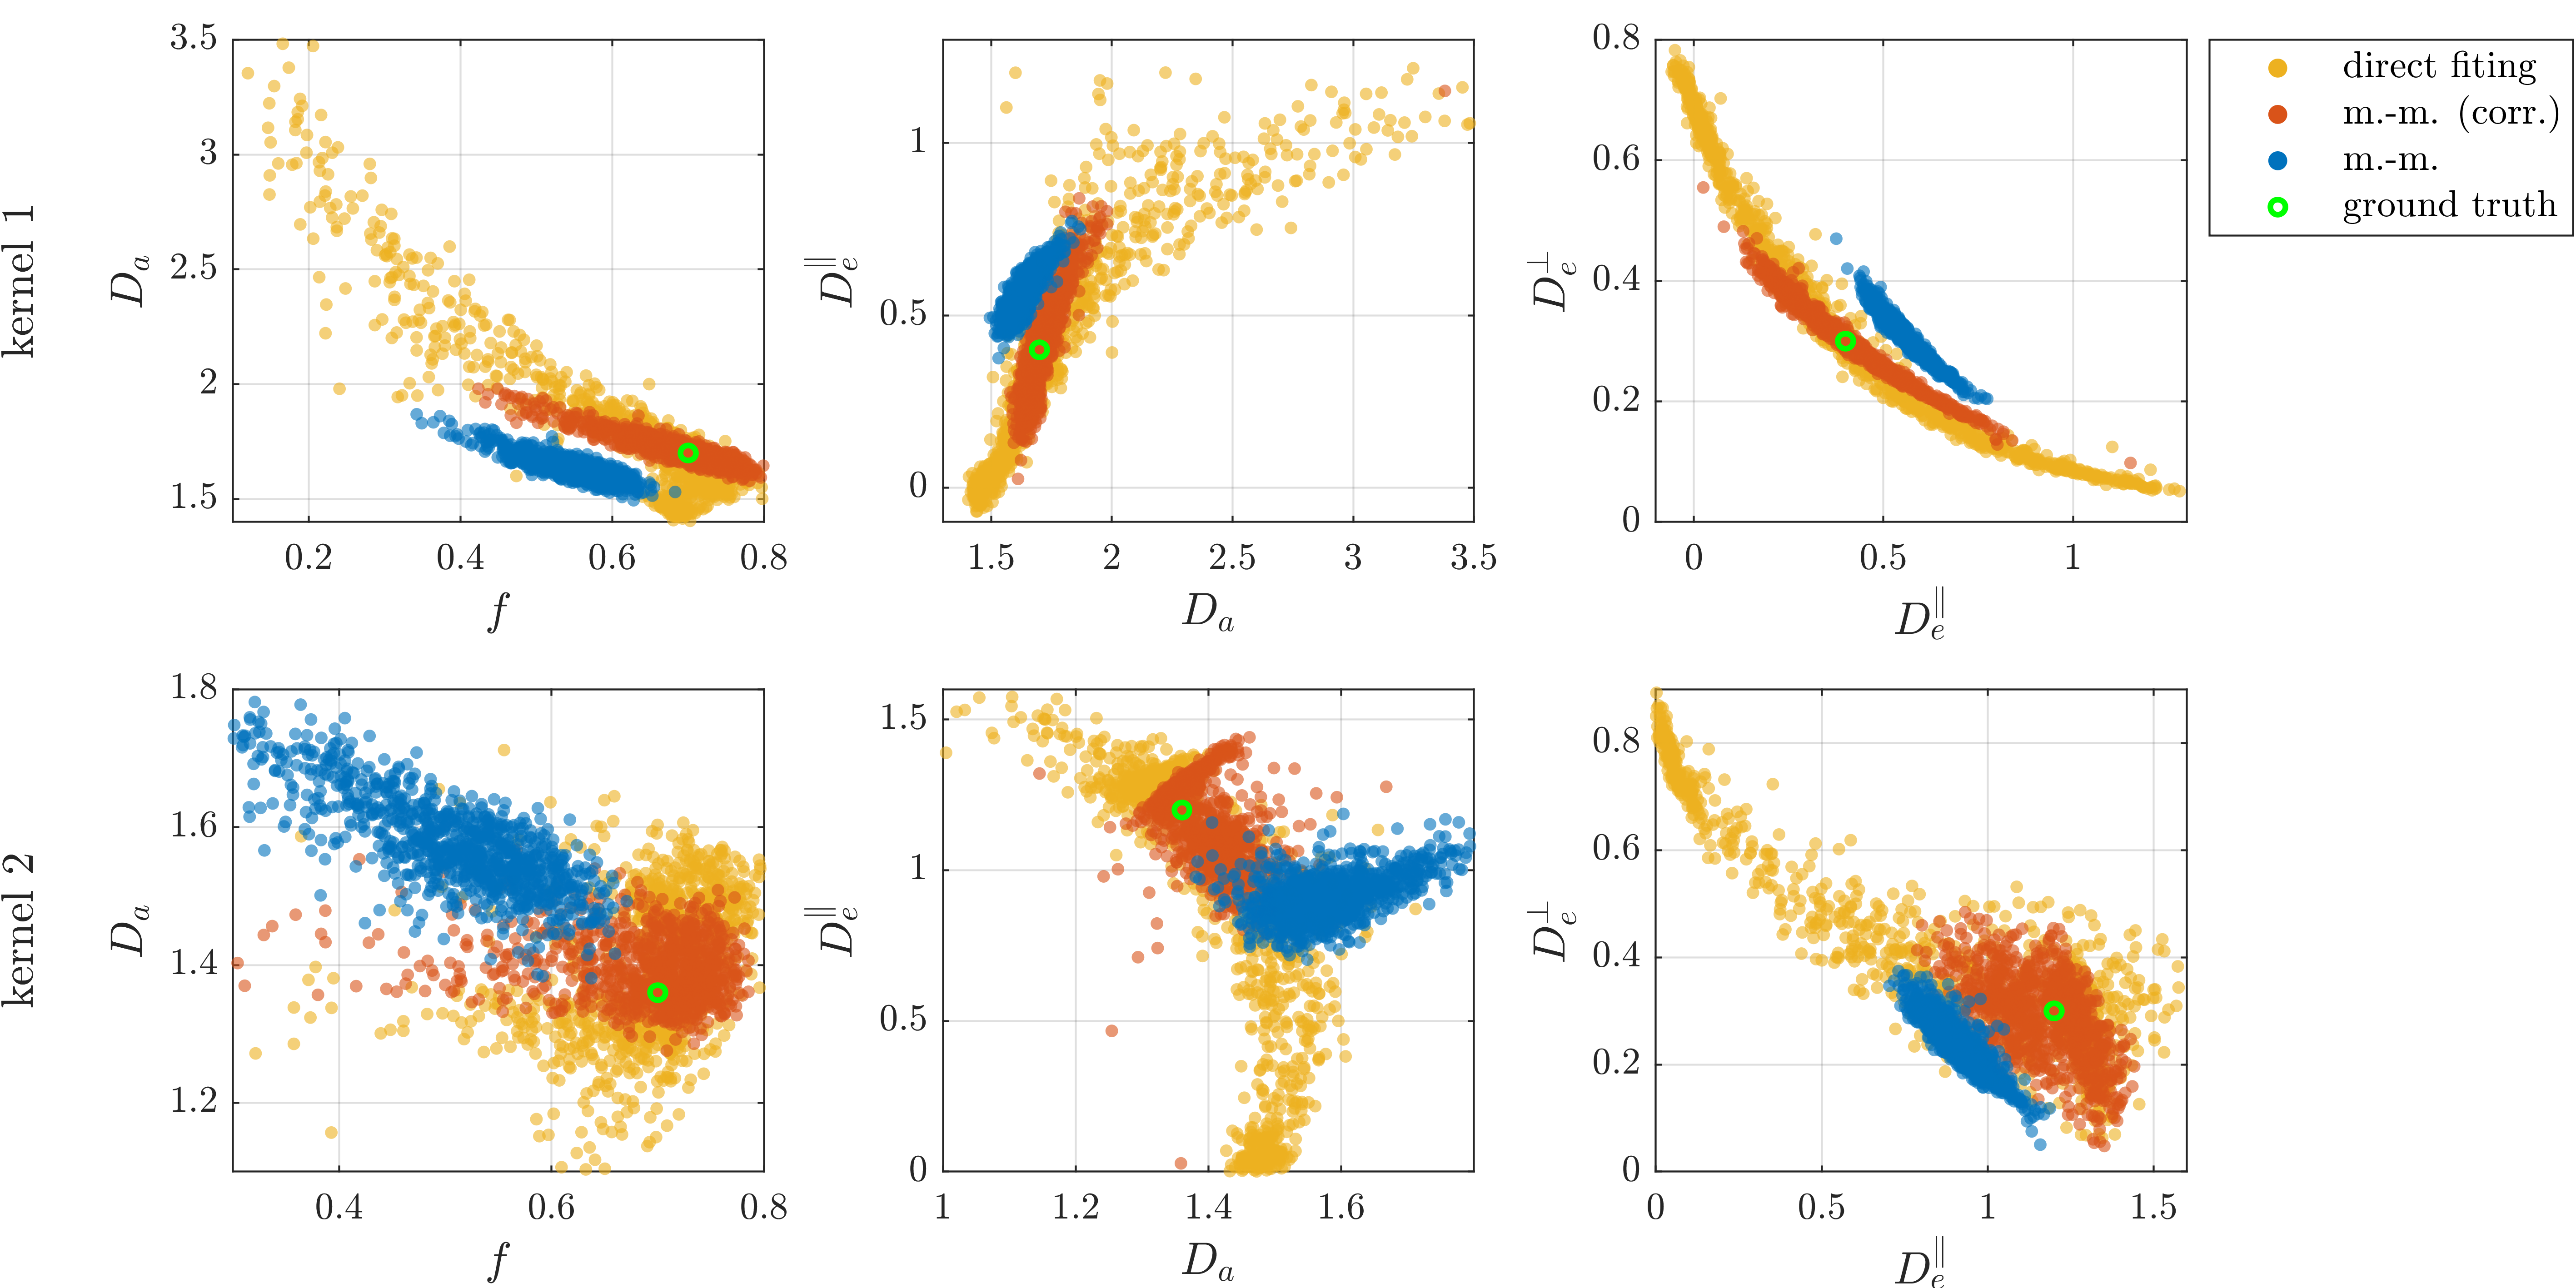
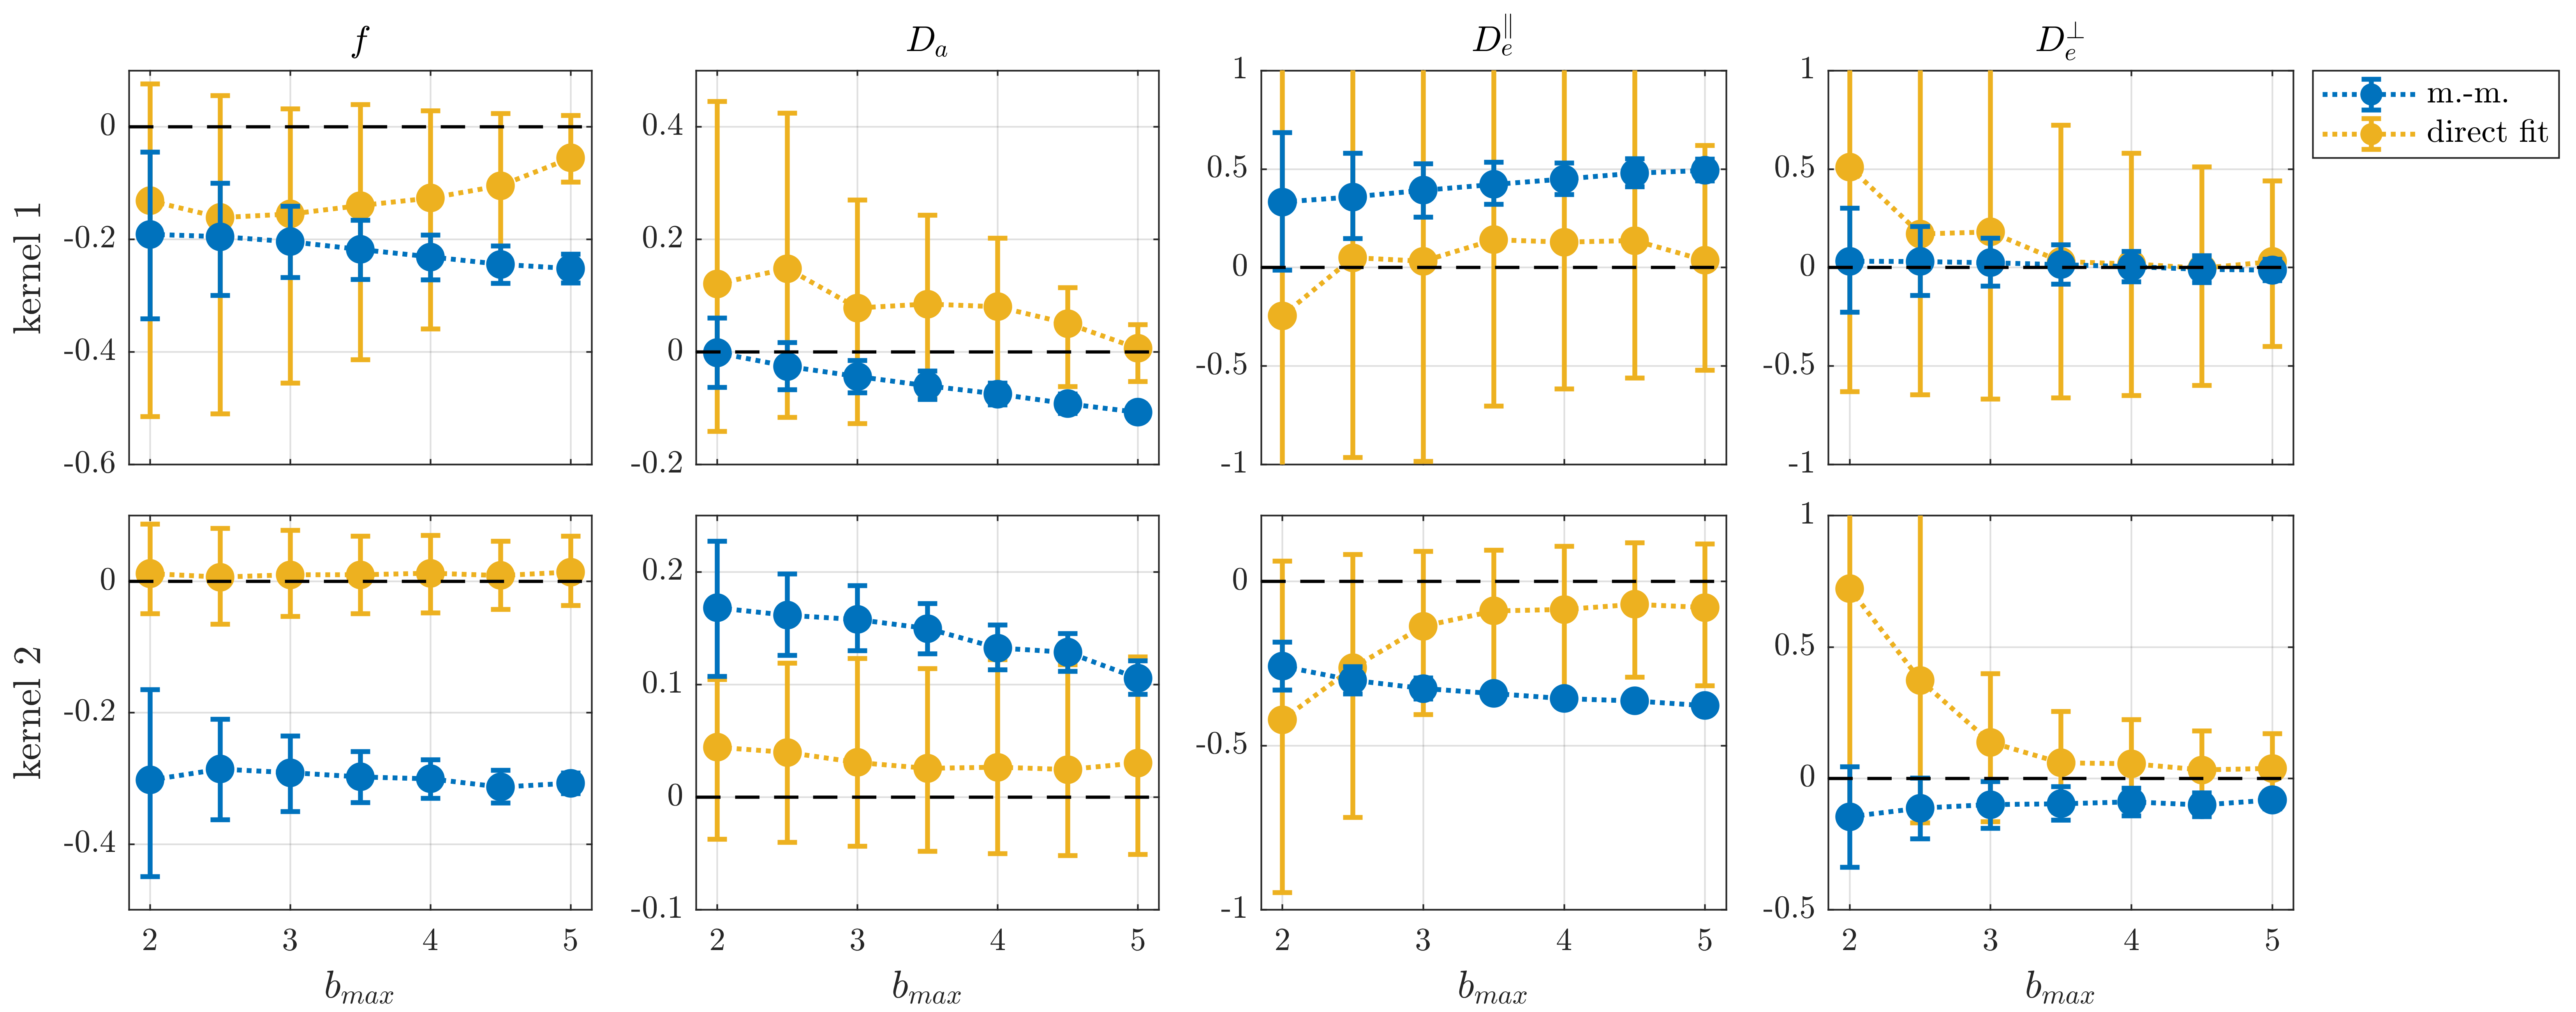
Figures 1 and 2, reveal the inaccuracy of moment-matching from simulations where ground-truth is known a-priori. It is noteworthy that even though the bias is generally reduced with lower b-values, it can still be substantial (here, on the order of 30%) even for small b-values ~2ms/μm2. In comparison, direct fitting is accurate for moderately large b-values but requires very large b-values to obtain adequate precision. Additionally, the results illustrate that experimental requirements to achieve a target precision in specific parameters depend sensitively on the true parameters.
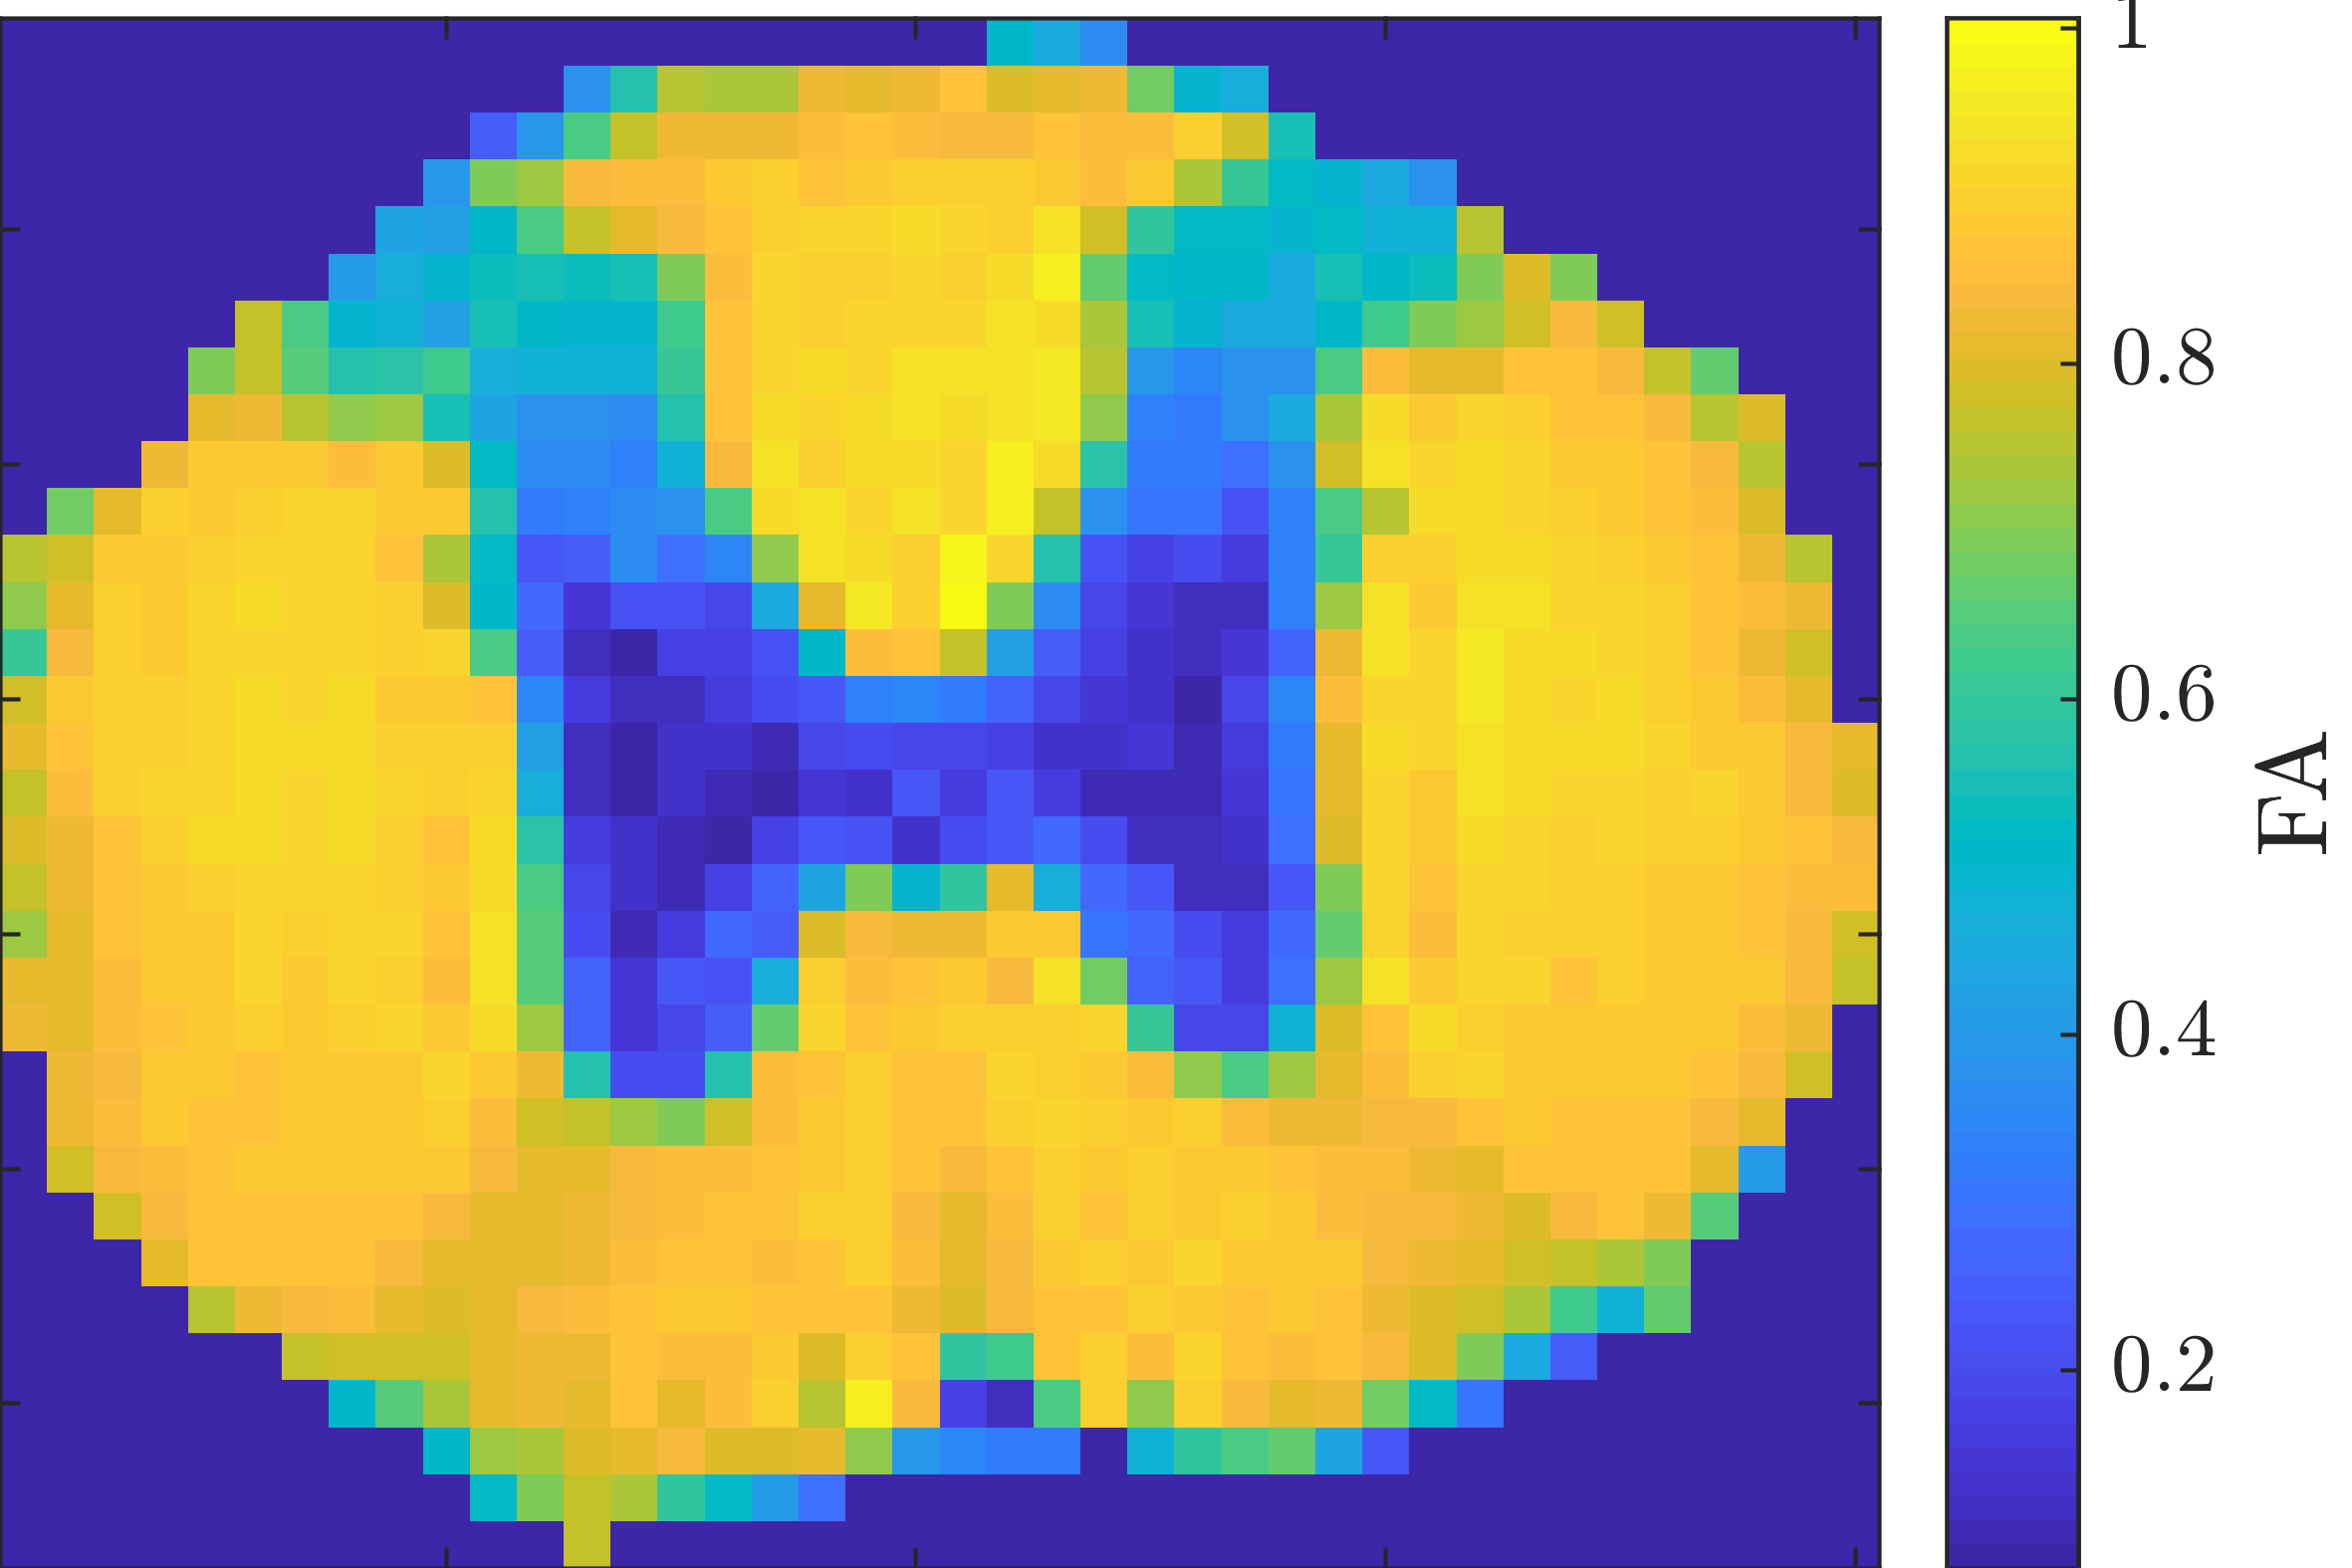
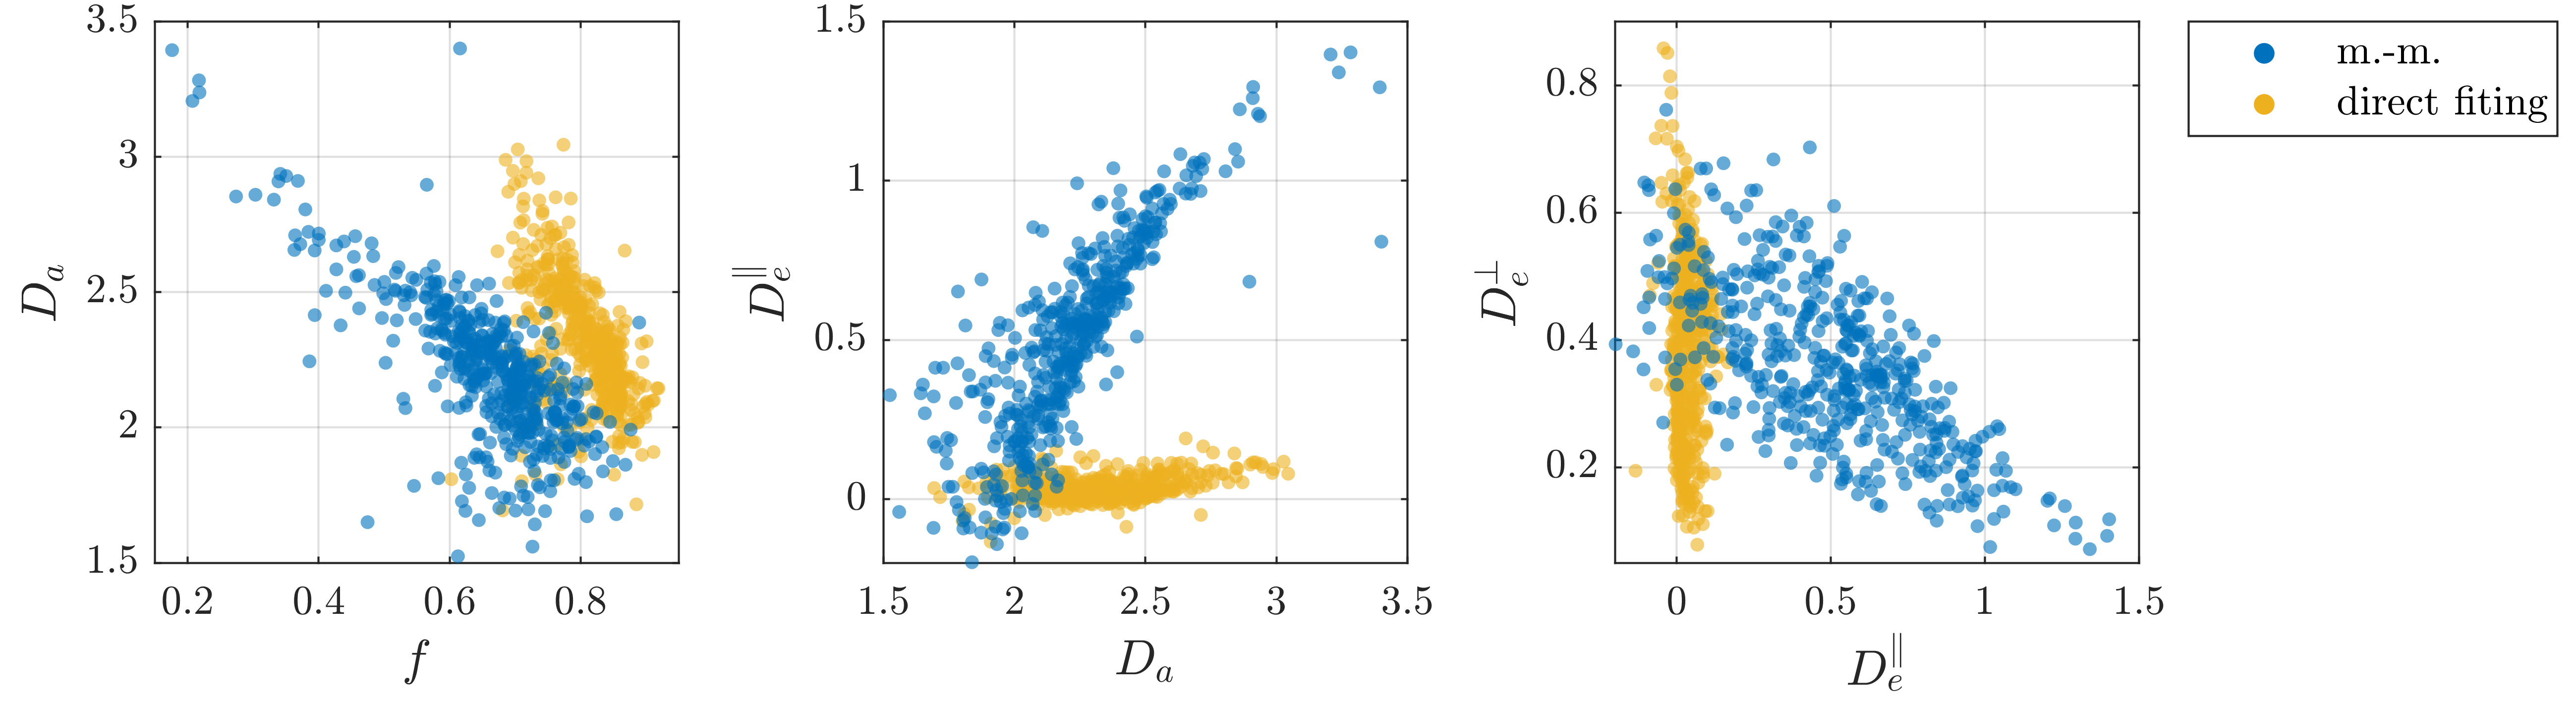
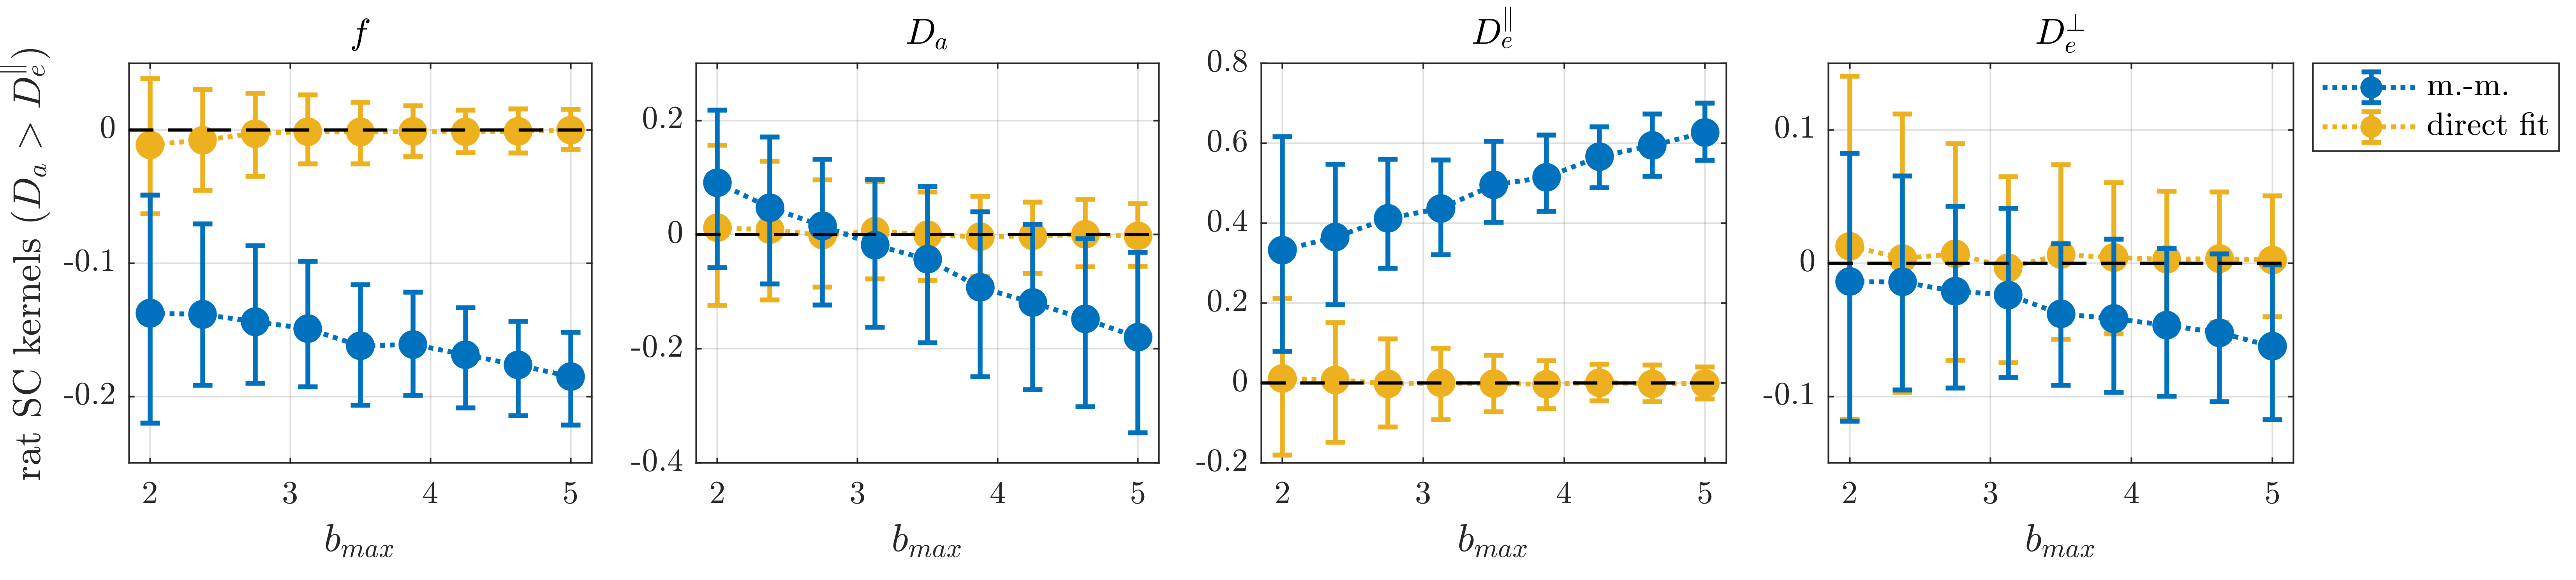
We consider WM voxels identified by having FA>0.7 (fig. 3). Figure 4 shows one branch of solutions from moment-matching for the rat spinal cord data and the corresponding group of solutions from direct fitting. Those from direct fitting are used as ground truth for simulated data in fig. 5; these results also support that moment-matching generally produces substantially biased parameter estimates – even at low diffusion weighting. Furthermore, direct fitting is found to convincingly outperform moment-matching for this type of ground truth.
Conclusion
Using simulated data generated from two examples of SM parameters as well as a realistic distribution of parameters obtained from direct fitting to an extensive dataset, SM parameter estimation based on moment-matching has been demonstrated to suffer from substantial bias even at low diffusion weighting.Acknowledgements
No acknowledgement found.References
[1] D. S. Novikov et. al.: “Quantifying brain microstructure with diffusion MRI: Theory and parameter estimation”, NMR in Biomedicine (2018).
[2] I. O. Jelescu et. al.: “Degeneracy in model parameter estimation for multi-compartmental diffusion in neuronal tissue”, NMR in Biomedicine 29 (2015)
[3] D. S. Novikov et. al.: “Rotationally invariant mapping of scalar and orientational metrics of neuronal microstructure with diffusion mri”, NeuroImage 174 (2018)
[4] J. H. Jensen et. al.: “Diffusional kurtosis imaging: the quantification of non-gaussian water diffusion by means of magnetic resonance imaging”, Magnetic Resonance in Medicine 53 (2005)
[5] E. Fieremans et. al.: “White matter characterization with diffusional kurtosis imaging”, NeuroImage 58 (2011)
[6] S. N. Jespersen et. al.: “Diffusion time dependence of microstructural parameters in fixed spinal cord”, NeuroImage 182 (2018)
[7] A. Chuhutin et. al.: “Precision and accuracy of diffusion kurtosis estimation and the influence of b‐value selection”, NMR in Biomedicine 30 (2017)
[8] B. Hansen et. al: “Fast imaging of mean, axial and radial diffusion kurtosis”, NeuroImage 142 (2016)
[9] V. Lebedev et. al: “A quadrature formula for the sphere of the 131st algebraic order of accuracy”, Doklady Mathematics 59 (1999)
[10] D. Nunes et. al.: “Mapping axonal density and average diameter using non-monotonic time-dependent gradient-echo MRI”, Journal of Magnetic Resonance 277 (2017)
[11] J. Veraart et. al.: “Denoising of diffusion MRI using random matrix theory”, NeuroImage 142 (2016)
[12] C. G. Koay et. al.: “Analytically exact correction scheme for signal extraction from noisy magnitude MR signals”, Journal of Magnetic Resonance 179 (2006)
[13] E. Kellner et. al.: “Gibbs-ringing artifact removal based on local subvoxel-shifts”, Magnetic Resonance in Medicine 76 (2016)
Figures