3605
High B-value In-vivo DTI for Early Detection of Cerebral Microstructure Alteration: Application to Hippocampus Lesions in a Mouse Model of Multiple Sclerosis1INCIA, Université de Bordeaux, CNRS, Bordeaux, France, Metropolitan, 2Neurocentre Magendie, INSERM, U1215, Bordeaux, France, Metropolitan, 3CHU de Bordeaux, Bordeaux, France, Metropolitan, 4Institut des sciences cognitives Marc Jeannerod, UMR 5229, CNRS-université Lyon1, Bron, France, Metropolitan
Synopsis
Few reports have highlighted the value of DTI achieved with a strong water-diffusion weighting to capture early and diffuse changes in cerebral microstructure of the white-matter. This study investigates the benefit of DTI with b-value=2700s/mm² to detect microstructure lesions of the hippocampus in a mouse model of multi-sclerosis. High b-value DTI allowed to detect microstructure changes invisible using DTI achieved with classical b-value=1000s/mm². In grey-matter tissues with complex architecture such as hippocampus, an increase of b-value appeared to be more relevant to monitor the microstructure changes compared to an increase of the number of diffusion directions.
INTRODUCTION
Diffusion Tensor Imaging (DTI) achieved with a
strong water-diffusion weighting using high b-values provides a
substantial gain to investigate a large panel of cerebral diseases
producing focal lesions such as stroke1,2,3,
oligo-astrocytomes1
Wallerian degenerations3,
encephalopathies4
and gliomas3.
Few reports have highlighted the value of DTI achieved with a strong
water-diffusion weighting to capture light and diffuse changes in the
White-Matter (WM) microstructure due to pathological conditions, such
as schizophrenia5
and WM demyelination6,
or to physiological conditions such as brain maturation7. The aim of the present work is to investigate the
capacity of DTI with strong water-diffusion weighting
(b-value=2700s/mm²)
to detect early and diffuse cerebral microstructure lesions of
Grey-Matter (GM) in an Experimental Autoimmune Encephalomyelitis
(EAE)8
mouse model. More precisely, the aim of this study is to determine
if the increase of b-factor and/or of number of water-diffusion
directions enhances the capacity of DTI to reveal early
microstructural lesions in the hippocampus layers of a mouse model.MATERIALS & METHODS
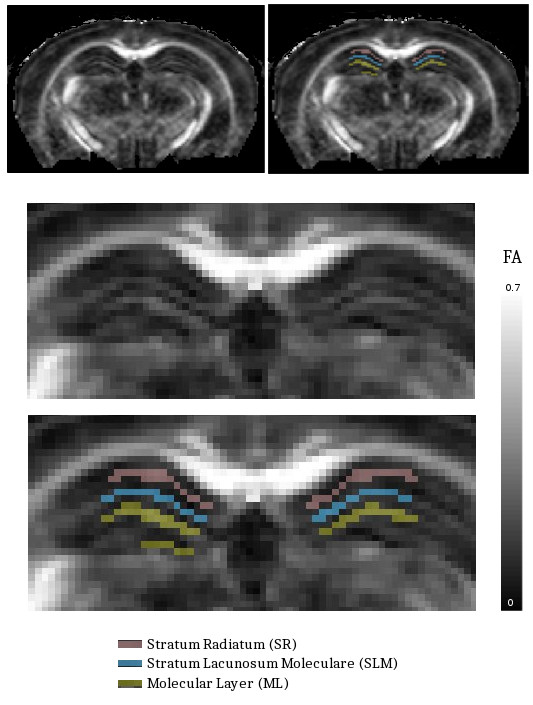
A dMRI pulse sequence with a three-dimensional Multi-Shot Echo Planar imaging (3D-msEPI) sampling of the Fourier-space has been used in this study to collect high-resolution / artefact-free dMRI data with a high b-factor. Diffusion-Weighted (DW) images of mouse brain, with an in-plane spatial-resolution of 82×81 µm², a slice thickness of 200 µm and with b-values of 1000 and 2700 s/mm², were achieved at 4.7T. Experiments were performed in 15 mice with EAE versus 15 controls. For DW- imaging, 22 different water-diffusion directions were first encoded with (b=1000s/mm², and then with b=2700s/mm²). Furthermore, 43 complementary water-diffusion directions were encoded with b=2700s/mm². DW-images were eddy-current corrected and modeled using FSL’s diffusion tool (FDT). Original and eddy-current corrected DW-images were checked slice by slice to detect magnetic susceptibility and EPI ghosting artifacts. Residuals of the DTI fit (SSR) were also controlled. High-quality diffusion tensor maps (Fractional Anisotropy (FA), Axial diffusivity (AD)=L1, Radial Diffusivity (RD)=(L2+L3)/2, and Mean Diffusivity (MD) maps) were obtained for each of three DTI data-sets (the b1000#22dir dataset obtained with b=1000s/mm² and 22 diffusion directions, the b2700#22dir dataset obtained with b=27000s/mm² and 22 diffusion directions and the b2700#43dir dataset obtained with b=2700s/mm2 and 43 diffusion directions). Absolute values of differences between DTI maps (|ΔFA|, |ΔL1|, |ΔL2|, |ΔL3|, |ΔMD|) of the three data-sets were computed. Using RD and FA maps, volumes of interest (VOIs) were drawn within the molecular layer (ML) of the dentate gyrus on 3 consecutive slices covering the dorsal part of the hippocampus9 (Fig.1). Quantitative DTI data measured for each VOI were presented as mean±SD. Comparison between the EAE and the CTL groups were performed with a bilateral and homoscedastic Student’s t-test. Significance levels distinguished were P<0.05 (*), P<0.03 (**) et P<0.02 (***), NS (not significant).
RESULTS
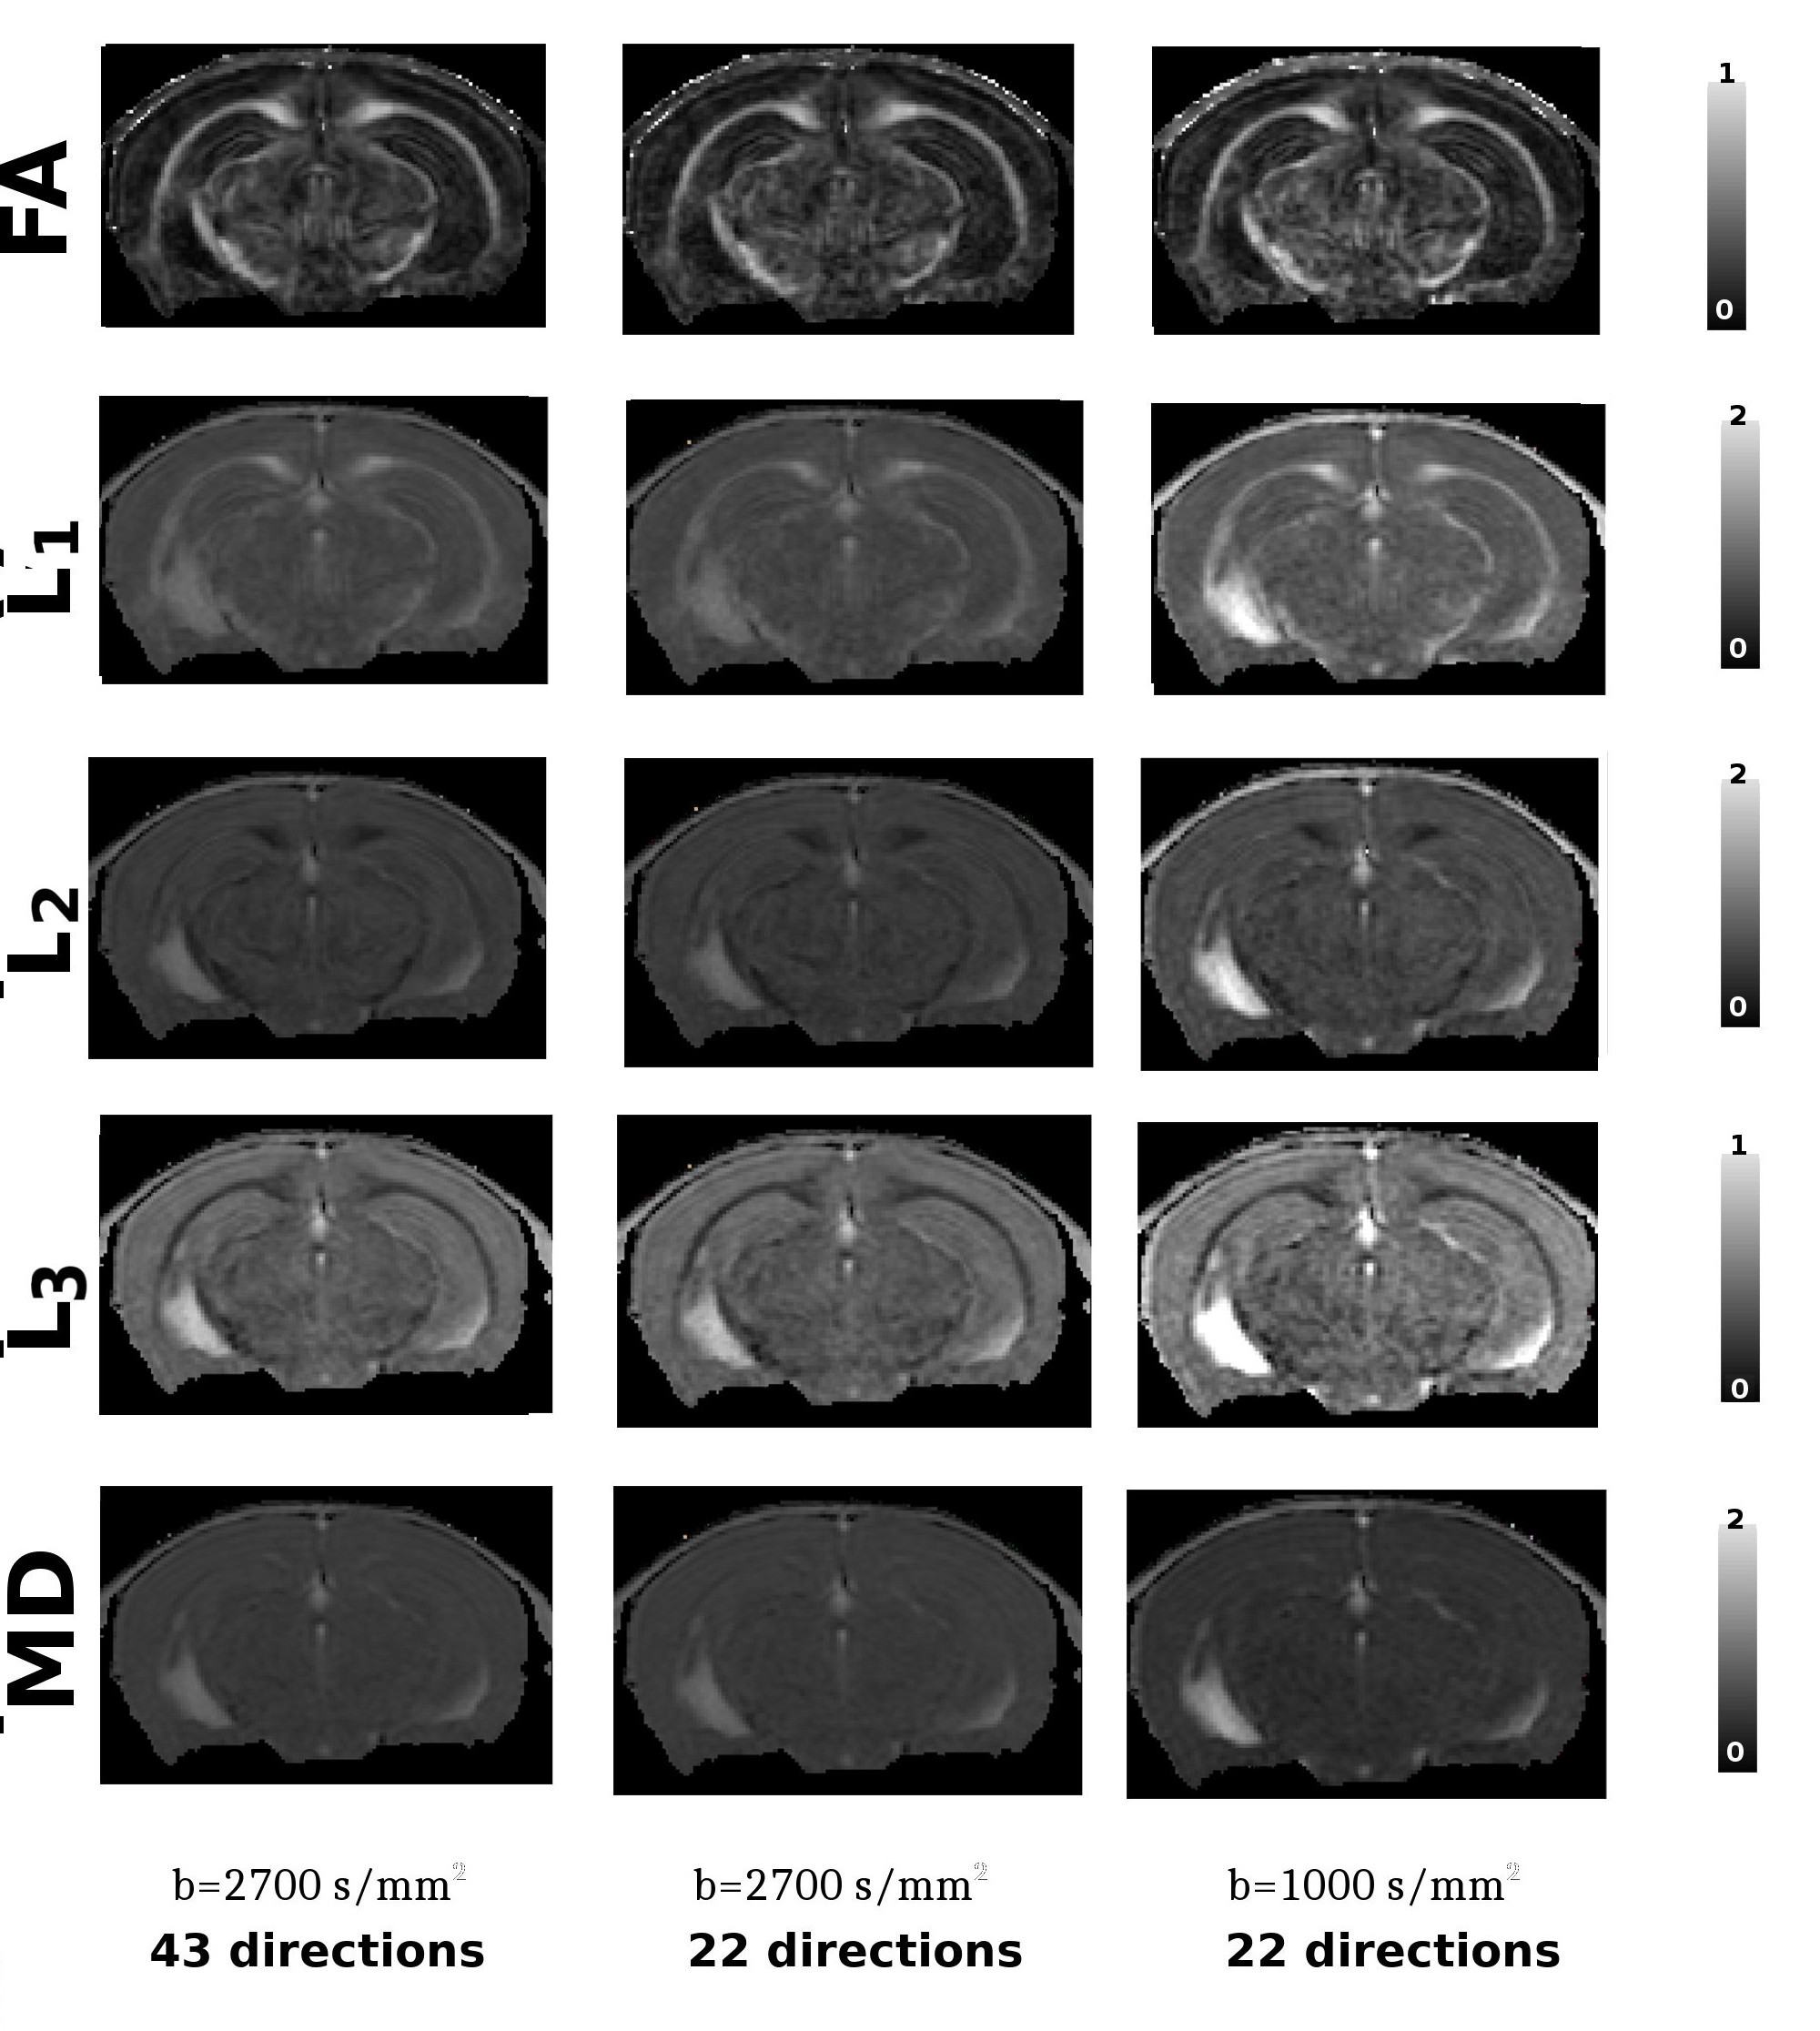
The 3D-msEPI dMRI pulse
sequence provided high quality DTI maps for b=1000 s/mm² and b=2700
s/mm² (Fig.2).
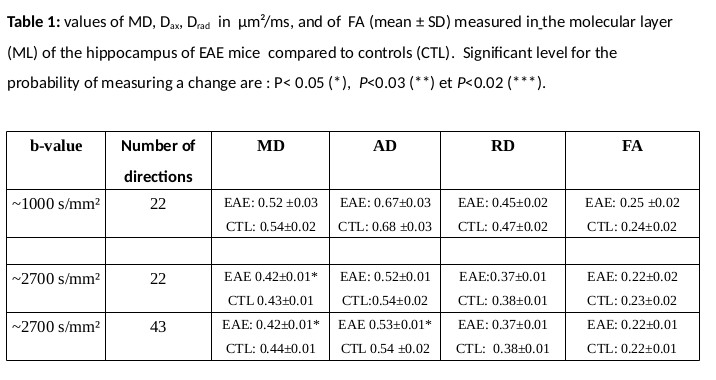
For the b=2700#dir43 dataset, the effect of EAE in
the molecular layer was detected with a significance of P<0.05 by
a decrease in both MD and RD (Table.1). For the b=2700#dir22 dataset,
only the MD parameter enabled to discriminate EAE and control groups
(P<0.05) (Table1). Comparatively the b=1000#dir22 dataset didn’t
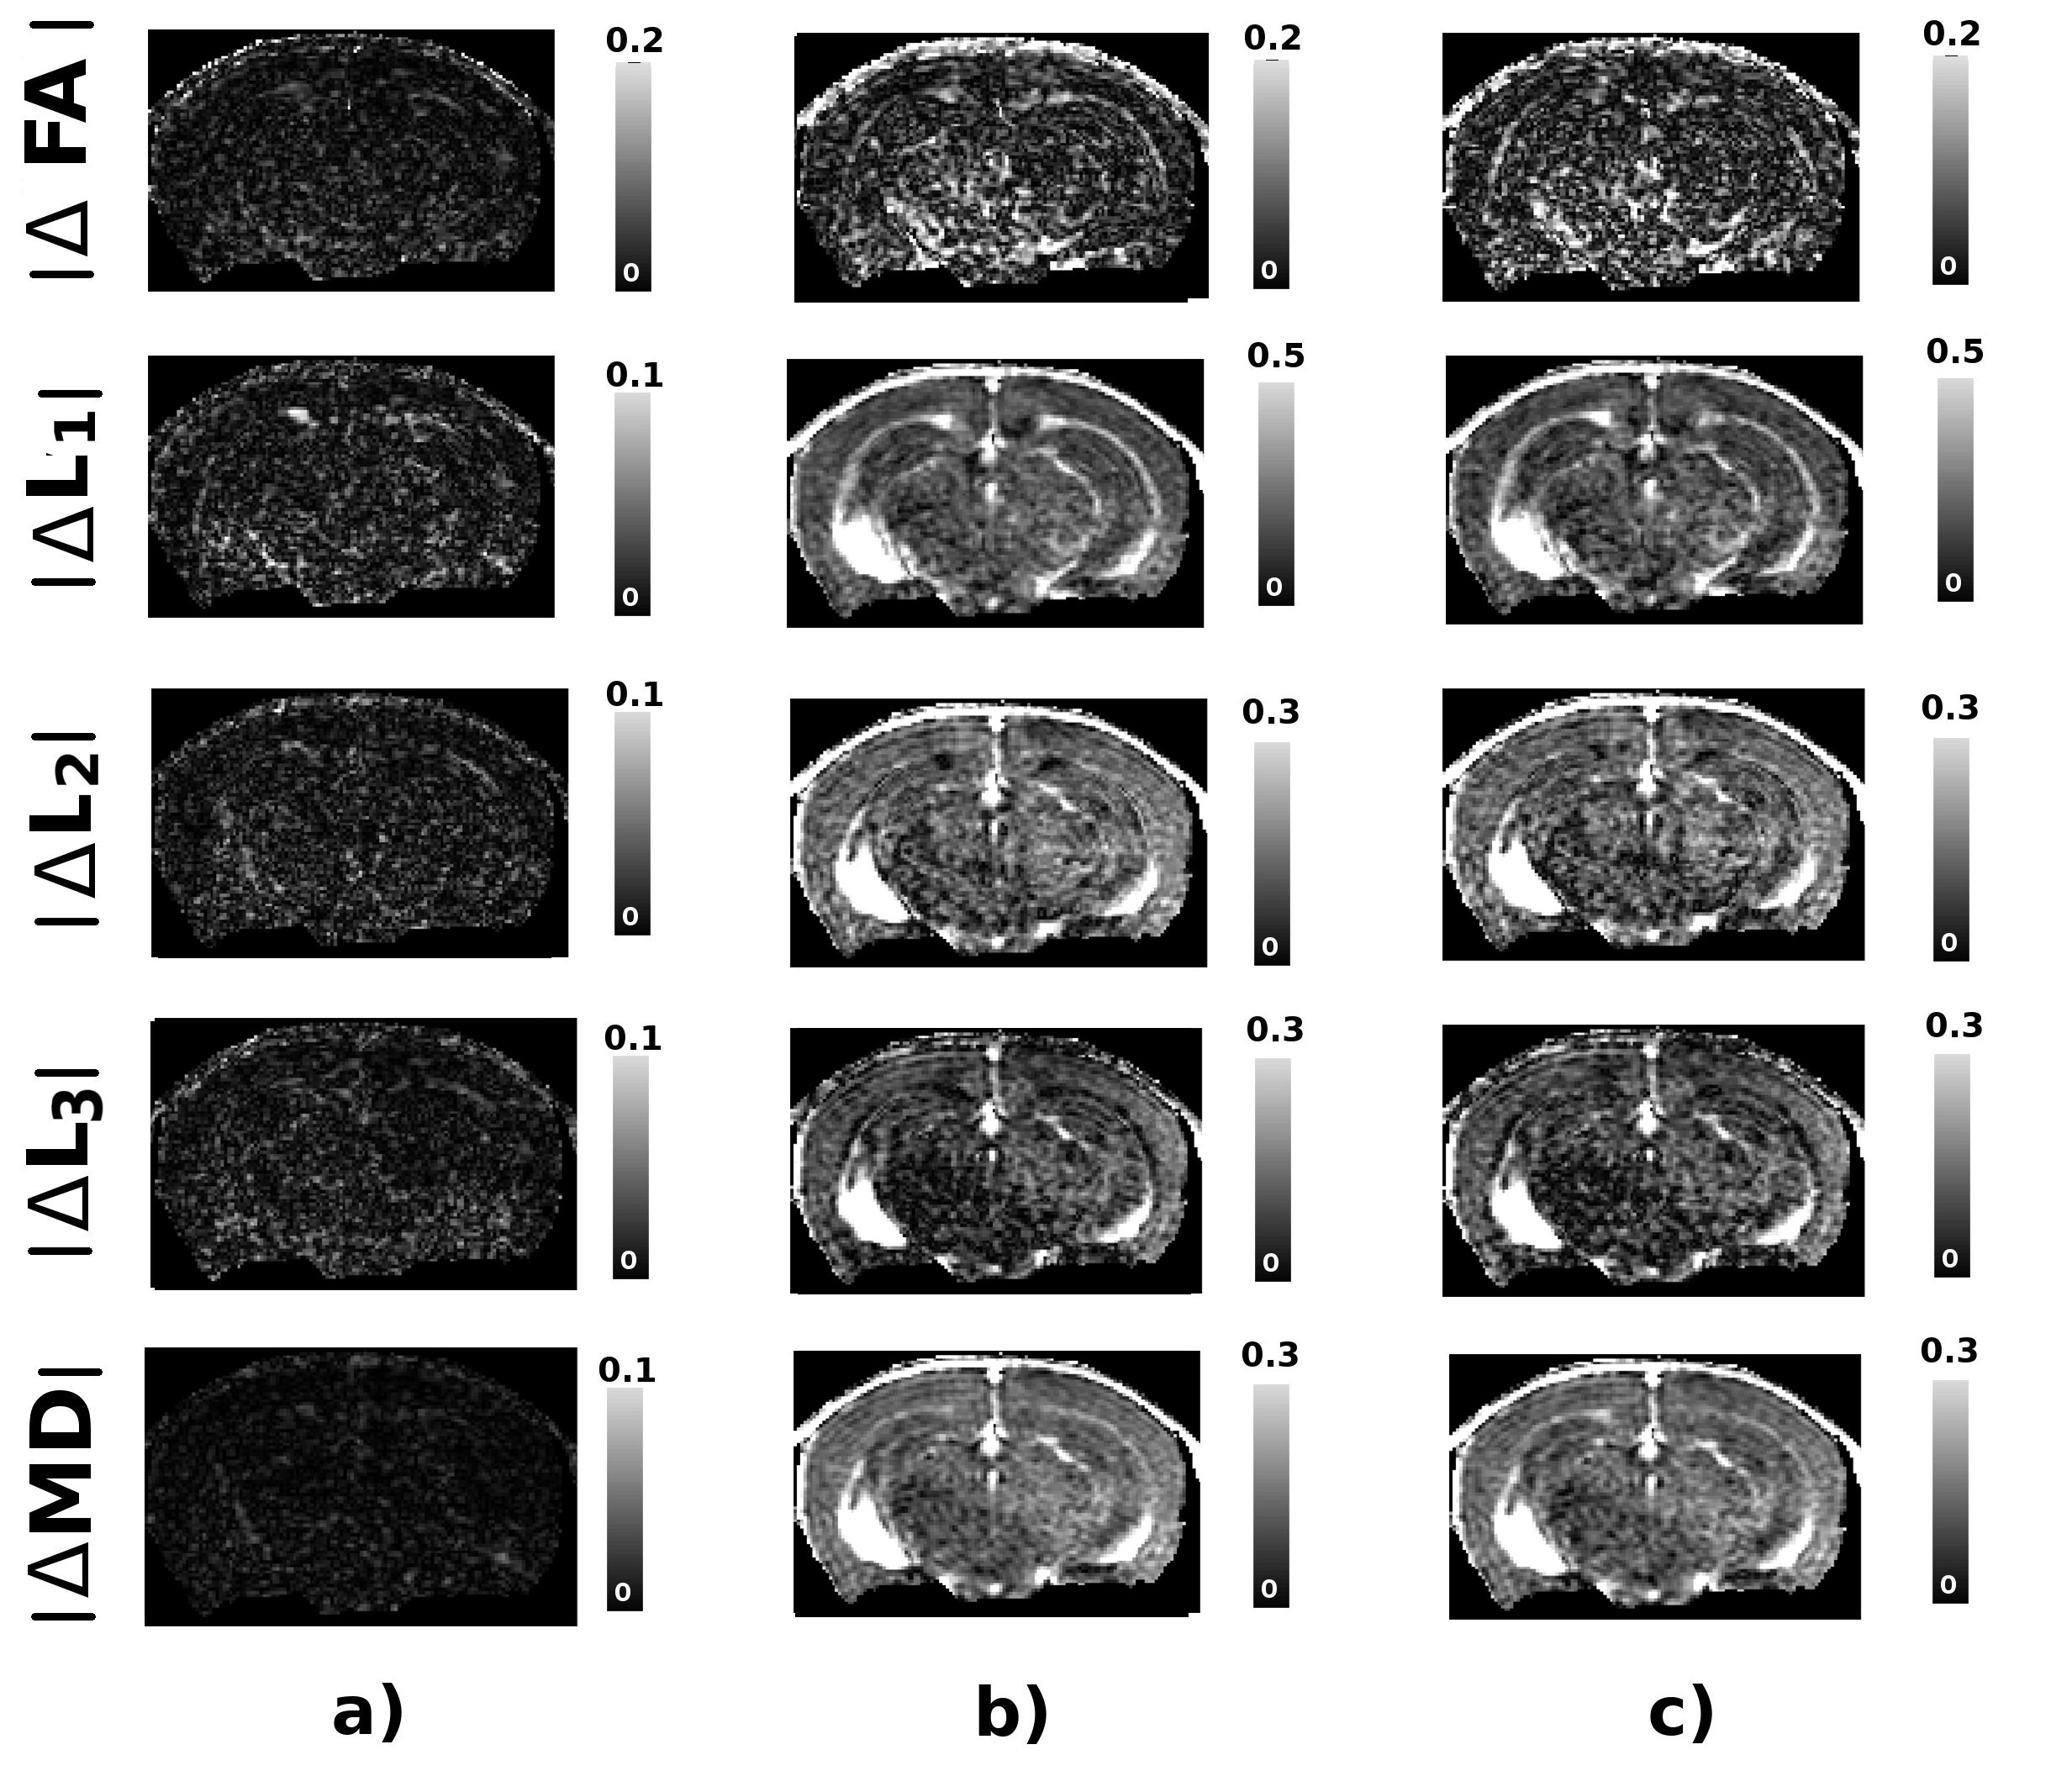
allow to detect any effects of EAE in the ML.There were no detectable changes in other hippocampus layers SR and SLM. Fig. 3a shows a weak difference between DTI maps
obtained from the b=2700#dir43 and b=2700#dir22 datasets. The
increase of b-value from b=1000s/mm² to b=2700s/mm² leads to a
decrease in AD, RD and MD (Fig. 2, Fig.3b/3c). FA were almost not affected by the increase in the b-value (Table 1, Fig. 2, Fig. 3).
DISCUSSION
The 3D-msEPI dMRI pulse sequence could be used to achieve high resolution/quality DW-images with a strong water-diffusion weighting10. EAE8 is a model of multiple sclerosis. In this model, dendritic alterations (reduction of dendritic length and of dendritic intersections) in the molecular layer of the dentate gyrus, but not in other hippocampus subfields, have previously been described and correlated to the decrease of MD and AD by our group9. This study demonstrates the benefits of using high b-value dMRI to reveal early and diffuse lesions of cerebral GM caused by physio-pathological processes. The AD estimation seems to depend more on the number of water diffusion directions encoded to reconstruct DTI than the MD (Fig. 3).CONCLUSION
The effect of increasing b-value on DTI maps was
described. High b-value DTI allowed to
detect cerebral microstructure changes invisible using DTI achieved
with classical b-value of 1000 s/mm². In
GM tissues with complex architecture such as hippocampus, an increase
of b-value appeared to be more relevant to monitor microstructure
changes compared to an increase of the number of diffusion
directions.Acknowledgements
No acknowledgement found.References
1Peled S, Whalen S, Jolesz FA, Golby AJ. High B‐value apparent diffusion‐weighted images from CURVE‐ball DTI. Journal of Magnetic Resonance Imaging 2009; 30(1), 243-248.
2Grinberg F, Farrher E, Ciobanu L et al. Non-Gaussian diffusion imaging for enhanced contrast of brain tissue affected by ischaemic stroke. PloSOne. 2014; 9 :doi:10.1371/journal.pone.0089225 :doi:10.1371/journal.pone.0089225
3 Dudink J, Larkman DJ, Kapellou O et al. High b-value diffusion tensor imaging of the neonatal brain at 3T.AJNR Am J Neuroradiol. 2008; 29(10):1966-72.
4Tachibana Y, Aida N, Niwa T et al. Analysis of multiple b-Value diffusion-weighted imaging in pediatric acute encephalopathy. PLoS ONE. 2013;8(6):e63869. doi:10.1371/journal.pone.0063869.
5Baumann PS, Cammoun L, Conus P et al. High b-value diffusion-weighted imaging: a sensitive method to reveal white matter differences in schizophrenia. Psychiatry Research: Neuroimaging. 2012 ; 201(2), 144-151.
6Wu Y-C, Field AS, Duncan ID et al. High b-value and diffusion tensor imaging in a canine model of dysmyelination and brain maturation. NeuroImage. 2011; 58(3):829-837.
7Hui ES, Cheung MM, Chan KC, Wu EX. b-value dependence of DTI quantitation and sensitivity in detecting neural tissue changes. Neuroimage. 2010 ; 1;49(3):2366-74.
8‘t Hart BA, Gran B., Weissert R. EAE: imperfect but useful models of multiple sclerosis. Trends Mol Med , 2011; 17: 119-125.
9Crombe A, Planche V, Raffard G,et al.. Deciphering the microstructure of hippocampal subfields with in vivo DTI and NODDI: Applications to experimental multiple sclerosis. NeuroImage,2018; 172: 357-368
10Tounekti S, Troalen T, Bihan-Poudec Y et al. High-resolution 3D diffusion tensor MRI of anesthetized rhesus macaque brain at 3T.Neuroimage. 2018;181:149-161.
Figures