3602
Diffusion Weighted MRI Characterization of Effects of Sex and APOE Genotype in a Mouse Model1Biomedical Engineering, University of Arizona, Tucson, AZ, United States, 2Department of Clinical Therapeutics, USC School of Pharmacy, University of Southern California, Los Angeles, CA, United States, 3Center for Innovation in Brain Science, University of Arizona, Tucson, AZ, United States, 4Department of Pharmacology, University of Arizona, Tucson, AZ, United States
Synopsis
Structural and diffusion MRI (dMRI) analyses can be used to characterize neurodegeneration during Alzheimer’s disease progression. Male and female mice with a targeted replacement of mouse APOE gene with humanized APOEε3 or APOEε4, underwent behavioral, transcriptomic and imaging analyses. Postmortem MRI of fixed brains included high resolution T2-weighted and diffusion weighted imaging. Structural volume assessment revealed that APOE genotype and sex have a significant impact on regional brain volumes. dMRI quantified white matter microstructural differences between APOEε3 or APOEε4 females/males which maybe cross-validated with transcriptomic and behavioral findings. Further confirmation of microstructural assessment is pending by electron micrographs.
Introduction
The Apolipoprotein E (ApoE) protein is integral for lipid shuttling and is majorly expressed by astrocytes and microglia in the brain. There are three isoforms of the APOE gene: of which, APOEε3 allele is the most frequent while, APOEε4 allele is a major risk factor for Alzheimer’s Disease (AD). The purpose of the study was to use magnetic resonance imaging (MRI) to characterize sex and genotype effects in a mouse model with a targeted replacement of human APOEε3 or APOEε4 using volumetric and diffusion magnetic resonance imaging (dMRI) measures, and cross-validate imaging with cognition and transcriptomic data.Methods
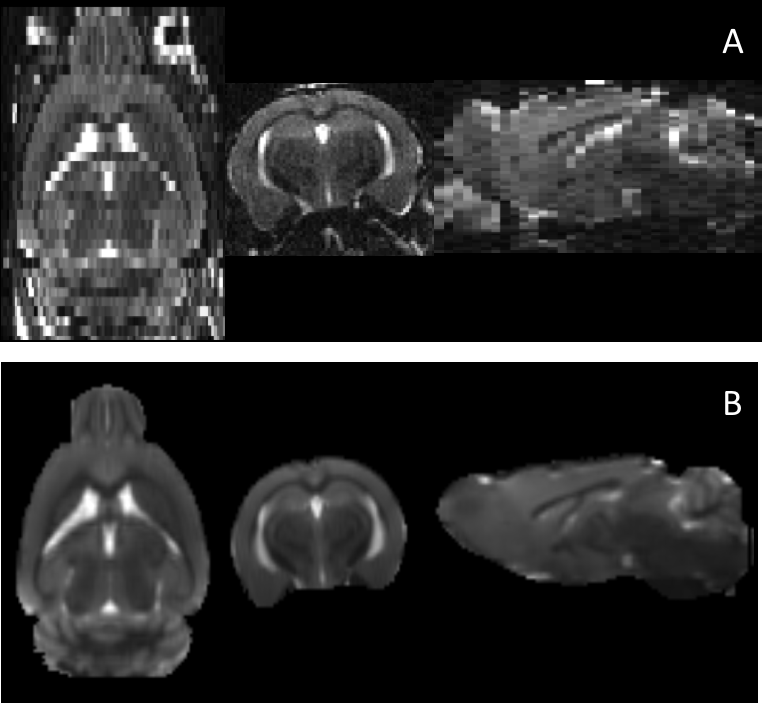
Male and female mice (C57BL/6, n=11, 16 months) with a targeted replacement of the mouse APOE gene with either humanized APOEε3 or APOEε4 allele underwent novel object recognition test to assess cognitive function and hippocampal transcriptomics. Animals were euthanized and perfused with Trump’s fixative. Following perfusion, intact skulls containing the fixed brains were imaged using a 7T Bruker Biospec MRI scanner. Imaging included high-resolution 3D T2-weighted imaging with TR/TE=1500/10ms, RARE factor=8, and 75µm isotropic resolution. Additionally, 3 sets of diffusion-weighted MRI (dMRI) were collected using 8-shot echo planar imaging with 32 directions and a diffusion weighting of b=1000s/mm2 with 4 b=0s/mm2 images, in plane resolution of 150x150µm, and slice thickness of 450µm. Each of the three dMRI sets were shifted by 150µm in the slice select direction, resulting in partial overlap with the other dMRI sets, for use in super resolution reconstruction described below.
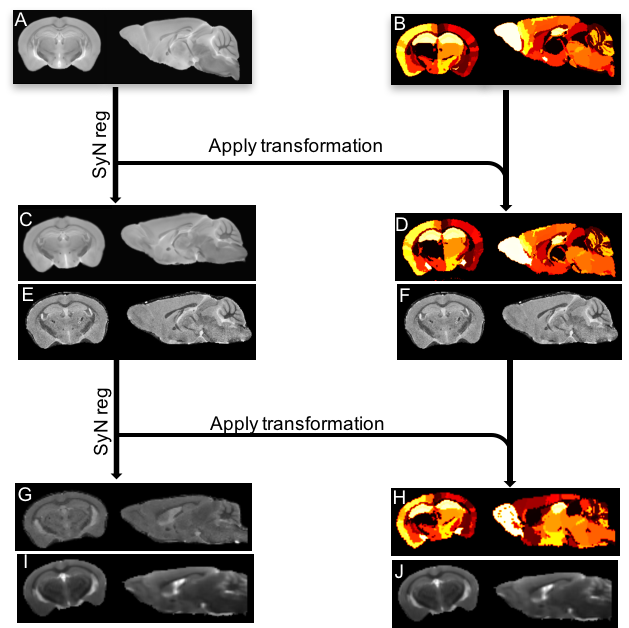
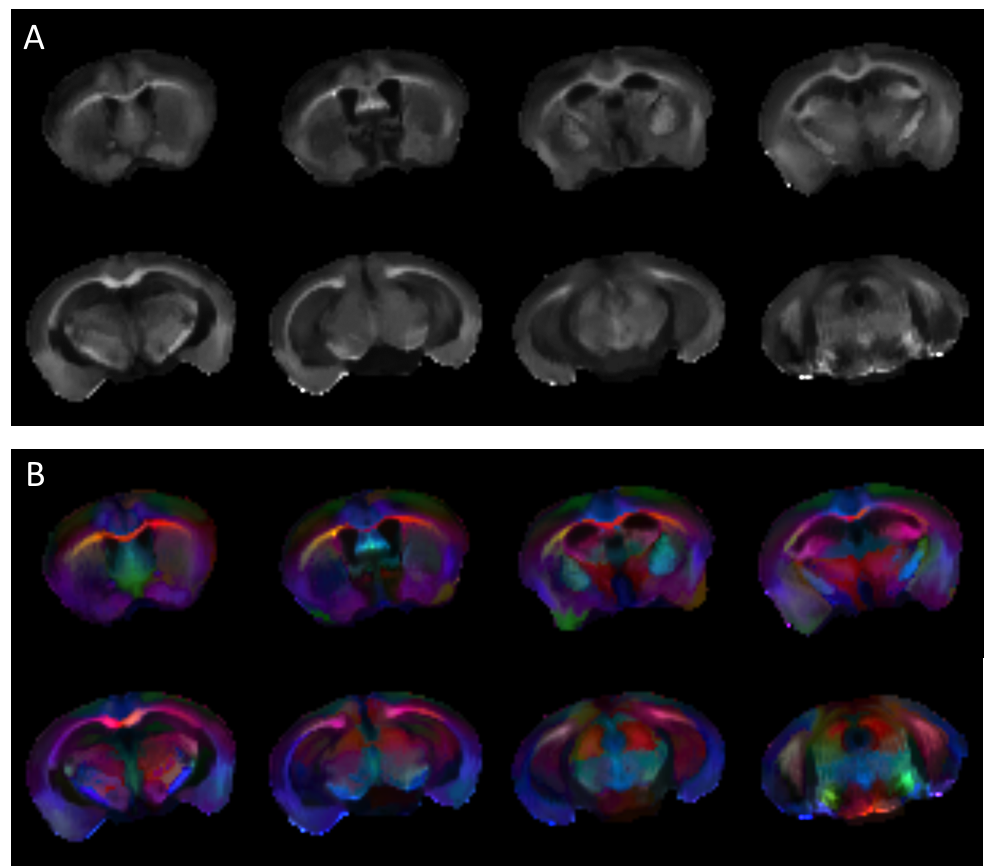
Image Analysis- The high-resolution structural MRI images were semi-automatically brain extracted using MRIcron and Mango programs and bias field-corrected using N4 implemented in ANTs. The data was further analyzed by registering a T2-weighted reference image and atlas with 356 regions of interest (ROIs)1 to each animal using the SyN algorithm in ANTs. Volumes of 30 specific regions of the brain were compared across the 4 groups (male and female; ApoEε3 and ApoEε4) using multiple t-tests. Low-resolution, dMRI images were motion and eddy-current corrected using FSL’s eddy-correct2 and denoised using a diffusion-matched principal component analysis technique3. Subsequently, the three low resolution datasets were reconstructed using in-house super-resolution reconstruction software, written in Julia, to generate 150µm isotropic dMRI data (Figure 1). The brain was then semi-automatically extracted from non-brain tissue, bias field corrected and run through a two-step SyN registration performed in ANTs to create a labeled atlas in individual diffusion space (Figure 2). The high-resolution dMRI data were then fit to the diffusion tensor imaging (DTI) model using weighted linear least squares4. From the DTI, fractional anisotropy (FA) was calculated on a voxel-by-voxel basis using in-house Python code and directionally encoded color maps were generated (Figure 3). Parameter maps were analyzed by registering the mouse atlas to each individual brain, and then comparing the mean value of the top quartile of FA in white matter ROIs.
Results
Total brain volumes showed no significant sex or genotype effect. With respect to grey matter volumes, sex had a significant effect where genotype had minimal effect. On pairwise comparison, APOEε3 females trended to have significantly larger cortical regions (frontal, occipital and parietal-temporal lobe), entorhinal cortex, hypothalamus and thalamus. Interestingly, white matter areas trended to be larger in the APOEε4 animals, and the effect was significant in males. Sexual dimorphism in white matter tracts was only observed in APOEε3 animals, with the females having larger white matter volumes than the males. Assessment of FA revealed that APOEε3 males had significantly higher FA in several white matter tracts, while APOEε4 females trended to have lower FA values in the group comparison. Cognitive studies indicate that APOEε3 males have higher discrimination on a novel object recognition task compared with APOEε4 females and males. Hippocampal transcriptomic data suggests that APOEε4 animals have reduced oxidative phosphorylation in comparison to their sex-matched APOEε3 controls. However, only APOEε4 females showed a coincident increase in inflammation and ketogenesis.Discussion
Structural volume assessment revealed that APOE genotype as well as sex has significant impact on regional brain volumes. The lower FA values in APOEε4 males and females could indicate changes in white matter microstructure compared to their sex matched APOEε3 counterparts. Evidence from cognitive studies indicate that APOEε3 males and females have higher discrimination for novel objects. Hippocampal transcriptomic pathway analysis suggest that APOEε4 animals have reduced oxidative phosphorylation. APOEε4 females also show an activation of ketogenesis and neuroinflammation indicating bioenergetic shift in fuel utilization, from glucose to fatty acids derived from white matter catabolism5. Electron micrographs are currently underway to visualize the myelin and axonal ultrastructure to further confirm dMRI results.Acknowledgements
This work was supported by NIA P01AG026572, Alzheimer’s Association SAGA-17-419459 and Arizona Alzheimer’s Consortium to RDB.References
1. Steadman P, Ellegood J, Szulc K, et al Genetic Effects on Cerebellar Structure Across Mouse Models of Autism Using a Magnetic Resonance Imaging Atlas. Autism Res. 2014 7(1): 124–137.
2. M. Jenkinson, C.F. Beckmann, T.E. Behrens, et al. FSL. NeuroImage, 62:782-90, 2012
3. Chen NK, Chang HC, Bilgin A, Bernstein A, Trouard TP. A diffusion-matched principal component analysis (DM-PCA) based two-channel denoising procedure for high-resolution diffusion-weighted MRI. PLoS One. 2018;13(4):e0195952.
4. Basser PJ, Mattiello J, LeBihan D. MR diffusion tensor spectroscopy and imaging. Biophys J. 1994; 66(1):259-67.
5. Klosinski LP, Yao J, Yin F. White Matter Lipids as a Ketogenic Fuel Supply in Aging Female Brain: Implications for Alzheimer's Disease EBioMedicine. 2015; 2(12): 1888–1904.
Figures