3601
Free Water Characterization of Peritumoral Regions in Primary and Secondary Brain Neoplasms1Penn Patho-Connectomics Lab, Radiology, University of Pennsylvania, Philadelphia, PA, United States, 2Synaptive Medical, Victoria, BC, Canada, 3Neurosurgical Oncology, University of Pennsylvania, Philadelphia, PA, United States
Synopsis
There is a growing interest in characterizing the peritumoral regions in neoplasms, in order to distinguish primary and secondary neoplasms, improve tractography for surgical planning, and create radiomic markers of infiltration. Free water estimation is expected to reflect the differences in water content of the peritumoral region between these tumor types. In this work, we compare glioblastoma (primary) and metastatic (secondary) tumors based on their free water estimated using standard clinical diffusion MRI (dMRI). Results demonstrate significant difference in these tumor types based on the free water measures, fractional anisotropy post-correction and the coverage of the peritumoral region by tractography.
INTRODUCTION
Since pathophysiological processes vary depending on the origin of neoplasms, the characteristics of their peritumoral regions are expected to differ. Extracellular free water (FW) is a product of various pathophysiological processes including the impairment of ATP-dependent sodium pumps, obstruction, and change in pressure and osmotic gradients1. The tensor properties in voxels contaminated by FW are misleading, and do not correspond to the underlying tissue properties, rendering the non-invasive investigation of the pathological properties further challenging. We hypothesize that the FW content as estimated by free water elimination, its extent of correction on fractional anisotropy (FA) and increased volume of tractography in the peritumoral region should be able to elucidate patterns of edema and infiltration that distinguish primary and secondary neoplasms. In this work, we use FW content, corrected FA and tracking coverage after FWE to distinguish between glioblastoma multiforme (GBM) and metastatic (Mets) tumors.METHODS
a- Datasets and preprocessing: Data from 88 GBM and 50 Met patients were selected for this study. All patients underwent 30 direction DWI (TR/TE= 5000/86ms, b = 1000s/mm2, 3 b0), T1, T1 post-contrast, T2 and FLAIR MRI acquisitions. DTI preprocessing steps included denoising, motion and eddy current correction, and skull-stripping; the four structural scans were each nonlinearly registered to the DTI image. Two tensor models were fitted: a standard tensor model and Fernet2, a free-water eliminated (FWE) tensor model. FW maps were obtained for every subject using Fernet.
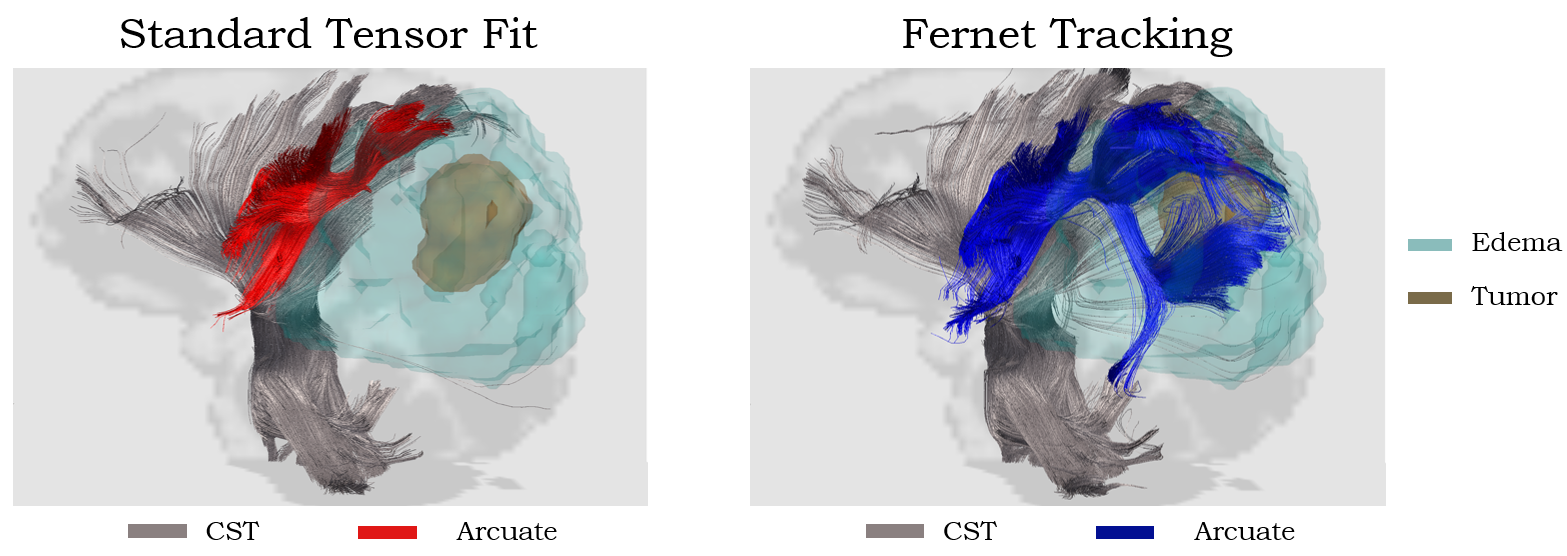
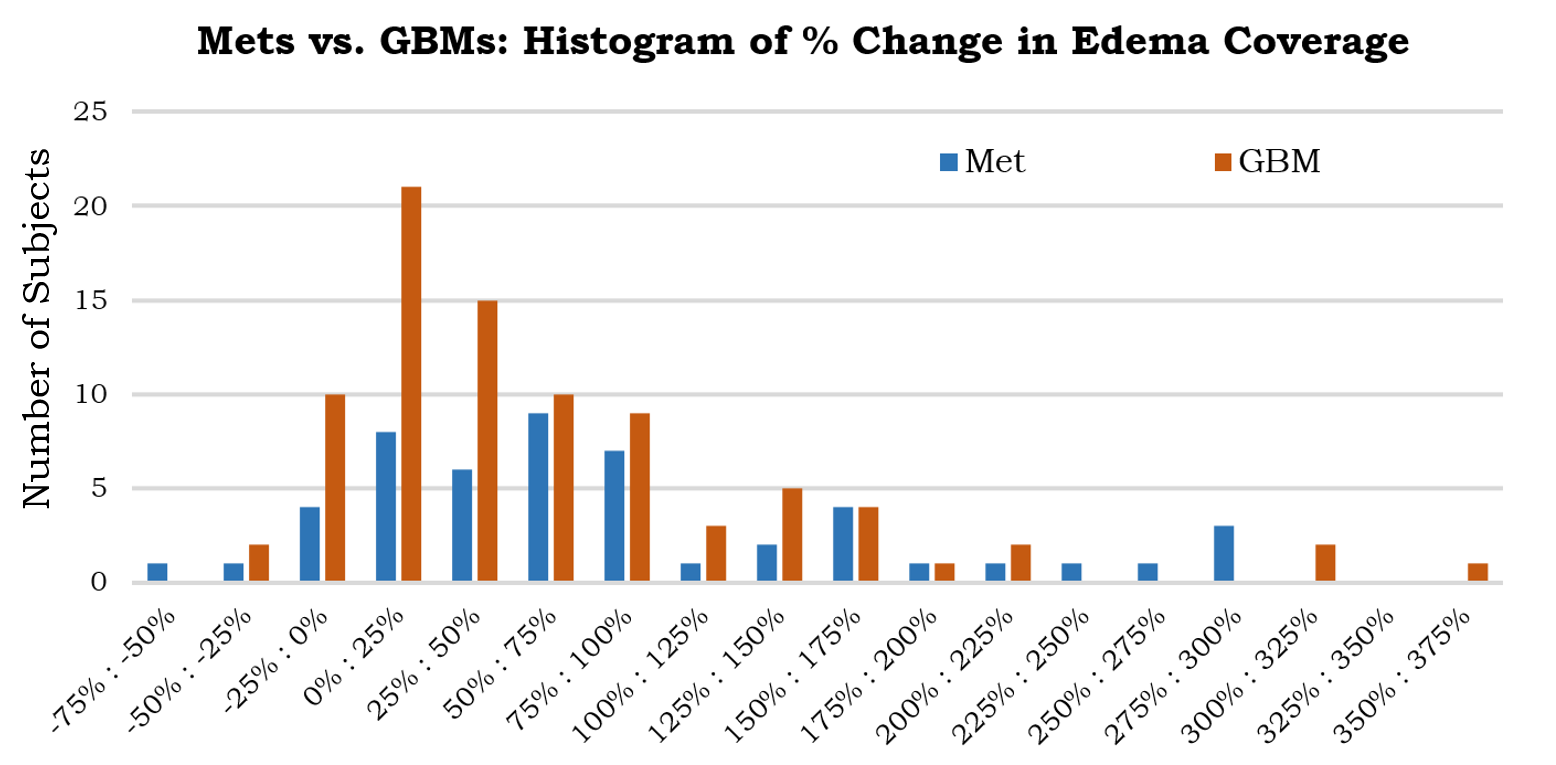
b- Tractography: Deterministic tractography was performed on each subject with Diffusion Toolkit3. Bilaterally, representations of five white-matter tracts (corticospinal tract, inferior fronto-occipital, inferior longitudinal, arcuate and uncinate fasciculi) were extracted in each patient for each tensor model using the shape-based clustering algorithm RecoBundles4. Mask of the peritumoral region was obtained using GLISTR. For each subject, the percentage change of the edema volume covered between the standard tensor and Fernet tensor models was calculated.
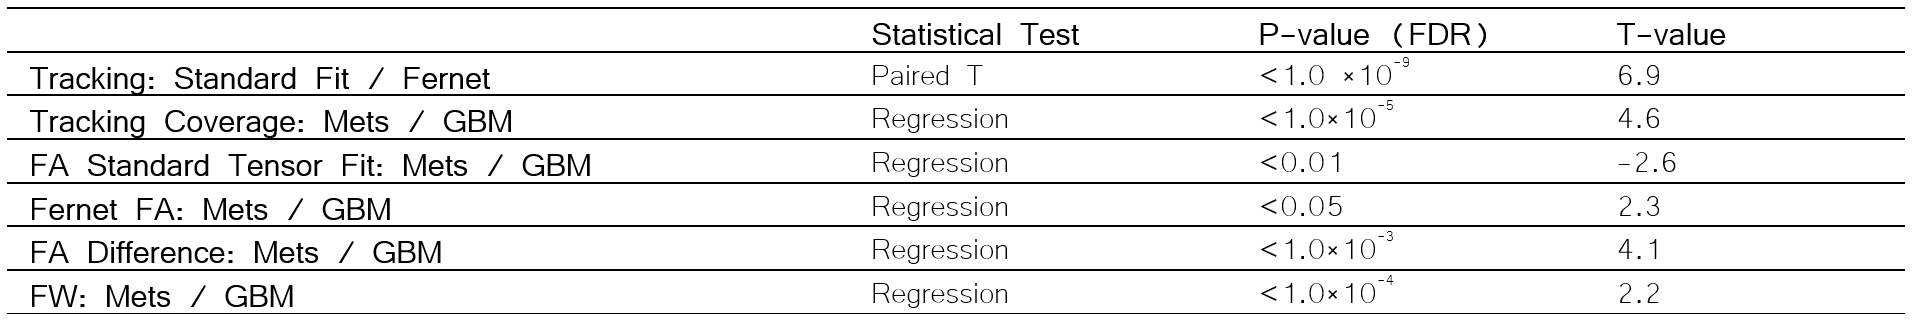
c- Statistical Analysis: A paired t-test was used to compare the tracking coverage in the peritumoral region before and after FWE. Regression analysis using age, sex, and diagnosis as covariates was employed to investigate the difference in tracking coverage, FA from standard tensor fit, Fernet FA, FA difference post FWE, and FW component in Mets and GBMs. P-values were corrected for multiple comparisons using the Benjamini-Hochberg procedure to control for false discovery rate (FDR).
RESULTS
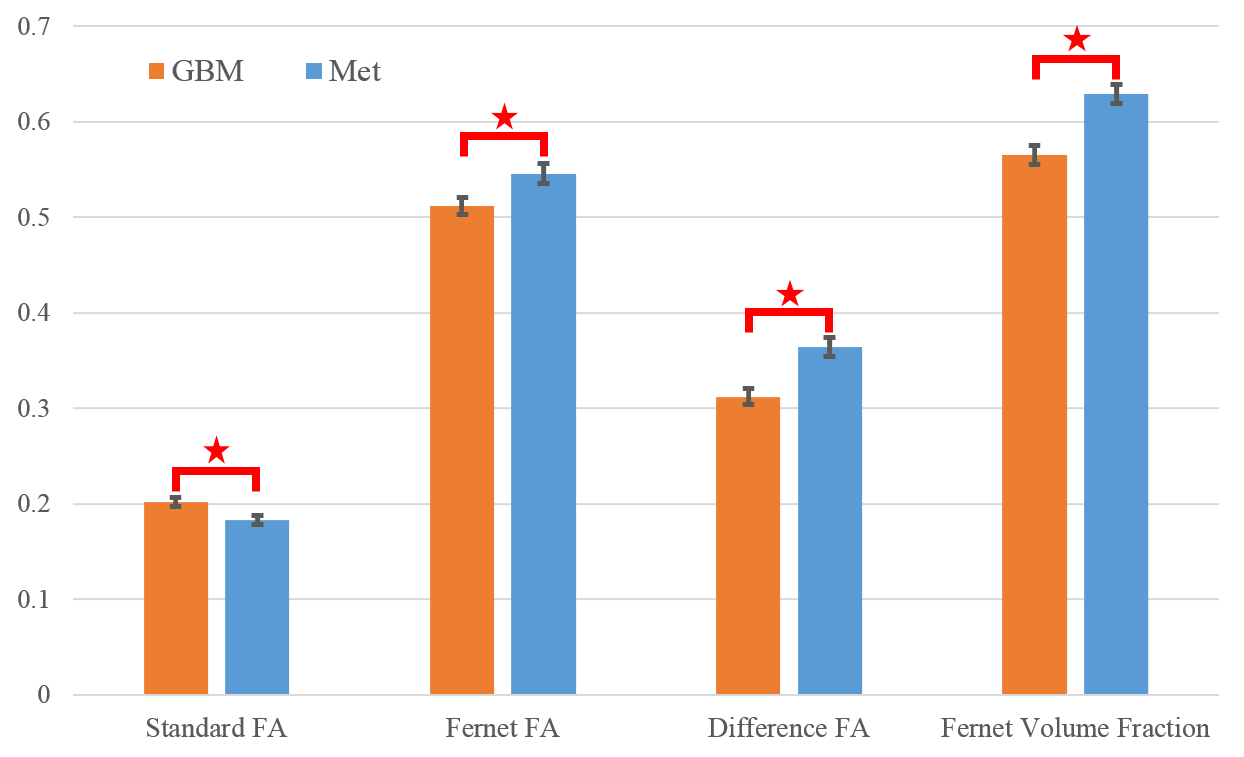
Fig.1 shows an increase in tracts covering the peritumoral region using FWE as compared to the standard tensor-based streamlines that stopped prematurely. The analysis of tractography showed a significant increase in peritumoral region coverage using FWE tractography (t=6.9, p<1×10⁻⁹) compared to standard diffusion tensor tractography (Fig.2). Regression analysis using age, sex, and diagnosis as covariates revealed that the increase in coverage was greater in patients with Mets than GBM (t=4.6, p<1×10⁻⁷) (Fig.3). The FW maps showed that mean FW volume fraction in the peritumoral region was higher in Mets (t=4.4, p<1×10⁻⁴), as seen in Fig.2 and Fig.4. Mean standard FA was significantly lower in Mets (t=-2.6, p<0.01), while mean Fernet FA was significantly higher (t=2.3, p<0.05). Finally, the difference map between FA from standard fit and Fernet show significant differences in the peritumoral area in these two tumor types (t=4.1, p<0.001).DISCUSSION
The findings of this study hold high clinical significance as they show that the change in tracking coverage, FW volume fraction and difference in FA after FWE were each sufficient to distinguish between vasogenic (secondary neoplasm) and cytotoxic edema (primary neoplasm). These findings can be explained by the decrease of the available space for FW in GBMs due to intracellular swelling following cellular necrosis5. Furthermore, the increase of tracking coverage and Fernet FA in Mets is consistent with previous reports6 that suggest that the vasogenic edema is reversible. This edema is characterized by an increase in the apparent diffusivity due to the contamination of free water, while the underlying tissue remains undamaged6. Hence, when FW was eliminated, we were able to retain a higher tracking coverage in the peritumoral region in secondary neoplasm.CONCLUSION
We have shown that free water estimation can provide three crucial markers of the peritumoral region: change in tracking coverage, FW volume fraction, and the difference in FA after FWE. This can help discriminate primary and secondary brain neoplasms. These findings are well aligned with the current state of knowledge regarding edema in brain tumors. Our investigation suggests the potential of use of these measures as radiomic markers of tumor type and infiltration, aiding in potential digital biopsy, prognosis, diagnosis and monitoring treatment.Acknowledgements
This research was supported by the National Institutes of Health (NIH) grant 1R01NS096606 (PI: Ragini Verma), and research grant from Synaptive Medical 30071788 (PI: Ragini Verma).References
1. Kaal, E. C., & Vecht, C. J. (2004). The management of brain edema in brain tumors. Current opinion in oncology, 16(6), 593-600.
2. Ould Ismail, A., Parker, D., Hernandez-Fernandez, M., Brem, S., Alexander, S., Pasternak, O., ... & Verma, R. (2018, September). Characterizing Peritumoral Tissue Using Free Water Elimination in Clinical DTI. In MICCAI Brain Lesion Workshop.
3. Wang, R., Benner, T., Sorensen, A. G., & Wedeen, V. J. (2007, May). Diffusion toolkit: a software package for diffusion imaging data processing and tractography. In Proc Intl Soc Mag Reson Med (Vol. 15, No. 3720).
4. Garyfallidis, E., Côté, M. A., Rheault, F., Sidhu, J., Hau, J., Petit, L., ... & Descoteaux, M. (2017). Recognition of white matter bundles using local and global streamline-based registration and clustering. NeuroImage.
5. Ironside JW, Pickard JD. Raised intracranial pressure, oedema and hydrocephalus. Greenfield’s Neuropathology. Seventh Edition. Graham DI, Lantos PL (Eds). New York, Arnold. 2002:193-231.
6. Mukherjee P, McKinstry RC. Reversible posterior leukoencephalopathy syndrome: evaluation with diffusion-tensor MR imaging. Radiology. 2001 ;219(3):756-65.
Figures