3599
Optimizing Imaging Protocols for Structural Connectomics in Mouse Models of Neurological ConditionsRobert J Anderson1, Christopher Long1, Evan D Calabrese2, Scott H Robertson1, Gary P Cofer1, G Allan Johnson1, and Alexandra Badea1
1Radiology, Duke University Medical Center, Durham, NC, United States, 2Department of Radiology & Biomedical Imaging, University of California San Francisco, San Francisco, CA, United States
Synopsis
Network approaches provide sensitive biomarkers for neurological conditions such as Alzheimer’s disease. Mouse models provide tools to dissect vulnerable circuits at prodromal stages, and to assess the effects of interventions. We have simulated mouse brain structural connectomes, balancing angular, spatial resolution and scan time. Specifically, we evaluated protocols with 6, 12, 15, 20, 30, 45, 60 and 120 angles; and 3 voxel sizes at 43, 86 and 172 µm. Our results indicate schemes using 46 or 60 diffusion directions, acquired at 86 µm resolution achieve a good cost/performance balance relative to a high spatial, high angular resolution sampling scheme.
Introduction
An altered brain connectivity is present in a variety of neurologic and psychiatric conditions, yet identifying affected pathways in animal models remains difficult. High spatial and angular resolution are required for dissecting vulnerable pathways and networks, but these requirements need to be balanced against time and cost. Here we simulated the effect of relaxing acquisition parameters on the accuracy of the reconstructed tracts and connectome, with reference to a high spatial and angular resolution protocol1. Our results can inform population studies for models of neurodegenerative disease.Methods
We produced simulations based on a published data set, acquired on a 9.4 T small animal imaging system controlled by an Agilent VnmrJ4 console1. We used a 3D diffusion-weighted spin-echo pulse sequence with repetition time (TR) = 100 ms, echo time (TE) = 15 ms, 568 ´ 284 ´ 228 matrix, 24.4´12.2 ´9.8 mm field of view, reconstructed at 43 µm resolution. 120 diffusion directions2, 3 were acquired using bvalues of 4000 s/mm2 , interspersed with 11 non-diffusion-weighted (b0) measurements. Angular downsampling of the diffusion data was performed by obtaining the optimal diffusion directions for each angular subset2, 3 and extracting the closest gradient vector from the 120 unique directions. The closest gradient was chosen by maximizing the dot product between the optimal gradient vector and the possible vectors found in the original gradient table. Spatial downsampling was performed in k space, resulting in 3 levels of isotropic resolution: 43, 86,172 µm. Data processing was done on a high-performance computing cluster with 96 physical cores and 1.5 TB of RAM. All 131 image volumes were affinely registered to the first b0 image using Advanced Normalization Tools (ANTs)4 to correct for eddy current distortions. Scalar volumes were reconstructed using FSL’s DTIFIT5. Fiber data for probabilistic tractography were reconstructed using FSL’s BEDPOSTX6 with maximum four fiber orientations/voxel. Atlas-based segmentation7 relied on a symmetric 332 regions atlas, combining the Waxholm atlas8 for subcortical labels, and the Ullmann atlas of the neocortex 9. Connectomes were constructed using SAMBA10, and DSIStudio11.Results
Down sampled diffusion data sets were used to estimate the total number of fibers per voxel in each set (Fig. 1). At each down sampling of diffusion directions there was a slight decrease in calculated fibers but the largest change occurred below 45 directions. We focused our analysis on the hippocampus, septum, hypothalamus and the lateral geniculate for gray matter, and we selected the fimbria and fornix as white matter regions relevant to Alzheimer’s disease (AD). A qualitative evaluation of the fimbria tract density maps reconstructed from 12 directions did not capture the cortical-cortical connectivity with the same sensitivity as the 45 or 120 direction schemes (Fig 2). Our quantitative analysis of the dyad dispersion (Fig 3) showed that errors decayed as the number of angular samples increases, and increased as we relaxed the spatial resolution. Probabilistic tractography was used to generate connectivity matrices between the selected regions at 43 µm (Fig. 4). While the correlation between the three connectivity matrices was always significant (p<0.001), the values increased from 0.65 for the Spearman correlation between 12 and 120 directions; to 0.76 between 12 and 45 directions and to 0.90 between 45 and 120 directions. Moreover, we computed the pairwise graph similarity for these subgraphs (Fig 4B), thresholding at 0.05 to illustrate the differences in sparsity, which is lowest in between the 45 and 120 directions sets. The sensitivity to capturing connectivity of smaller region is evident in the chord diagrams (Fig 4C) which are sparser for 12 directions relative to 45, and 120 directions. Our results support that angular and spatial resolution need to be balanced with respect to time and cost demands to enable population studies, and recommend parameters for efficient protocols with minimum loss of sensitivity.Discussion and Conclusion
Our previous study produced a diffusion MRI data set with the highest reported resolution for the whole mouse brain12, with a scan time of 235 hours. Replicating this acquisition for population studies has prohibitive cost and time. To address this problem, we must develop techniques that produce similar outcomes to our reference protocol, but with greatly reduced time. In our simulations, we found that 45-60 angular samples and 43 or 86 µm spatial resolution achieved a good tradeoff between cost and performance. We evaluated regions of interest in Alzheimer’s research, from hippocampus (5% of brain volume) to fimbria and fornix (0.05% of brain volume 13). Our study can inform the design of future experiments for statistical connectomics in mouse models of neurological conditions, such as AD.Acknowledgements
NIH awards K01 AG041211 (Badea), P41 EB015897 and 1S10OD010683-01 (Johnson).References
1. Calabrese E, Badea A, Coe CL, Lubach GR, Shi Y, Styner MA, Johnson GA. A diffusion tensor MRI atlas of the postmortem rhesus macaque brain. Neuroimage. 2015;117:408-16. PubMed PMID: 26037056. 2. Koay CG. A simple scheme for generating nearly uniform distribution of antipodally symmetric points on the unit sphere. J Comput Sci. 2011;2(4):377-81. doi: 10.1016/j.jocs.2011.06.007. PubMed PMID: 22125587; PMCID: PMC3223966. 3. Koay CG, Hurley SA, Meyerand ME. Extremely efficient and deterministic approach to generating optimal ordering of diffusion MRI measurements. Med Phys. 2011;38(8):4795-801. doi: 10.1118/1.3615163. PubMed PMID: 21928652; PMCID: PMC3172961. 4. Avants BB, Tustison NJ, Song G, Cook PA, Klein A, Gee JC. A reproducible evaluation of ANTs similarity metric performance in brain image registration. Neuroimage. 2011;54(3):2033-44. Epub 2010/09/21. doi: 10.1016/j.neuroimage.2010.09.025. PubMed PMID: 20851191; PMCID: PMC3065962. 5. Behrens TE, Woolrich MW, Jenkinson M, Johansen-Berg H, Nunes RG, Clare S, Matthews PM, Brady JM, Smith SM. Characterization and propagation of uncertainty in diffusion-weighted MR imaging. Magn Reson Med. 2003;50(5):1077-88. doi: 10.1002/mrm.10609. PubMed PMID: 14587019. 6. Behrens TE, Berg HJ, Jbabdi S, Rushworth MF, Woolrich MW. Probabilistic diffusion tractography with multiple fibre orientations: What can we gain? Neuroimage. 2007;34(1):144-55. Epub 2006/10/31. doi: 10.1016/j.neuroimage.2006.09.018. PubMed PMID: 17070705. 7. Sharief AA, Badea A, Dale AM, Johnson GA. Automated segmentation of the actively stained mouse brain using multi-spectral MR microscopy. Neuroimage. 2008;39(1):136-45. doi: 10.1016/j.neuroimage.2007.08.028. PubMed PMID: 17933556; PMCID: PMC2139901. 8. Johnson GA, Badea A, Brandenburg J, Cofer G, Fubara B, Liu S, Nissanov J. Waxholm space: an image-based reference for coordinating mouse brain research. Neuroimage. 2010;53(2):365-72. Epub 2010/07/06. doi: 10.1016/j.neuroimage.2010.06.067. PubMed PMID: 20600960; PMCID: PMC2930145. 9. Ullmann JF, Watson C, Janke AL, Kurniawan ND, Reutens DC. A segmentation protocol and MRI atlas of the C57BL/6J mouse neocortex. Neuroimage. 2013;78:196-203. Epub 2013/04/17. doi: 10.1016/j.neuroimage.2013.04.008. PubMed PMID: 23587687. 10. Anderson RJC, James J; Delpratt, Natalie A; Nouls, John C; Gu, Bin; McNamara, James O; Avants, Brian B; Johnson, G Allan; Badea, Alexandra. Small Animal Multivariate Brain Analysis (SAMBA): A High Throughput Pipeline with a Validation Framework. rXiv e-prints. 2017. 11. Yeh FC, Verstynen TD, Wang Y, Fernandez-Miranda JC, Tseng WY. Deterministic diffusion fiber tracking improved by quantitative anisotropy. PLoS One. 2013;8(11):e80713. PubMed PMID: 24348913. 12. Calabrese E, Badea A, Cofer G, Qi Y, Johnson GA. A Diffusion MRI Tractography Connectome of the Mouse Brain and Comparison with Neuronal Tracer Data. Cereb Cortex. 2015;25(11):4628-37. PubMed PMID: 26048951. 13. Badea A, Kane L, Anderson RJ, Qi Y, Foster M, Cofer GP, Medvitz N, Buckley AF, Badea AK, Wetsel WC, Colton CA. The fornix provides multiple biomarkers to characterize circuit disruption in a mouse model of Alzheimer's disease. Neuroimage. 2016;142:498-511. Epub 2016/08/16. doi: 10.1016/j.neuroimage.2016.08.014. PubMed PMID: 27521741; PMCID: PMC5159324.Figures
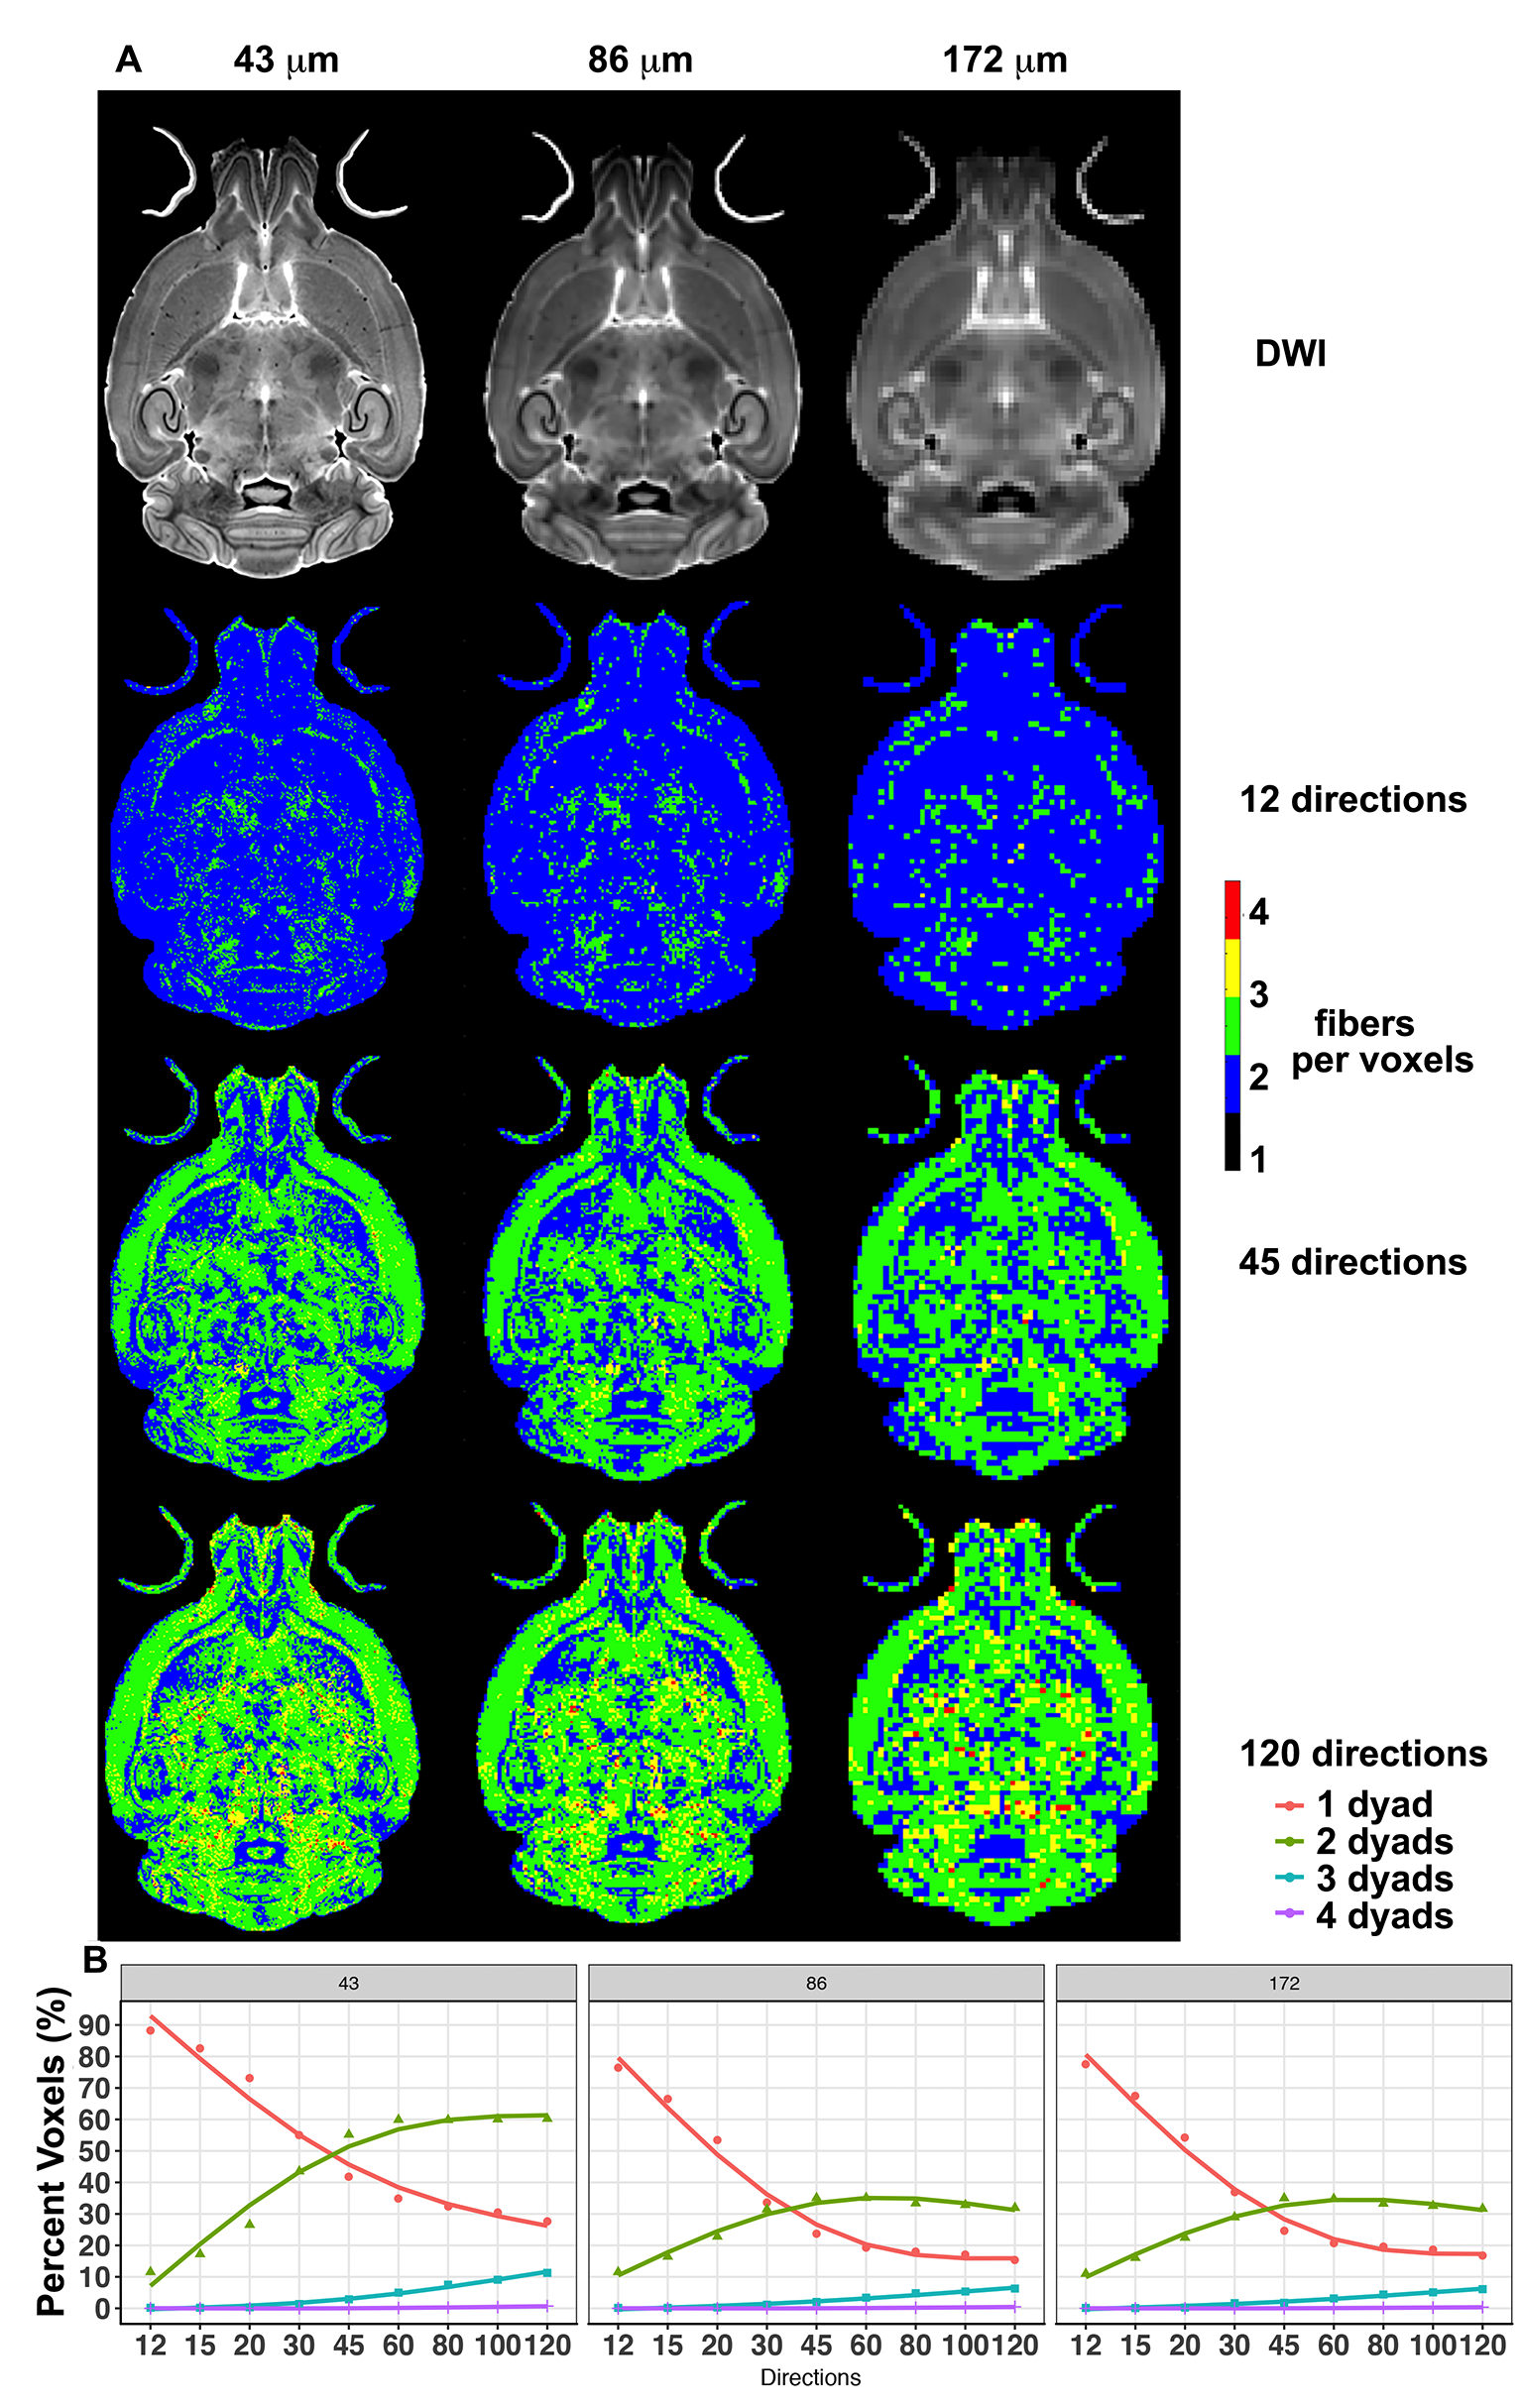
Figure 1. The effect
of spatial resolution (horizontal axis) and angular resolution (vertical axis)
on the number of voxels with 1, 2, 3, or 4 fibers (dyads) per voxels. (A)
illustrates these effects for 12, 45 and 120 directions, chosen as examples for
low, medium, and high angular sampling. (B) illustrates the effects for
sampling schemes between 12 and 120, at 3 spatial resolutions (43 µm, 86 µm,
and 172 µm). Changing resolution affected the first dyads, and was more
prominent for the higher (2nd) order dyads. These results illustrate
the advantages of high angular and spatial resolution protocols.
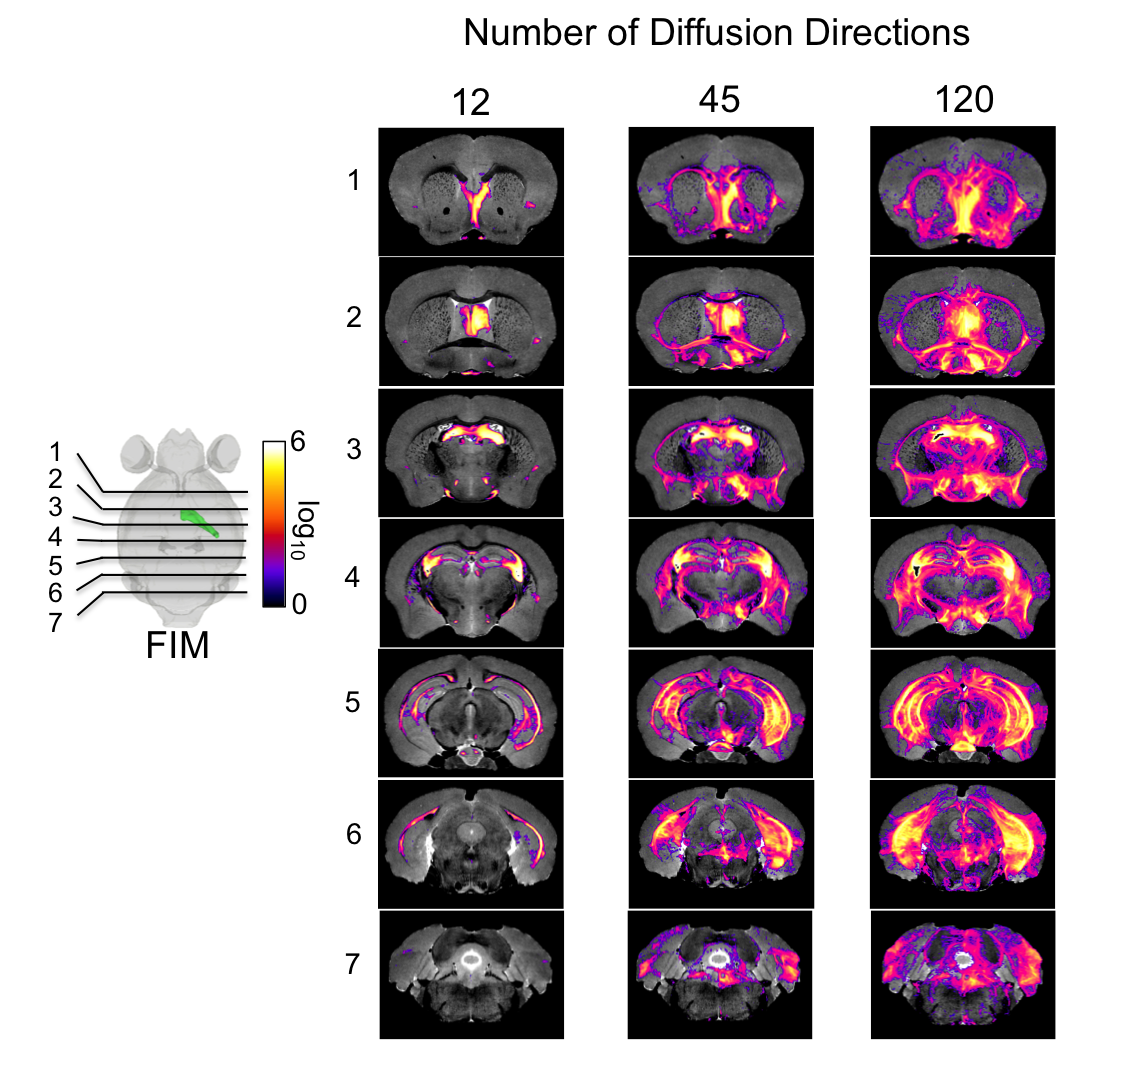
Figure 2. The
connectivity of the fimbria was reconstructed for protocols with 12, 45, 120
directions, at the full 43 µm resolution, illustrating limitations for the
small 12 directions protocol.
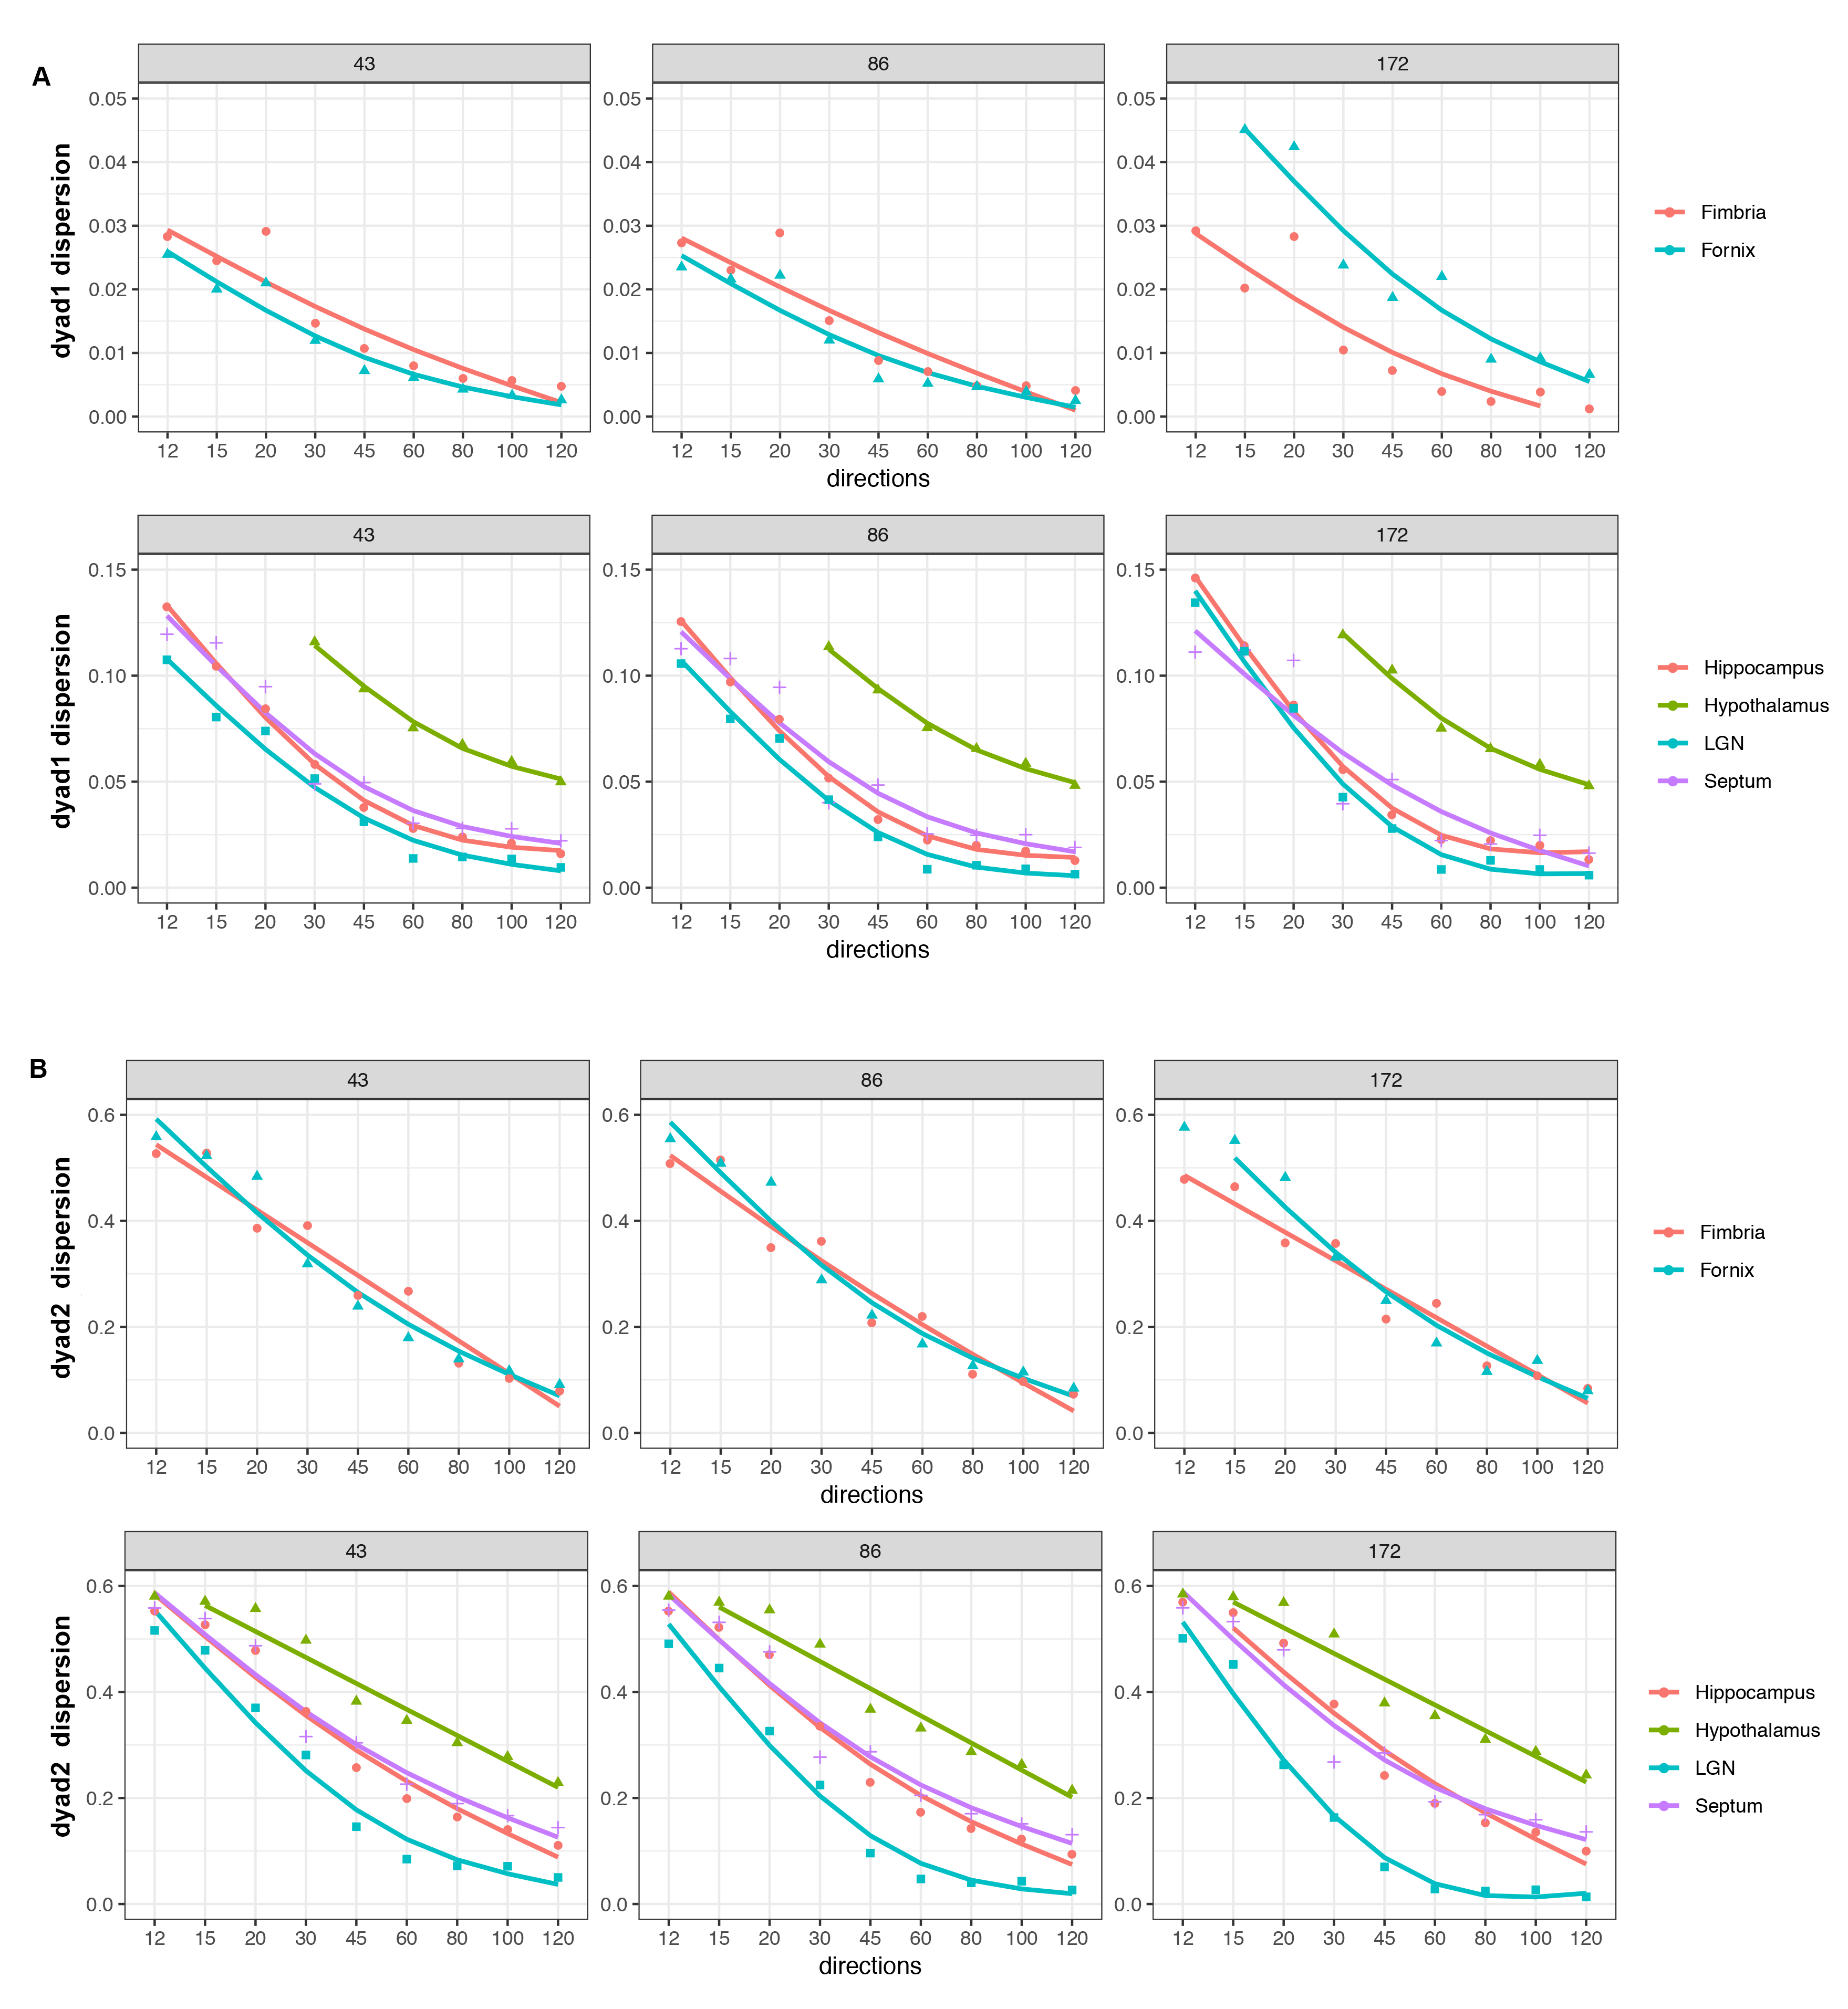
Figure 3.
Dyad 1 dispersion showed decreasing errors for higher angular samples, with an
inflection point at 45°, and increasing stability after 60° (A). Similar errors
were apparent for 43 and 86 µm, but larger for 172 µm. Dyad2 showed a higher
effect of resolution, and larger errors, tapering off after 60° (B).
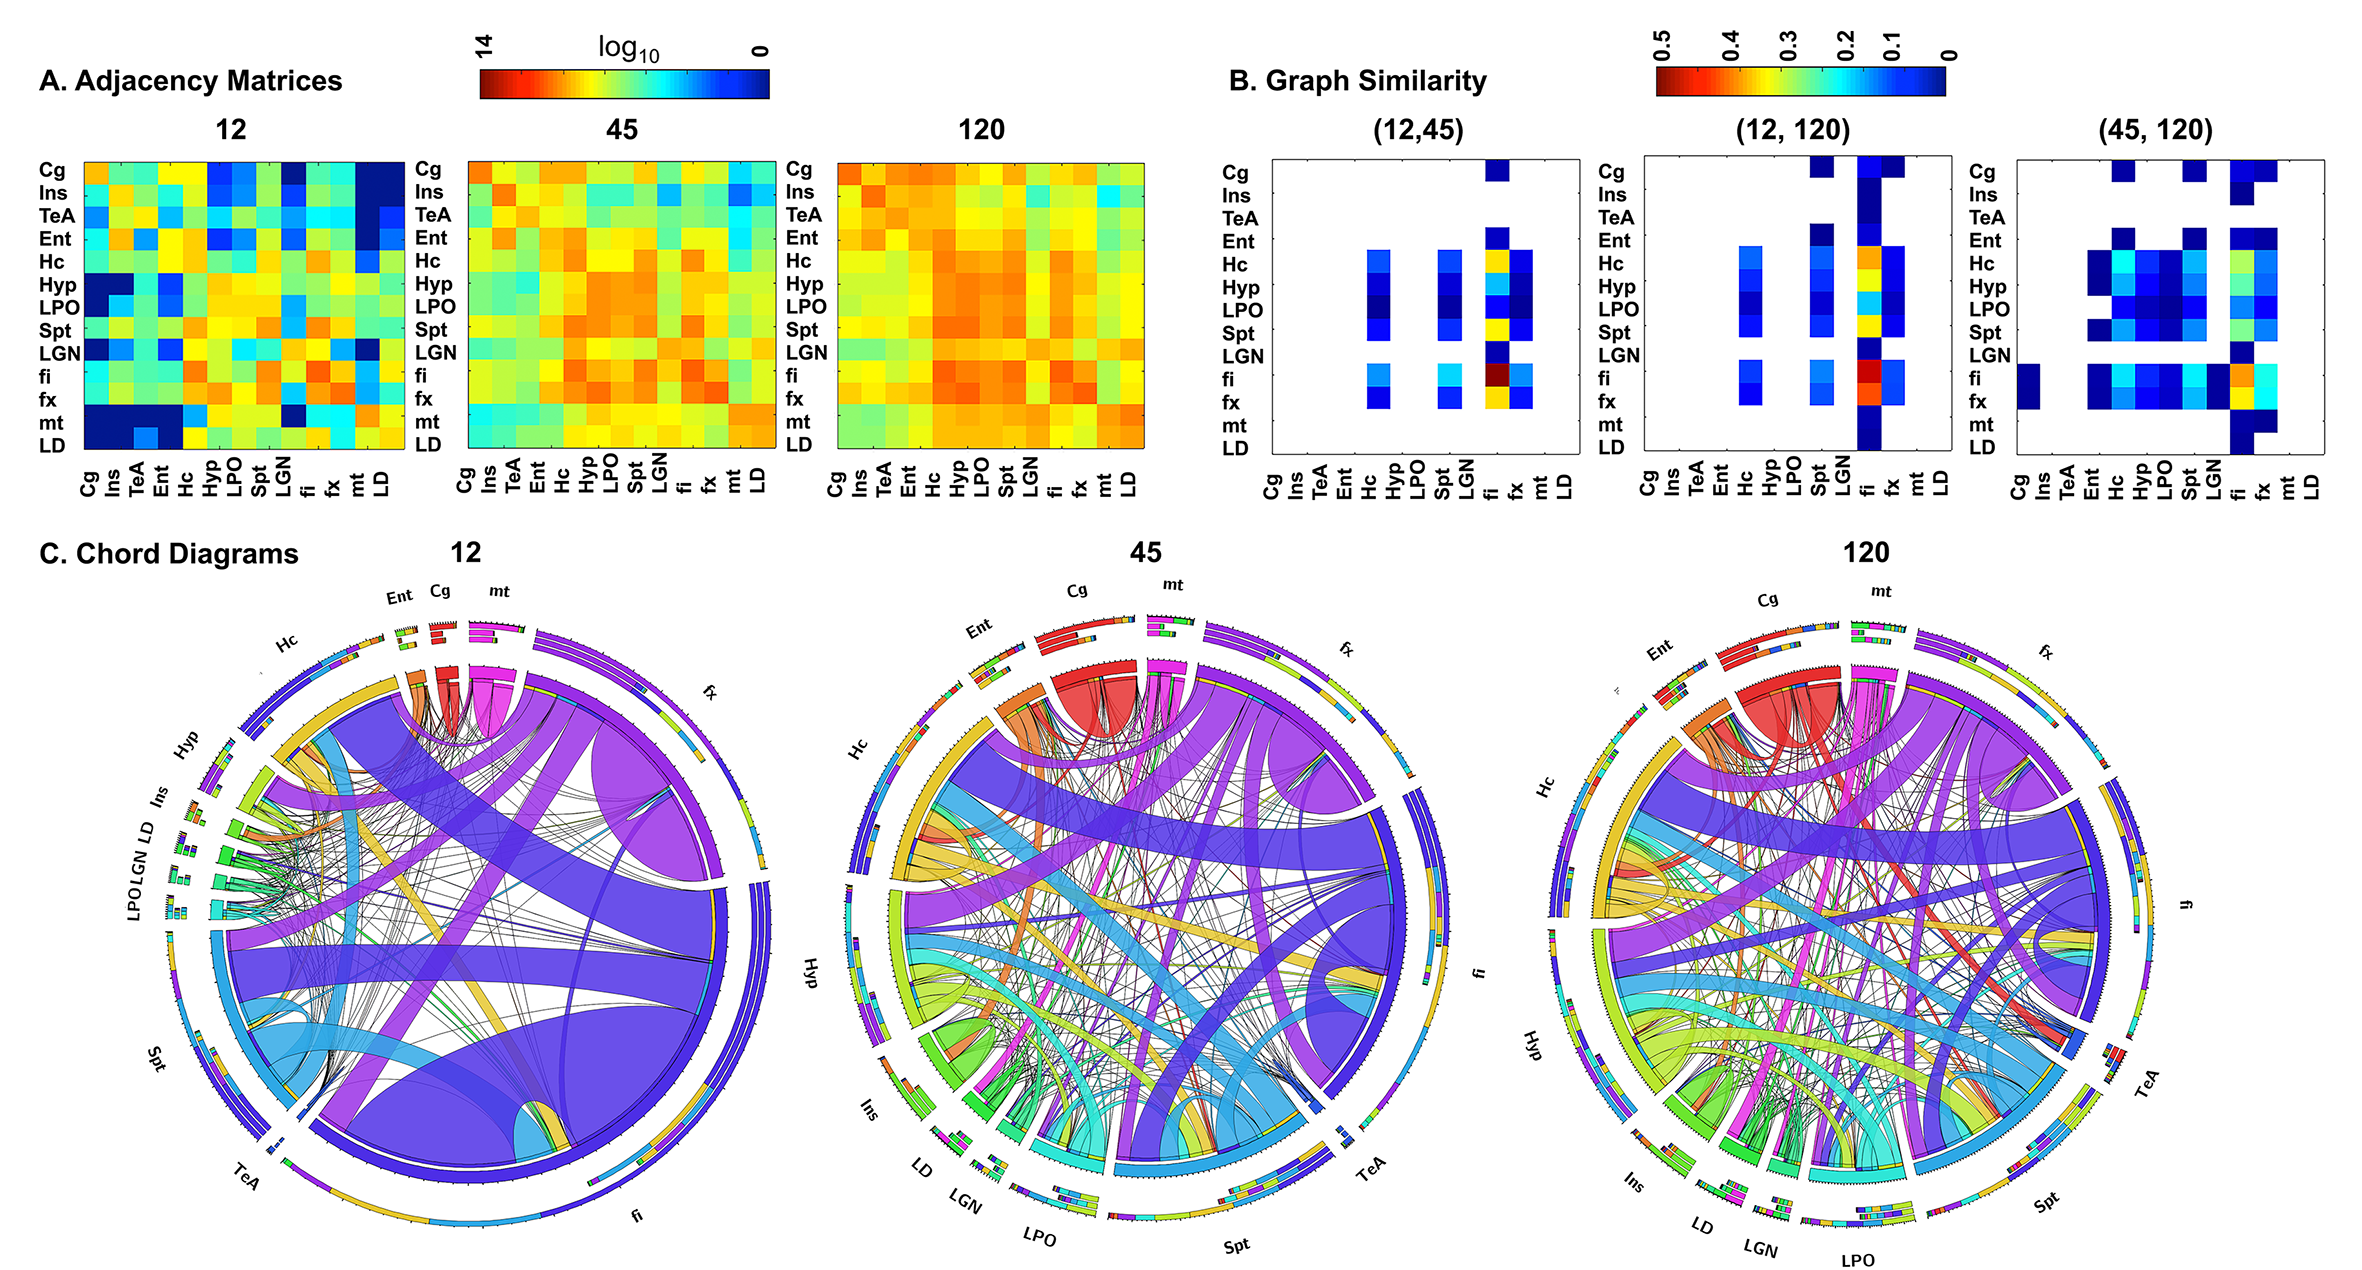
Figure 4. The adjacency matrices for a subset of 13
regions relevant to neurodegenerative diseases showed greater similarity to the
reference connectome for 45 directions, compared to 12 directions (A). This can
be quantified through a graph similarity matrix (B). The chord diagrams (C) shows that all
protocols captured the connectivity of the hippocampus (HC) and its connecting
fibers (fx: fornix, fi: fimbria), but shorter protocols had reduced sensitivity
for smaller nuclei (LD: laterodorsal thalamic nuclei, LGN: lateral geniculate
nuclei; LPO: lateral preoptic nucleus), and lacked thesensitivity required for cortical-cortical
connectivity e.g. for the cingulate (Cg) and entorhinal cortices (Ent).