3598
Multi-site concordance of diffusion weighted imaging derived metrics, a comparison of fitting algorithms for differentiating whole-mount, pathologically confirmed, prostate cancer of differing Gleason patterns1Radiology, Medical College of Wisconsin, Milwaukee, WI, United States, 2Biophysics, Medical College of Wisconsin, Milwaukee, WI, United States, 3Biostatistics, Medical College of Wisconsin, Milwaukee, WI, United States, 4Radiology, University of Michigan, Ann Arbor, MI, United States, 5Radiation Oncology, University of Michigan, Ann Arbor, MI, United States, 6Radiology, Brigham and Women's Hospital, Boston, MA, United States, 7Division of Neuroimaging Research, Barrow Neurological Institute, Phoenix, AZ, United States, 8Radiology, Mount Sinai, New York, NY, United States, 9Medical Physics, Memorial Sloan Kettering Cancer Center, New York, NY, United States, 10Radiology, Memorial Sloan Kettering Cancer Center, New York, NY, United States, 11Institute for Computational Engineering and Sciences, University of Texas, Austin, TX, United States, 12Radiology, University of Texas Southwestern Medical Center, Dallas, TX, United States, 13Advanced Imaging Research Center, Oregon Health Sciences University, Portland, OR, United States, 14Department of Radiology, University of Washington, Seattle, WA, United States, 15Urological Surgery, Medical College of Wisconsin, Milwaukee, WI, United States, 16Pathology, Medical College of Wisconsin, Milwaukee, WI, United States
Synopsis
We present a multi-site study measuring the ability of various software platforms to fit diffusion weighted imaging (DWI) models for differentiating prostate cancer (PCA) of different Gleason patterns. A dataset of DWI collected from 33 PCA patients was distributed to ten collaborating groups who fit the multi-b DWI models with onsite software and submitted the derived parametric maps to a central analysis site. Each map was aligned to the T2-weighted image and compared to pathologist annotations of whole-mount prostate samples. A statistical analysis was performed for similarity of the quantitative values, and the ability of each metric to differentiate PCA.
Introduction
A major focus of ongoing radiological studies is optimizing the differentiation of indolent from aggressive prostate cancer (PCA). Diffusion weighted imaging (DWI) is commonly used for the radiological diagnosis of PCA and is included as a deciding factor in the PIRADS grading scale for radiographic diagnosis1. Quantitative calculation of diffusion values can however vary due to the software implementation of fitting algorithms. This study compares the quantitative DWI parameters derived from software developed or implemented at 10 collaborating sites when applied to a common dataset of prostate imaging. We compare the DWI parameters calculated to determine whether cancer detection is impacted by algorithm implementation and fit parameters.Methods
Patient Population and Data Acquisition Thirty-three PCA patients undergoing prostatectomy were recruited for this institutional review board (IRB) approved study. Patients underwent MP-MRI prior to prostatectomy on a 3T MRI scanner (General Electric, Waukesha, WI) using an endorectal coil. MP-MRI included field-of-view (FOV) optimized and constrained undistorted single shot (FOCUS) diffusion weighted imaging (DWI) with ten b-values (b=0, 10, 25, 50, 80, 100, 200, 500, 1000, and 2000) and T2-weighted imaging. Robotic prostatectomy was performed, and prostate samples were sectioned using patient-specific custom 3D printed slicing jigs to match the slice orientation to the T2 weighted image.
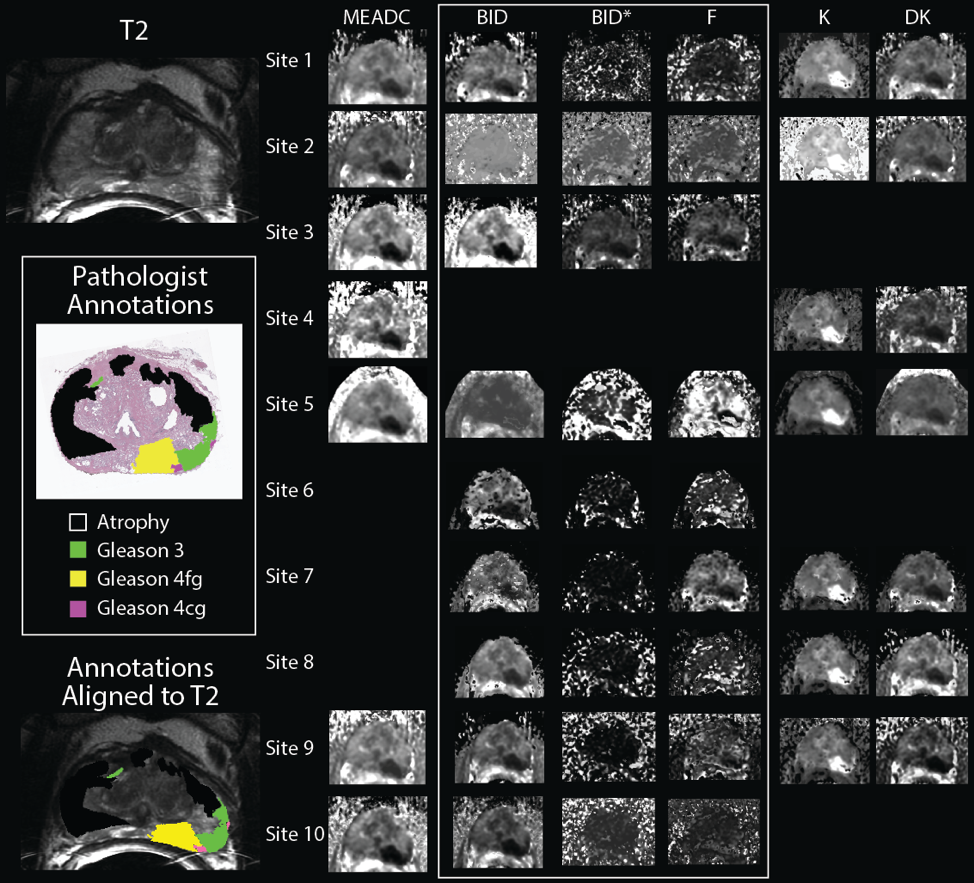
Ground Truth Cancer Localization Prostate samples were whole-mount hematoxylin and eosin (H&E) stained, digitized, and annotated by a urological fellowship trained pathologist (Figure 1). A total of 169 slides were included in this study. Annotations of different Gleason patterns were brought into MRI space using a non-linear transform, calculated from control points manually placed2,3. Pathologist-annotated regions (PA-ROIs) that consisted of at least 200 contiguous voxels were included for further analysis, which resulted in 231 cancer (CA) regions of interest (ROIs), and 564 ROIs not associated with cancer (NCA).
Diffusion Signal Fitting DICOM datasets of the FOCUS DWI were de-identified and distributed to collaborating sites. Each site was asked to calculate diffusion parameters using locally developed software, implemented to fit the b-values. This included a mono-exponential (ME) fit (parameter: MEADC), diffusion kurtosis (parameters: kurtosis (K), and diffusion (DK))4, and a bi-exponential fit (parameters: diffusion (BID), pseudo-diffusion (BID*) and perfusion fraction (F))5. Each site submitted the calculated maps to the primary institution for analysis. Site results were pre-processed to ensure each map was in a common space and scaled properly, and re-sliced and resampled into the T2 space for comparison to the PA-ROIs.
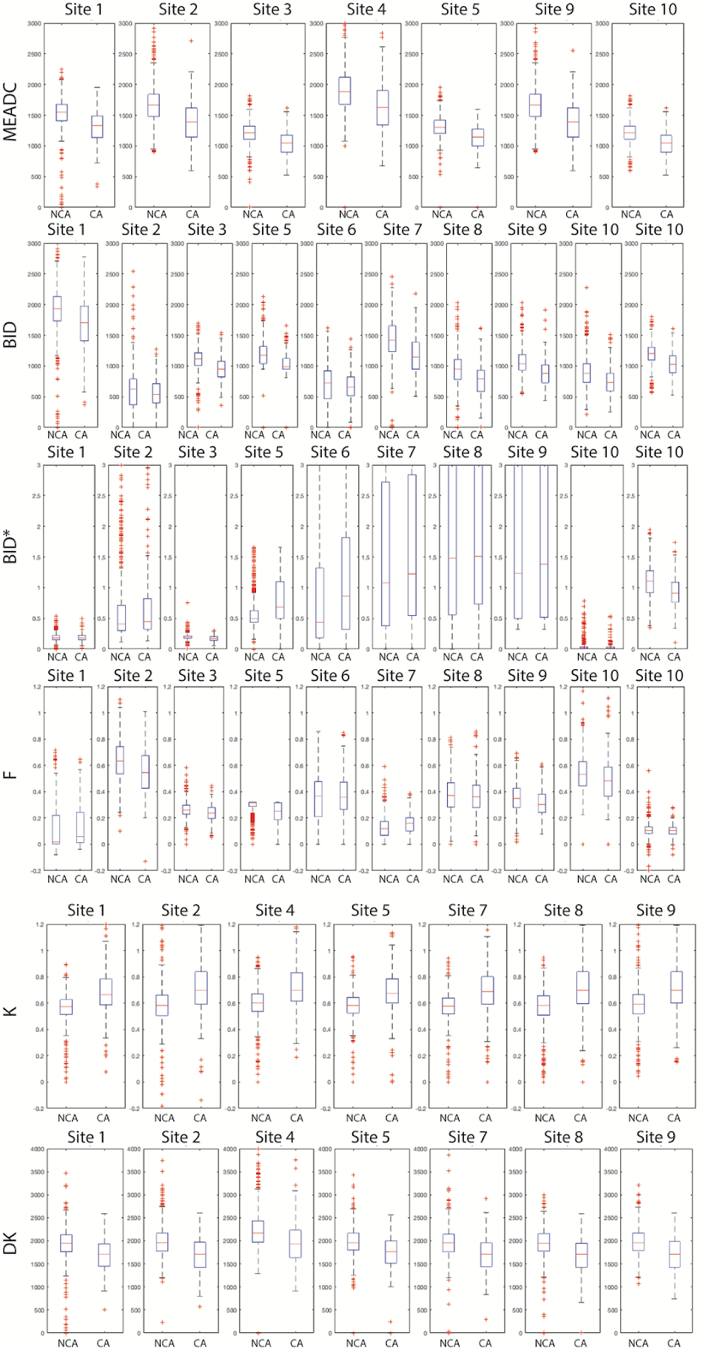
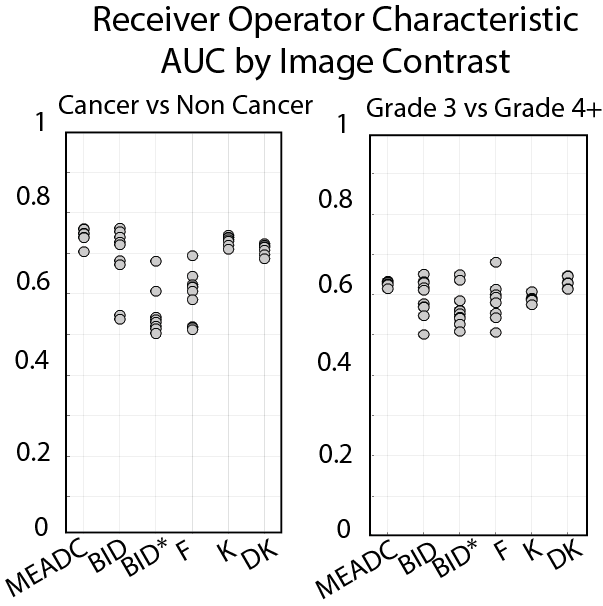
Statistical Analysis Median diffusion values were calculated within each PA-ROI and concatenated into a matrix for further statistical analysis. Each parameter was compared within non-cancer (NCA) and PCA PA-ROIs to determine site-specific variability in quantitative parameters. A further comparison of NCA to PCA PA-ROIs was performed to determine whether parameters differed due to the presence of cancer. A receiver operator characteristic (ROC) analysis was performed to determine the ability of each metric (and each site) to differentiate regions of cancer from normal tissue, as well as a comparison of low-grade from high-grade differentiation. Mean area under the curve (AUC) was calculated from the site results to summarize the cancer differentiation ability of each parameter.
Results
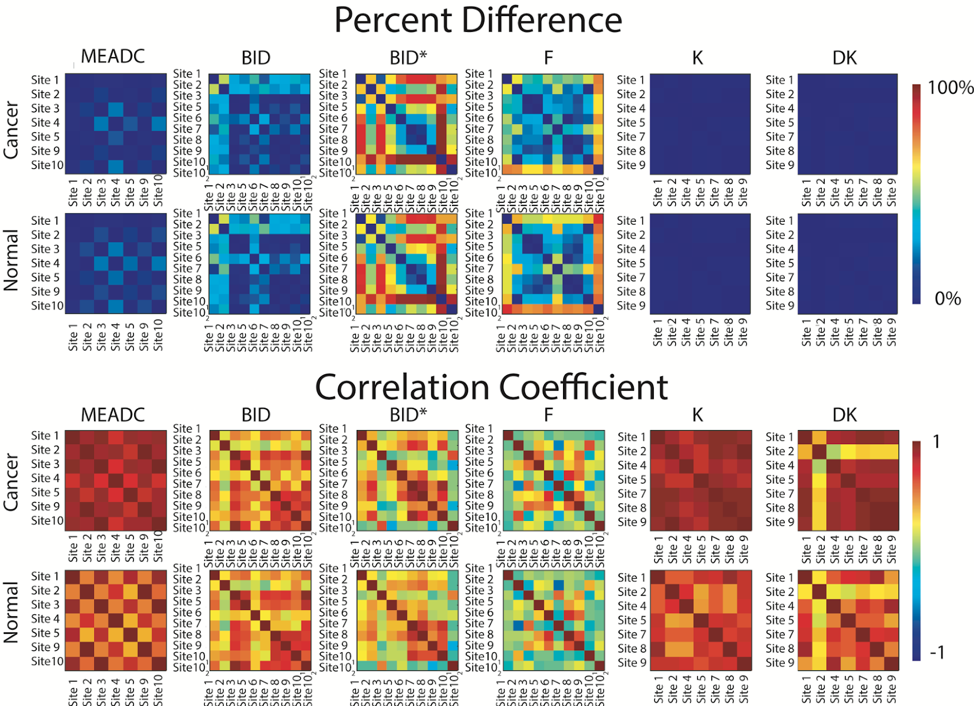
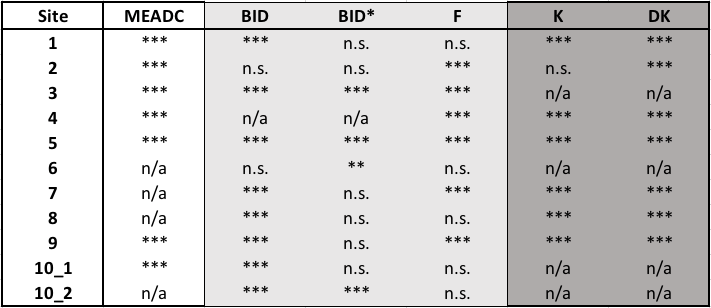
A representative image from one patient is shown in Figure 1 with site specific submissions of DWI parametric maps. A box plot showing summary values for each parameter is shown in Figure 2. The comparison of NCA and CA PA-ROIs showed that parameters varied across sites. When ranked by average percent difference, K and DK followed by MEADC were most stable while bi-exponential parameters varied substantially between sites (Figure 3 Top). Likewise, correlation between parameters followed the same trend (Figure 3 Bottom). When assessing parameters for cancer differentiation, MEADC, K, and DK performed the least variably between sites as measured by the variance associated with the between site AUCs. Table 1 shows a summary of p-values calculated when data from Figure 3 was processed with a generalized estimating equations model, controlling for repeated measures within patients.Discussion
We present a multi-site study quantifying the differences in diffusion fitting algorithms for differentiating prostate cancer. We find that K, DK and MEADC are the most reliably calculated parameters across sites, but that while variability exists in the calculated raw values, the core task of cancer differentiation remains stable across sites. This study therefore demonstrates that contrast between PCA and NCA is maintained independent of the site-specific implementation of the fitting, though further steps may be necessary to resolve absolute quantitation of diffusion parameters.Acknowledgements
Advancing a Healthier Wisconsin, the State of Wisconsin Tax Check off Program for Prostate Cancer Research, National Center for Advancing Translational Sciences, NIH UL1TR001436, TL1TR001437, R01CA218144, U01CA176110, R21CA231892, U01CA166104, R01CA190299, P01CA085878, U24CA180918, R01CA160902, U01CA151261, R01CA158079, U01CA172320, U01CA211205, P30CA008748, U01CA142565, U01CA207091, U01CA154602, R50CA211270References
1. Vargas HA, Hotker AM, Goldman DA, et al. Updated prostate imaging reporting and data system (PIRADS v2) recommendations for the detection of clinically significant prostate cancer using multiparametric MRI: critical evaluation using whole-mount pathology as standard of reference. European radiology. 2016;26(6):1606-1612.
2. Hurrell SL, McGarry SD, Kaczmarowski A, et al. Optimized b-value selection for the discrimination of prostate cancer grades, including the cribriform pattern, using diffusion weighted imaging. J Med Imaging (Bellingham). 2018;5(1):011004.
3. McGarry SD, Hurrell SL, Iczkowski KA, et al. Radio-pathomic Maps of Epithelium and Lumen Density Predict the Location of High-Grade Prostate Cancer. Int J Radiat Oncol Biol Phys. 2018;101(5):1179-1187.
4. Jensen JH, Helpern JA, Ramani A, Lu H, Kaczynski K. Diffusional kurtosis imaging: the quantification of non-gaussian water diffusion by means of magnetic resonance imaging. Magn Reson Med. 2005;53(6):1432-1440.
5. Le Bihan D, Breton E, Lallemand D, Aubin ML, Vignaud J, Laval-Jeantet M. Separation of diffusion and perfusion in intravoxel incoherent motion MR imaging. Radiology. 1988;168(2):497-505.
Figures