3597
A Novel Characterization of Traumatic Brain Injury in White Matter with Diffusion MRI Spherical-Harmonics Rotation Invariants1Athena Project-Team, INRIA, Sophia Antipolis - Méditerranée, France, 2University of Pennsylvania, Philadelphia, PA, United States, 3Department of Molecular, Cellular, and Biomedical Sciences, CUNY School of Medicine, New York, NY, United States
Synopsis
The current DTI-based markers of traumatic brain injury are able to capture affected white matter in the brain, but miss the areas of crossing fibers due to the simplicity of the model. In this work, we use a novel set of spherical-harmonics rotation invariants indices, recently proposed in the literature. We demonstrate that these 12 invariants capture all the information provided by DTI and, in addition, they capture differences in complex white matter beyond DTI measures. This, combined with the clinical feasibility of the method, paves the way for them to be used as better markers of brain injury.
Introduction
Traumatic brain injury (TBI) is known to produce extensive damage in white matter1-4 (WM). Diffusion MRI enables a clinician to assess WM integrity non-invasively. In particular, Diffusion Tensor Imaging (DTI) derived indices such as the Mean Diffusivity (MD) and Fractional Anisotropy (FA), have been used in TBI research to detect axonal injury and inflammation and to study their evolution longitudinally1-4. In this work, we propose the use of a new set of 12 rotation invariants indices5 extracted from the 4th order Spherical-Harmonics (SH) fitting of the apparent diffusion coefficient6 (ADC) for TBI data. These new invariants5 represent a complete set of algebraic independent polynomials which include in their analytical formulation previously proposed indices such as the power-spectrum invariants7. We used these SH-derived indices in order to identify the regions of the brain in which the WM shows a significant pathology-based difference. We also demonstrated that the invariants showed all the information of the DTI measures and produced additional information.Methods
TBI dataset is composed of 38 patients plus 35 healthy controls. For every subject, we acquire a standard DTI protocol (30 gradient directions at b-value=1000 s/mm2 , 7 b=0 s/mm2, 2x2x2 mm3 resolution). The T1 images were used to segment the WM into 102 regions of interest (ROI), after registration to diffusion data. For each subject, we calculated the ADC voxelwise by taking the logarithm of the signal normalized by the average b=0s/mm2 and dividing it for the b-value6. Therefore, we fit 4th order SH to the ADC and derive the 12 corresponding rotation invariant indices5,8 and we calculate the median of each invariant in every ROI for each subject. An ordinary least squares regression model was fit to the median value in each ROI for the invariants and the DTI indices, with terms for group (patients or controls), age and sex. The Cohen’s d effect size corresponding to the estimate of the group coefficient was calculated for each model and collected as a vector of 102 values. Correlation coefficients were calculated from these vectors for each measure versus each other measure, before thresholding for statistical significance (alpha=0.05). Effect sizes whose corresponding p-value were greater than this threshold was then set to zero for visualization.Results
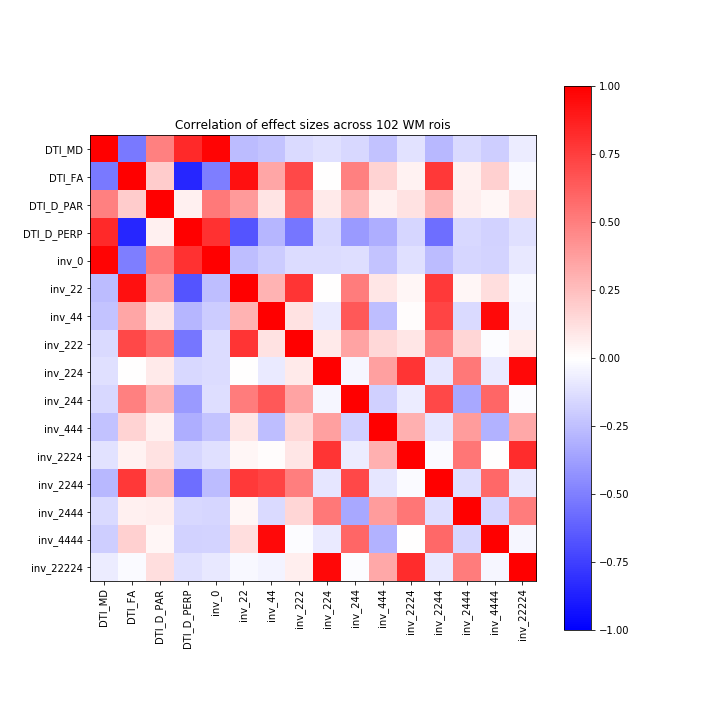
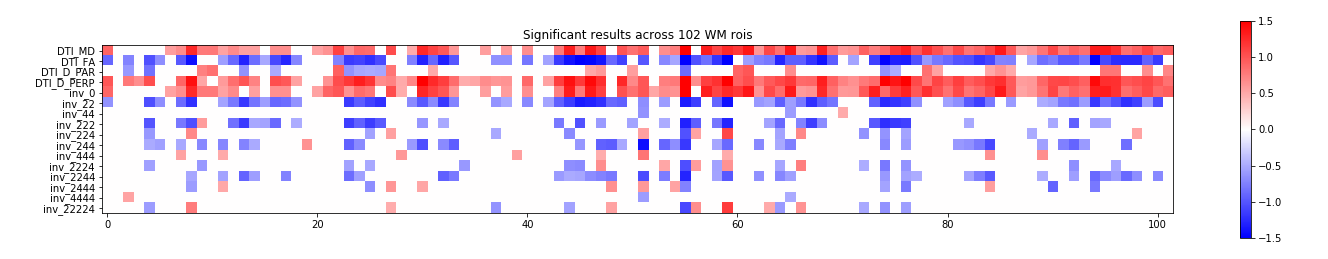
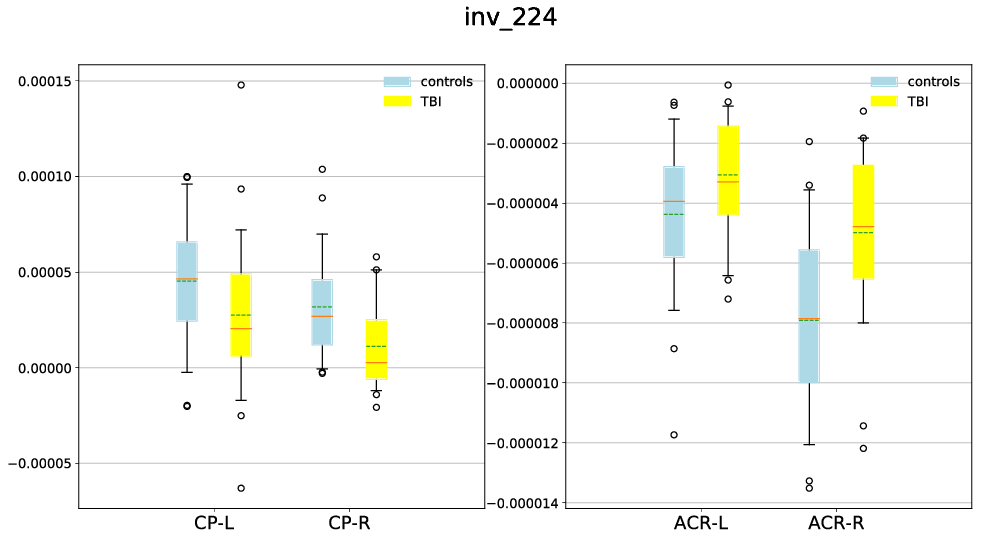
Figure 1 shows the correlation between the SH invariant indices and DTI indices including FA, MD, parallel and perpendicular diffusivity. We see that inv_0 correlates with MD and inv_22 correlates with FA. Figure 2 shows the regions in which we observe a statistical difference (p<0.05) of the invariants in TBI patients in comparison to healthy control. We observe a significant increase of inv_0 and a decrease of inv_22 in the TBI patients, in various WM regions all over the brain. A significant difference in the other invariants appears to be less widespread and more specific to particular brain regions. However, inv_224 shows low correlation with any of the DTI indices (Fig. 1) but presents differences in many WM areas of the brain (Fig. 2). In some regions inv_224 shows an increase between patients and controls and in some other regions a decrease. Specifically, there is a statistically significant increase in the anterior corona radiata and a decrease in the cerebral peduncle (Fig. 3). High order invariants (inv_44, inv_444, and inv_4444) present very few regions in which we observe a statistical difference between healthy and controls. Further analyses reveal that these few differences are indistinguishable from noise-like effect.Discussion and Conclusion
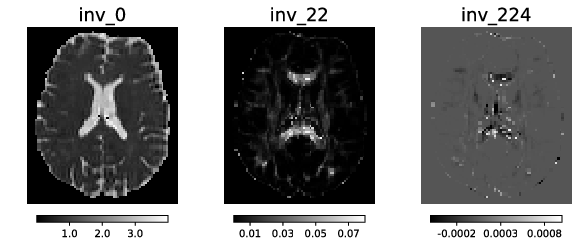
In this work, we have provided a set of higher-order invariants that can be used to assess the WM in TBI. The first SH invariant, inv_0, is equal to the mean of the ADC, and hence is correlated with MD. The second SH invariant contains all the information of FA. An increase of the diffusivity (inv_0) and a decrease of the anisotropy (inv_22) is generally linked with axonal damage and swelling. The inv_224, however, presents information that is different from other DTI indices and captures a unique pattern of difference in the whole brain (Fig. 4). This specific pattern may be linked to a different type of WM damages in these areas which classical DTI indices are not able to distinguish, especially in regions of crossing fibers. High order invariants are currently limited by the limited number of acquisition samples. Thus, we have been able to provide indices that capture pathology-induced differences in the brain, with additional information in the crossing fiber regions that has hitherto never been demonstrated in clinically acquired data which have the potential to become important markers for brain injury.Acknowledgements
This work has received funding from the European Research Council (ERC) under the European Union’s Horizon 2020 research and innovation program (ERC Advanced Grant agreement No 694665 : CoBCoM - Computational Brain Connectivity Mapping), NIH - R01NS096606 and R01NS092398, and PA-Department of Health award.References
1. Kim, Junghoon, et al. "Disrupted structural connectome is associated with both psychometric and real-world neuropsychological impairment in diffuse traumatic brain injury." Journal of the International Neuropsychological Society 20.9 (2014): 887-896.
2. Kumar, Raj, et al. "Comparative evaluation of corpus callosum DTI metrics in acute mild and moderate traumatic brain injury: its correlation with neuropsychometric tests." Brain injury 23.7-8 (2009): 675-685.
3. Rutgers, D. R., et al. "Diffusion tensor imaging characteristics of the corpus callosum in mild, moderate, and severe traumatic brain injury." American Journal of Neuroradiology 29.9 (2008): 1730-1735.
4. Kraus, Marilyn F., et al. "White matter integrity and cognition in chronic traumatic brain injury: a diffusion tensor imaging study." Brain 130.10 (2007): 2508-2519.
5. Zucchelli, Mauro, et al. “A Closed-Form Solution of Rotation Invariant Spherical Harmonic Features in Diffusion MRI.” MICCAI - Computational Diffusion MRI Workshop 2018, Granada, Spain.
6. Özarslan, Evren, and Thomas H. Mareci. "Generalized diffusion tensor imaging and analytical relationships between diffusion tensor imaging and high angular resolution diffusion imaging." Magnetic Resonance in Medicine: An Official Journal of the International Society for Magnetic Resonance in Medicine 50.5 (2003): 955-965.
7. Novikov, Dmitry S., et al. "Rotationally-invariant mapping of scalar and orientational metrics of neuronal microstructure with diffusion MRI." NeuroImage 174 (2018): 518-538.
8. Caruyer, Emmanuel, and Ragini Verma. "On facilitating the use of HARDI in population studies by creating rotation-invariant markers." Medical image analysis 20.1 (2015): 87-96.
Figures