3594
Longitudinal evaluation of bundle-wise water diffusion changes following axonal degeneration in a region of fiber crossing1Instituto de Neurobiologia, Universidad Nacional Autonoma de Mexico, Queretaro, Mexico, 2Escuela de Medicina, Universidad de Buenos Aires, Buenos Aires, Argentina, 3Centro de Investigacion en Matematicas, Guanajuato, Mexico
Synopsis
Axonal degeneration is a hallmark of many neuropathologies, with a defined time course presenting distinct histological features. In single fiber regions, the tensor model provides reliable information in early and chronic phases of axonal damage. However, said model cannot accurately determine per-bundle characteristics in voxels occupied by axonal populations with different orientations. We evaluated two multiple-fiber methods in an animal model of axonal degeneration (unilateral retinal ischemia) to provide information about the sensitivity of these models related to microstructural changes occuring in the acute and early chronic stages of pathology in a crossing fiber region.
Background
Diverse neurodegenerative diseases present axonal degeneration. Diffusion-weighted magnetic resonance imaging (DW-MRI) can provide information regarding early and chronic microstructural changes. While the tensor model often suffices to characterize voxels including a single fiber population, multiple-fiber models must be used to evaluate voxels that include crossing fibers to—ideally—infer histological features of individual bundles 1-3. Information derived from multi-fiber models correlates with histological information on axonal loss metrics derived from Spherical Deconvolution (CSD) 4 and Multiple-Tensor (MT)5 models in the rat optic chiasm evaluated at advanced phases of axonal degeneration 6. However, specific early histopathological changes have not been assessed. We evaluated the sensitivity of two multi-fiber models to detect and follow per-bundle microstructural changes in a region of known fiber crossings (optic chiasm) in which only one fiber population is injured.Methods
Animal preparation: Axonal degeneration of the optic pathway was induced through unilateral retinal ischemia in 15 Wistar rats 6. Animals were divided into 3 groups according to time of euthanasia/fixation following injury (1, 7 and 30 days). Four rats served as controls. Tissue was fixed by trans-cardial perfusion with paraformaldehyde, glutaraldehyde, PBS and gadolinium. Brains were extracted including optic nerves and chiasm. Imaging: DW-MRI were acquired at 21 °C in a 7 T Bruker Pharmascan 70/16 (Gmax = 760 mT/m) and a Helium-cooled 2 channel mouse head coil. Samples were immersed in Fluorinert and placed with the chiasm in close proximity to the coil. Images had 80x80x80 mm3 voxel resolution, acquired using 54, 52, 34 and 20 diffusion gradient directions (b = 7000, 5000, 3000 and 1000 s/mm2, respectively; δ/Δ=4.9/10.84 ms), along with 20 non-diffusion weighted images, using a 3D segmented EPI acquisition (8 segments, TR/TE=250/25.19 ms, 200 kHz bandwidth). Total scanning time: 15 hours. DW-MRI processing: Images were denoised 7, corrected for bias field inhomogeneities 8 and eddy current distortions 9 (Figure 1). For multi-shell multi-tissue CSD computation 10, estimation of the white matter response function (RF) was restricted to voxels within normal optic nerves; the three tissue RFs were averaged among all specimens and the resulting mean RF was used to compute fiber orientation distribution functions (fODF) for each specimen. Manually-drawn ROIs were delineated at the level of each optic nerve and at the center of the chiasm. Metrics obtained for each lobe of the fODF were: apparent fiber density (AFD), peak lobe amplitude, dispersion and complexity. Multi-tensors were estimated using multi-resolution discrete-search (MRDS 5), which derives tensor metrics corresponding to each fiber bundle, namely volume fractions, fractional anisotropy (FA), and axial (λll), radial (λ┴) and mean diffusivities (MD). The (single) tensor model was fitted and evaluated at the level of the optic nerves.Results and discussion
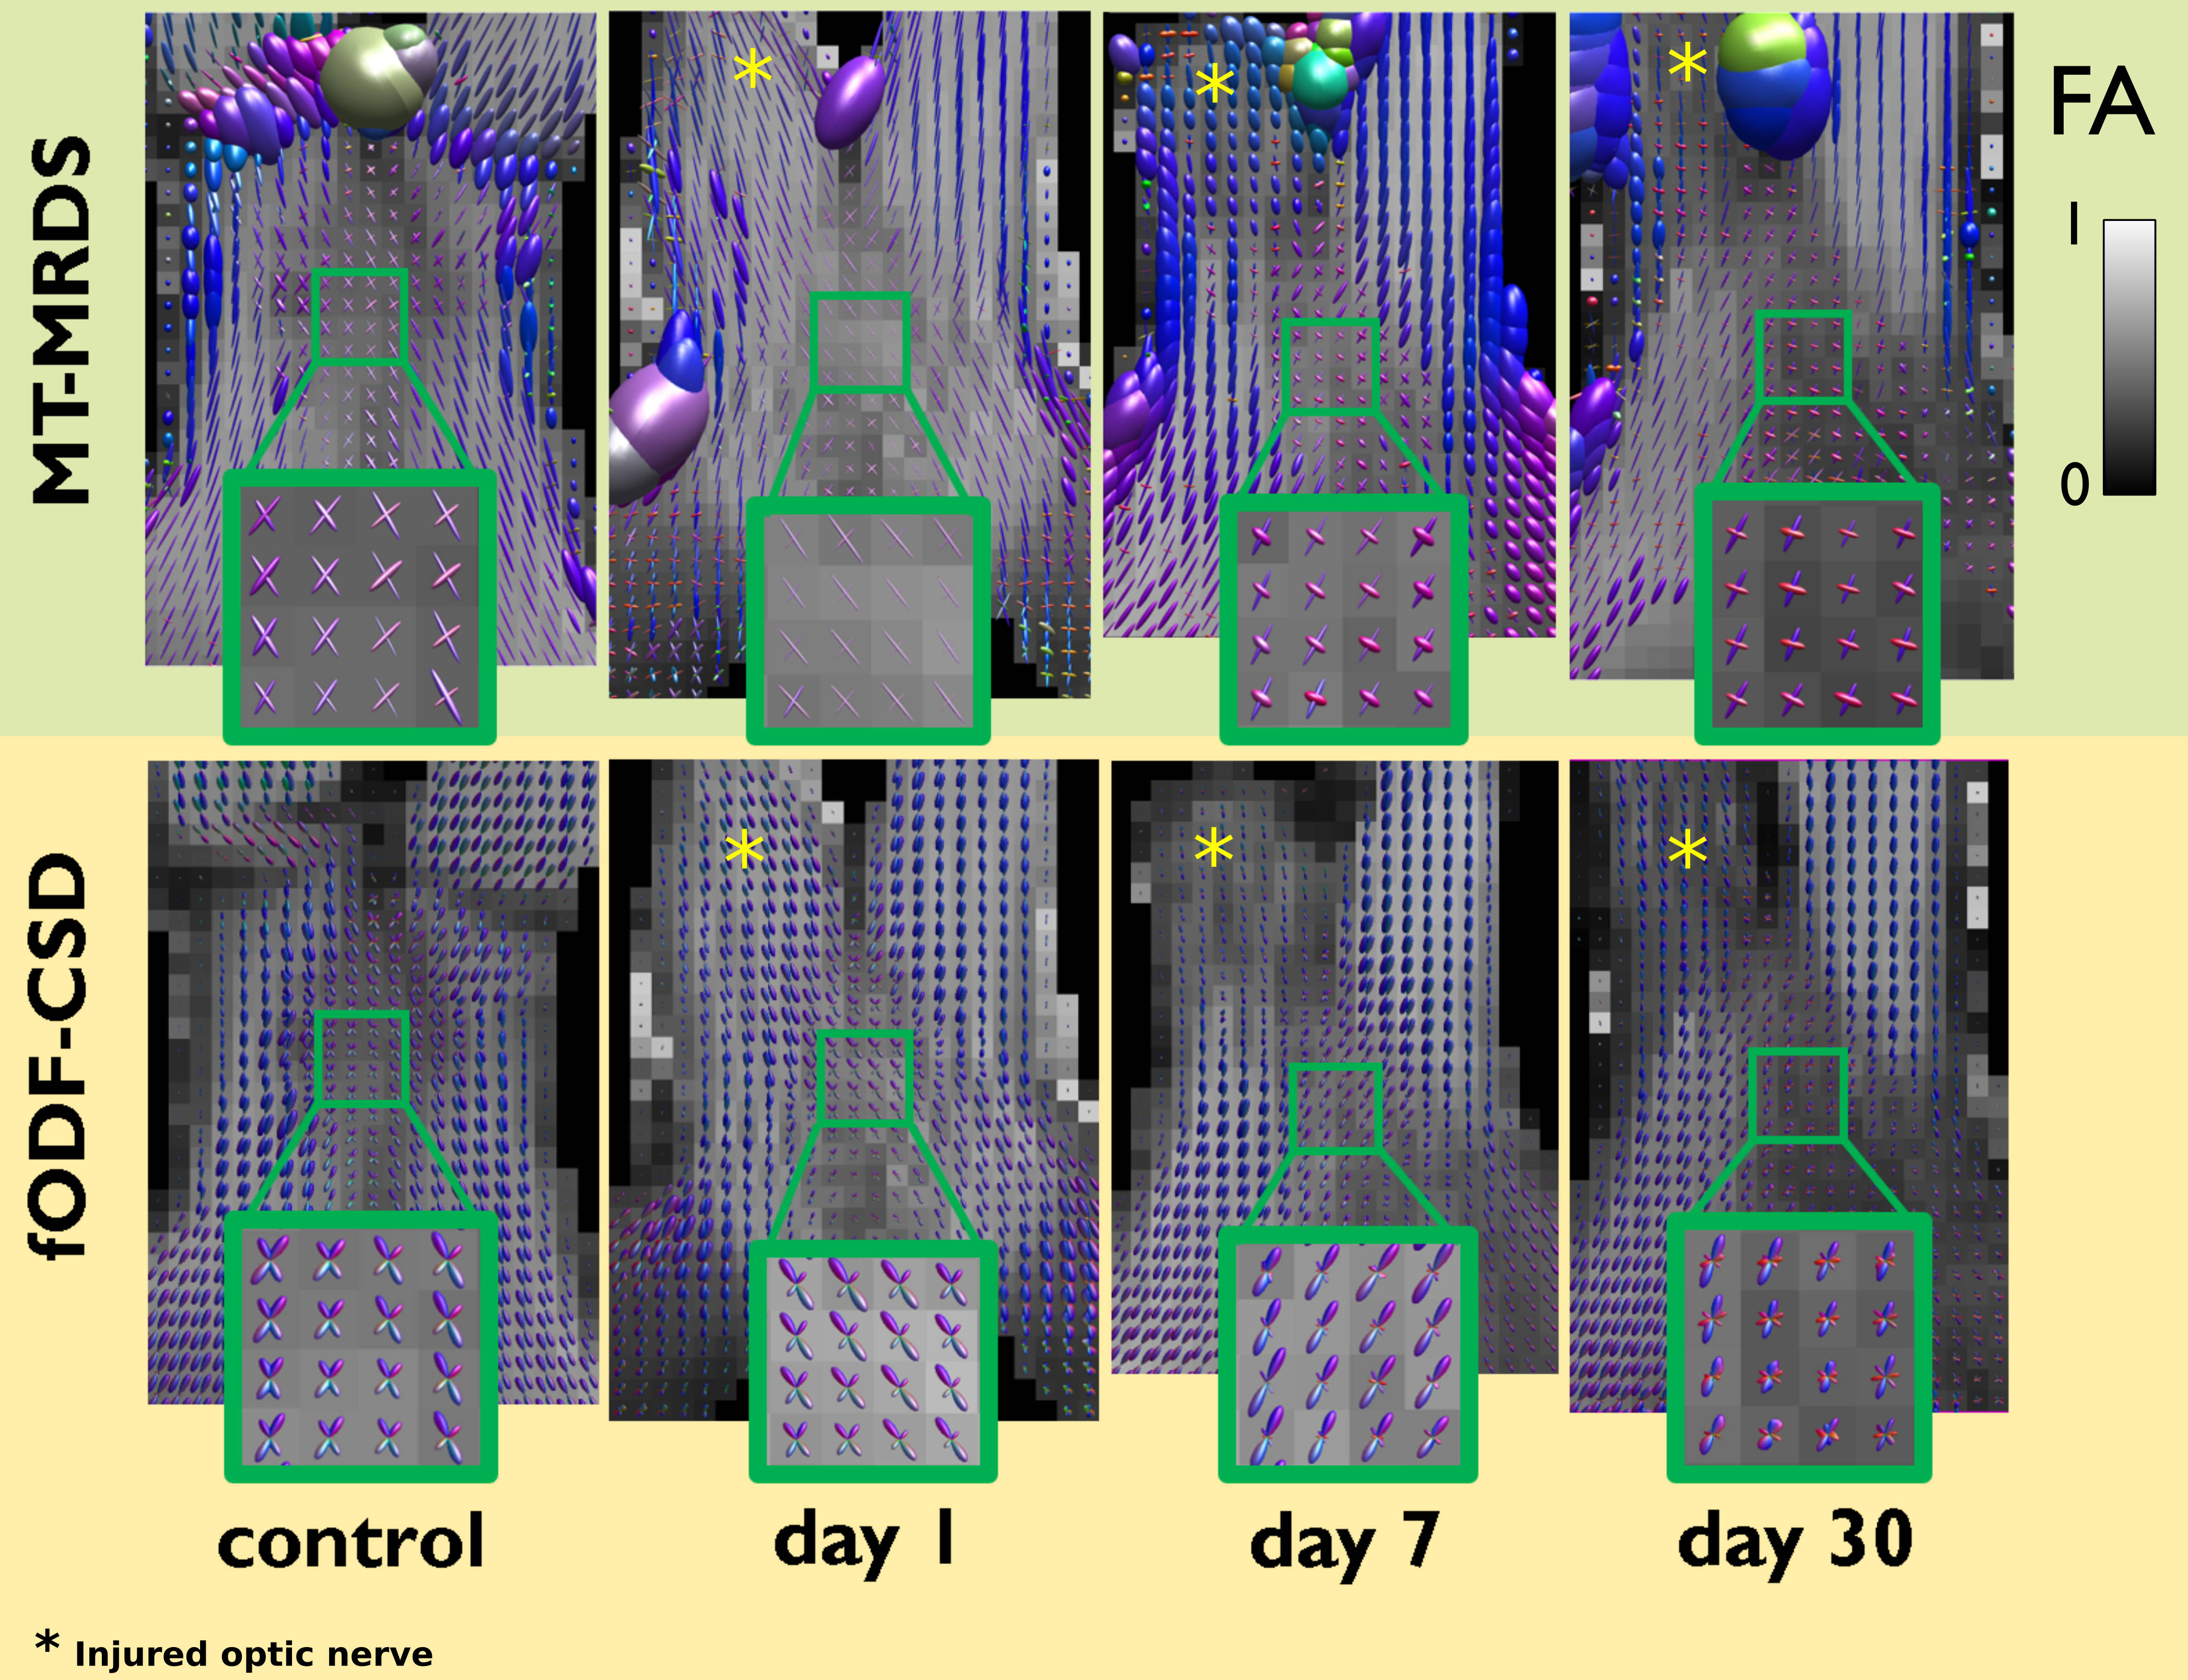
Both multi-fiber methods were able to adequately identify two fiber populations within the optic chiasm in the control and experimental conditions. Multi-fiber methods discerned the damaged and intact fiber populations within the chiasm (Figure 2). Reduced FA and λll derived from diffusion tensor model were observed in optic nerves at 7 days post-injury, which remained abnormal at 30 days (Figure 3), consistent with earlier reports 11,12. Tensors derived from MRDS showed an apparent normalization of diffusion metrics of the affected optic nerves at 30 days, which was not seen with single tensor analysis. In the chiasm, tensors derived from the MRDS model showed reduced FA and λll and increased λ┴ of bundles corresponding to the affected nerves at days 7 and 30 post-injury. Using CSD (Figure 4) we found a reduction of AFD at 7 and 30 days in damaged optic nerves, and the same temporal pattern was observed in the optic chiasm for the affected bundles; complexity increased in injured nerves, and was reduced in the affected chiasms, with an increase of dispersion of the intact fiber system. Multi-tensor and CSD derived metrics are sensitive to tissue abnormalities even in presence of crossing fibers, extending the ability to infer tissue microstructure non-invasively in clinical and research settings.Acknowledgements
We thank Juan Ortiz, Gema Martínez and Leopoldo González-Santos for technical assistance. We also thank CONACYT (FC 1782) and UNAM-DGAPA (IG-200117) for financial support. Omar Narvaez receives scholarship support through CONACYT (479776).References
1. Riffert TW, Schreiber J, Anwander A, Knösche TR. Beyond fractional anisotropy: Extraction of bundle-specific structural metrics from crossing ber models. NeuroImage. 2014;100:176–191.
2. Tournier J-D, Mori S, Leemans A. Diffusion tensor imaging and beyond. Magn. Reson. Med. 2011;65(6):1532–1556.
3. Concha et al., Diffusion MRI of axonal degeneration in areas of fiber crossing: Histological correspondence. ISMRM 2017
4. Tournier JD, Calamante F, Connelly A. Robust determination of the fibre orientation distribution in diffusion MRI: non-negativity constrained super-resolved spherical deconvolution. Neuroimage. 2007 May 1;35(4):1459-72.
5. Coronado-Leija R, Ramírez-Manzanares A, Marroquín JL. Estimation of individual axon bundle properties by a Multi-Resolution Discrete-Search method. Med. Image Anal. 2017;42:26-43.
6. Adachi M, Takahashi K, Nishikawa M, Miki H, Uyama M. High intraocular pressure-induced ischemia and reperfusion injury in the optic nerve and retina in rats. Graefes Arch. Clin. Exp. Ophthalmol. Albrecht Von Graefes Arch. Für Klin. Exp. Ophthalmol. 1996;234(7):445–451.
7. Veraart J, Novikov DS, Christiaens D, et al. Denoising of diffusion MRI using random matrix theory. NeuroImage. 2016;S1053-8119(16)30394-9.
8. Tustison NJ1, Avants BB, Cook PA, Zheng Y, Egan A, Yushkevich PA, Gee JC. N4ITK: improved N3 bias correction. IEEE Trans Med Imaging. 2010 29(6):1310-20.
9. M. Jenkinson, P.R. Bannister, J.M. Brady, and S.M. Smith. Improved optimisation for the robust and accurate linear registration and motion correction of brain images. NeuroImage, 17(2):825-841, 2002.
10. Jeurissen B, Tournier JD, Dhollander T, Connelly A, Sijbers J. Multi-tissue constrained spherical deconvolution for improved analysis of multi-shell diffusion MRI data. Neuroimage. 2014 103:411-426.
11. Song SK, Sun SW, Ju WK, et al. Diffusion tensor imaging detects and differentiates axon and myelin degeneration in mouse optic nerve after retinal ischemia. Neuroimage. 2003;20(3):1714–22.
12. Sun S-W, Liang H-F, Cross AH, Song S-K. Evolving Wallerian degeneration after transient retinal ischemia in mice characterized by diffusion tensor imaging. NeuroImage. 2008;40:1–10.
Figures