3593
Apparent diffusion coefficient: Early Indicator of Atheroembolic Renal Disease1Peking University First Hospital, Beijing, China
Synopsis
Atheroembolic Renal Disease (AERD) is part of a multisystemic disease and has a strong clinical impact on patient and renal survival. Its early diagnosis has a valuable prognostic meaning and huge impact on treatment planning. The tissue edema in early-stage AERD makes DWI a perfect tool for early diagnosis of AERD. In this study, we investigated the role of DWI to noninvasively detect AERD as well as the correlation between ADC values and disease severity identified by histology in an early stage.
Introduction
Atheroembolic Renal Disease (AERD) is part of a multisystemic disease caused by showers of cholesterol emboli from the atherosclerotic aorta to many organs and has attracted enhanced attention due to their high incidence in elderly population1. AERD has a strong clinical impact on patient and renal survival. Thus, its early diagnosis has a valuable prognostic meaning and huge impact on treatment planning. One of the characteristics of early-stage AERD is the tissue edema induced by inflammation reaction. Previous studies showed that lower apparent diffusion coefficient (ADC) values could occur as a result of cellular swelling, with a concomitant reduction in and increased tortuosity of the extracellular space2. This indicates that the DWI has the potential to be served as a biomarker for early diagnosis of AERD. In this study, we investigated the role of DWI to noninvasively detect AERD as well as the correlation between ADC values and disease severity identified by histology in an early stage.Method
Animal Study
Animal experiments were carried out in accordance with guidelines and approval of the Animal Care and Use Institutional Committee. A total of fifteen New Zealand White rabbits (weight range 2.5-3.5 kg) were included in this study. All animals were anesthetized with isoflurane during the AERD model-making and MRI scanning. The unilateral AERD model was induced by injection of microspheres under DSA guidance. The kidneys of all rabbits were removed and hematoxylin-eosin-crocus staining (HES) was performed and analyzed by an experienced renal pathologist. The animals were divided into three groups according to the histology findings: control group, mild AERD, and severe AERD.
MR Imaging
MRI was performed on a 3T clinical MRI system (Achieva, Philips Medical Systems, Best, The Netherlands). An 8-channel knee coil was used. DWI images were obtained two hours after the embolization operation with a spin echo echo-planar imaging (SE-EPI) sequence: TR = 3000ms, TE = 65ms, FOV = 150mm x 150mm, matrix size = 128 x 128, NEX = 2, b values = 0, 1000 s/mm2.
Image Analysis
Evaluation of the anonymized images was carried out. All data were interpreted by two radiologists in a blind, randomized fashion (reader A: 10 years of experience in abdominal MRI, reader B: 12 years of experience in abdominal MRI). For all experiments, T2W images were first used as a guide to lesion and tissue locations, and mono-exponential ADC parameter maps were then calculated and assessed. Lesion and normal tissue contours were delineated on DWI images by reader A and saved as binary masks. Pixels inside contours were set to 1, while the others to 0. The delineated masks were loaded and multiplied with corresponding ADC map using Matlab (MathWorks, Natick, MA). The mean and standard deviation of ADC values were finally calculated. Correlation between ADC and disease severity was analyzed by Spearman rank correlation. P<0.05 was considered significant.
Results
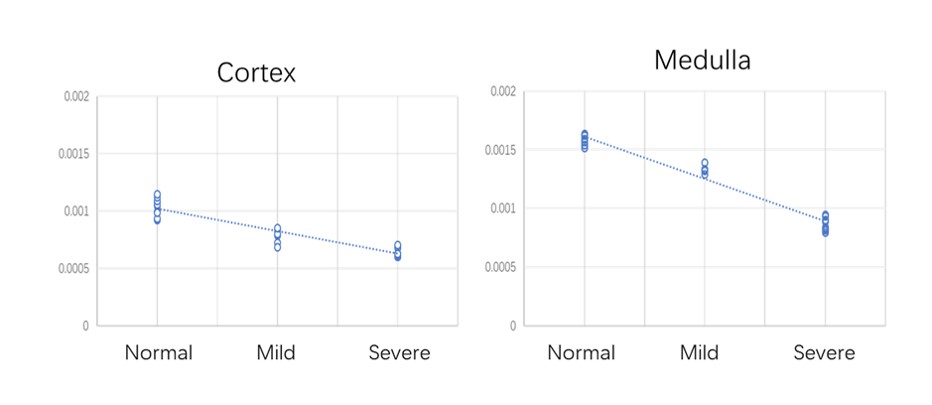
Typical lesion depiction comparisons are shown in figure 1. For the first severe injury case (Fig 1 a), clear lesion margin and strong contrast between lesion and normal tissue are observed in DWI. In another severe injury case (Fig 1 b), renal injury with low signal intensity is easily identified in DW image. For the third case with mild AERD (Fig 1 c), on the DW image, multiple, abnormal, high-intensity signal lesions are observed in the area along the left edge of renal and are further confirmed by histological results. The quantitative ADC values of normal tissues and lesions are analyzed and the results are listed in table 1. Significant differences are found between the ADC values of lesions and normal tissues in both cortex and medulla (P<0.001). The linear regression and scatter diagram of ADC values versus disease severity are plotted and shown in figure 2. An inverse correlation is noted between ADC values and histological findings (r = -0.93, P<0.001 for cortex; r=-0.98 P < 0.001 for medulla).Discussion
DWI with quantification of ADC has been proven to be valuable in renal allografts dysfunction and renal insufficiency3,4. In our study, ADC values in AERD were significantly reduced compared with normal tissue for both cortex and medulla immediately after AERD model induced. A high correlation was obtained between ADC value and disease severity. We believe that the correlation is associated with inflammatory cell infiltration and cell swelling5,6. This finding is valuable in the detection of early cases of AERD and differentiates their severities.Conclusion
DWI was sensitive to AERD lesions and ADC values could be used as noninvasive biomarkers to determine the presence and severity of AERD in an early stage.Acknowledgements
1.Scolari F, Ravani P. Atheroembolic renal disease. The Lancet. 2010;375(9726):1650-1660.
2.Patterson DM, Padhani AR, Collins DJ. Technology insight: water diffusion MRI—a potential new biomarker of response to cancer therapy. Nature Reviews Clinical Oncology. 2008;5(4):220.
3.Inoue T, Kozawa E, Okada H, et al. Noninvasive Evaluation of Kidney Hypoxia and Fibrosis Using Magnetic Resonance Imaging. J Am Soc Nephrol. 2011;22(8):1429-1434.
4.Thoeny HC, De Keyzer F. Diffusion-weighted MR Imaging of Native and Transplanted Kidneys. Radiology. 2011;259(1):25-38.
5.Togao O, Doi S, Kuro-o M, Masaki T, Yorioka N, Takahashi M. Assessment of Renal Fibrosis with Diffusion-weighted MR Imaging: Study with Murine Model of Unilateral Ureteral Obstruction. Radiology. 2010;255(3):772-780.
6.Lebihan D, Breton E, Lallemand D, Aubin ML, Vignaud J, Lavaljeantet M. Separation of Diffusion and Perfusion in Intravoxel Incoherent Motion Mr Imaging. Radiology. 1988;168(2):497-505.
References
No reference found.Figures