3589
Application of DTI and DWI quantitative parameters in differential diagnosis of uterine sarcoma and degenerated hysteromyomaMiao Niu1, Ailian Liu1, and Lizhi Xie2
1The First Affiliated Hospital of Dalian Medical University, DaLian, China, 2GE Healthcare, MR Research, Beijing, China
Synopsis
To investigate the application of diffusion tensor imaging methods, including Diffusion Tensor Imaging(DTI) and Diffusion Weighted Imaging(DWI) in the differential disgnosis of uterine sarcoma and degenerated hysteromyoma.
Objective
To investigate the application of diffusion tensor imaging methods, including Diffusion Tensor Imaging(DTI) and Diffusion Weighted Imaging(DWI) in the differential disgnosis of uterine sarcoma and degenerated hysteromyoma.Material and Methods
Fourteen cases of uterine sarcoma (US) and thirty cases of degenerated hysteromyoma(DH) including hyaline degeneration and mucinous degeneration were diagnosed by operative pathology from September 2008 to February 2017 in our hospital and were retrospectively analyzed in the current study. The age and average age of US and DH patients were 41 to 85 years old,67.4±9.6 years old and 28 to 62 years old,44.8±8.0 years old respectively. All patients underwent MR examinations on 1.5T MR system with conventional T1WI, T2WI,DWI,DTI and LAVA sequences. DTI and DWI images were post-processed using Functool software on ADW4.6 workstation(Fig1-2). Thereafter, the apparent diffusion coefficient(ADCT) value, fractional anisotropy (FA) value of DTI and ADC value of DWI were achieved by two independent observers respectively. The consistency of the derived parameters by both observers were analyzed using Spearman’s correlation(Table1). If the results agreed well with each other, the average value would be calculated for further statistical analysis. ADCT, ADC and FA values between US and DH were compared by independent t-test and Mann-Whitney U-test, respectively. Receiver operating characteristic (ROC) curve of each parameter was analyzed to compare their diagnostic value in differentiating US and DH(Fig3).Results
The parameters measured by two independent observers were well-matched (correlation>0.75). ADCT(1.108±0.200 x e-9mm2/s), ADC(mean 0.168, range 0.125~0.180) and FA(1.118±0.240 mm2/s ) values were achieved for US group. ADCT (1.624±0.225e-9mm2/s), ADC (mean 0.254, range 0.207~0.318), and FA (1.700±0.096mm2/s) were derived for DH group. Therefore, all DTI and DWI derived parameters were smaller in US group compared to that in DH group (P<0.05). ADCT ≤1.322 ×e-9mm2/s, FA ≤0.192, ADC ≤1.297 mm2/s were critical criteria to diagnose US from DH, based on which the corresponding sensitivity, specificity and AUC were calculated (ADCT: 96.7%, 92.9% and 0.974, ADC: 86.7%, 85.7% and 0.831, FA: 78.6%, 90% and 0.888, respectively)(Table1-3).Conclusion
Both DTI and DWI can effectively distinguish US and DH. DTI quantitative parameters demonstrate better diagnostic efficacy for both diseases , thus, DTI can be used in clinical application for US diagnosis.Discussion
Uterine sarcoma (US) and degenerated hysteromyoma (DH) are two kinds of tumors of the female reproductive system, but prognosis is completely different. Duing to the similarity in images, they often misdiagnosed. So it is very important to distinguish them. The ADC value reflects the change of water molecule diffusion movement, describing the movement speed of water molecules, and negatively related to the degree of water molecule confinement.According to previous studies, malignant tumors are characterized by dense cells, less extracellular matrix, large nuclei, deep staining, and high atypia, thus reducing the diffusion space of intracellular and extracellular water molecules, and decreasing the ADC value. FA value represent the anisotropy of water molecules, reflecting the direction of water molecules movement, and can describe the dispersion of water molecules in three-dimensional space.The FA value is positively correlated with the anisotropy degree of diffusion direction (FA=0 ~ 1) , and the FA value tends to 0, indicating that the dispersion tends to isotropy, while the FA value tends to 1, indicating that the dispersion tends to anisotropy.Acknowledgements
No acknowledgement found.References
[1] Takeuchi M, Matsuzaki K, Harada M. Clinical utility of susceptibility-weighted MR sequence for the evaluation of uterine sarcomas. Clin Imaging. 2018 Oct 13;53:143-150.
[2]DeMulder D, Ascher SM. Uterine Leiomyosarcoma: Can MRI Differentiate Leiomyosarcoma From Benign Leiomyoma Before Treatment? AJR Am J Roentgenol. 2018 Oct 24:1-11.
Figures

Figure1 (①-⑥) uterine sarcoma ① T2 FSE image ②DWI image ③ ADC reconstruction image of DWI (ROI placed in the center of the lesion, to avoid cystic degeneration, necrosis, bleeding, get ADC value) ④ DTI image ⑤ ADCT reconstruction image of DTI (ROI placement is as same as DWI, get ADCT value) ⑥ FA reconstruction image of DTI(ROI placement is as same as DWI, get FA value)
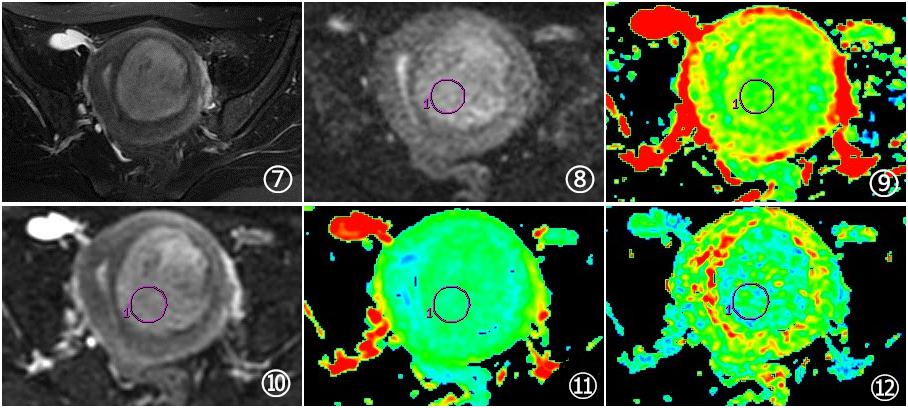
Figure2 (①-⑥) degenerated hysteromyoma ① T2 FSE image ②DWI image ③ ADC reconstruction image of DWI④ DTI image ⑤ ADCT reconstruction image of DTI ⑥ FA reconstruction image of DTI

Table.1 ADCT value, FA value, ADC value, and ICC conformance tests were measured by two independent observers

Table.2 ADCT value, FA value, and ADC value were compared between two groups

Table.3 The AUC, diagnostic threshold, sensitivity, specificity of ADCT value, FA value and ADC value, respectively

Fig.3 ROC curve of ADCT value, FA value and ADC value for the diagnosis of US and DH