3585
Quantitative Sodium Pump Activity, Cellularity, and Cytometry: In Vivo Analytical Pathology from DWI1Advanced Imaging Research Center, Oregon Health & Science University, Portland, OR, United States, 2Home, Mill Creek, WA, United States, 3Radiology, University of Colorado Denver, Aurora, CO, United States, 4Surgery, Oregon Health & Science University, Portland, OR, United States
Synopsis
With cellular ensembles featuring stochastic geometries, Monte Carlo random walk simulated DWI b-space decays exhibit sensitivity to cell biology parameters measuring membrane Na+,K+‑ATPase [NKA] activity, cell density, ρ, and voxel average cell volume, <V>. Furthermore, the simulation matching the experimental in vivo human cerebral cortex b‑space decay has parameters [cellular water efflux rate constant <kio> = 2 s-1, ρ = 98,000 cells/μL, and <V> = 8.2 pL] in near absolute agreement with the most pertinent literature. Inspecting the common, empirical early decay measure, ADC, of these simulations provides insights into acute and chronic tissue property changes in vivo.
Introduction
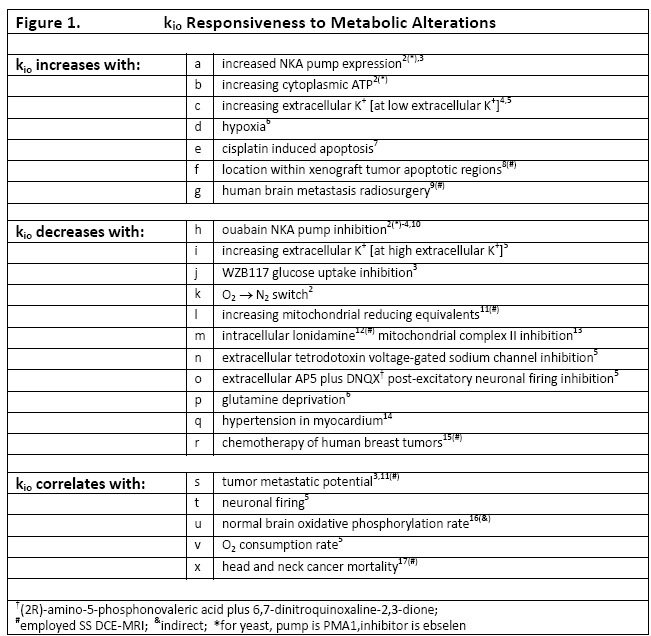
Though the Sodium Pump, NKA, may be biology’s most vital enzyme,1 its homeostatic activity – the cellular metabolic rate [cMRNKA] - has never been measurable in vivo. The pseudo‑first-order, steady-state cellular water efflux rate constant [kio] has a significant cMRNKA contribution,1 and responds to many metabolic alterations, Figure 1. Precise kio from 1H2O MR is possible if the longitudinal shutter-speed [κ1] is sufficiently large; only when the extracellular contrast agent (CA) concentration is very high1 or B0 is very low,3 neither achieved in clinical MRI. A new diffusion-weighted imaging [DWI] analysis requires neither CA nor κ1, and yields the irreducible, fundamental properties: cell density [ρ] and mean cell volume <V>, as well as <kio>.1 ρ and <V> have also not been available in vivo.Methods
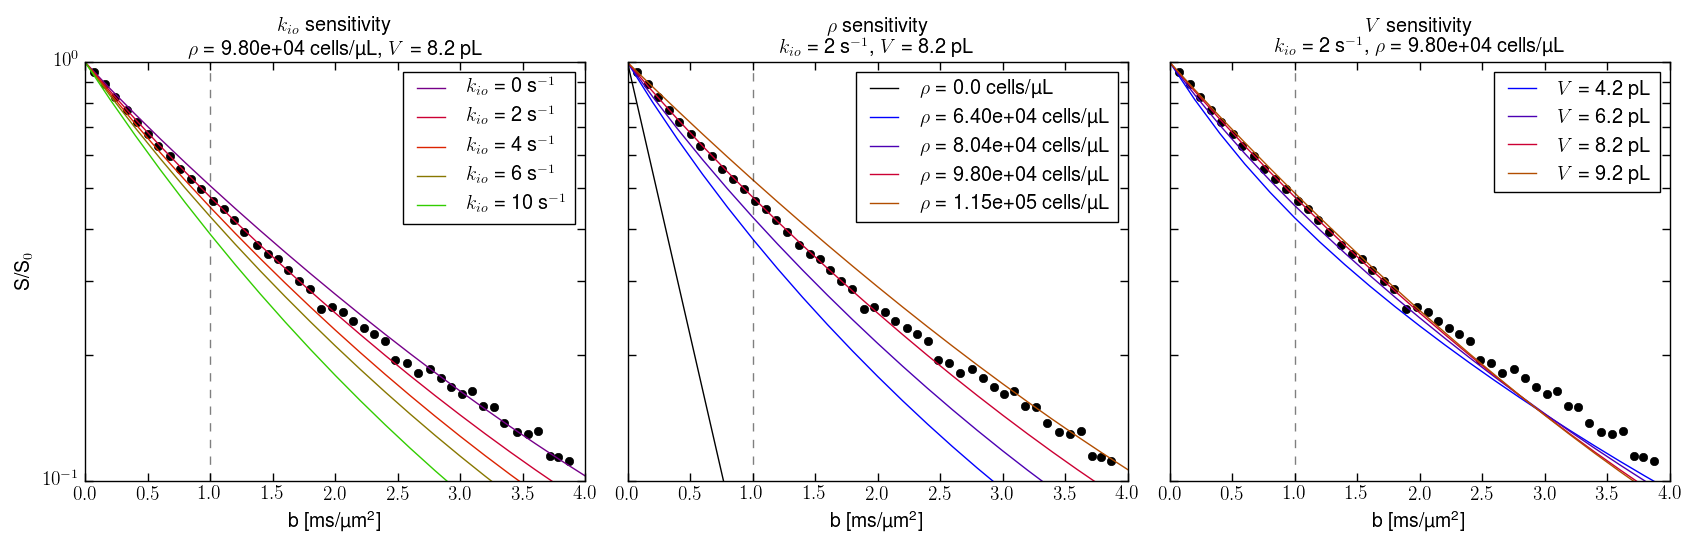
We use Monte Carlo random walks in randomly sized/shaped [“Voronoi”] cell ensembles [separately submitted]. Figure 2 presents simulations varying each parameter in turn: 100 walks in 120 different ~ 19,000 cell ensembles. All particles had the 37oC pure water diffusion coefficient [D0 = 3.0 μm2/ms] inside or outside cells. The ordinates measure log[S(b)/S0], where S(b) and S0 are the D-w and Boltzmann transverse signal intensities. The abscissae report the diffusion MR coherence decay measure: b ≡ (γGδ)2tD. [The b unit here, ms/(μm)2, is 1000 times the common s/(mm)2.]Results
With ρ fixed at 98,000 cells/μL, <V> at 8.2 pL [the intracellular volume fraction, vi = ρ<V> = 0.80], Fig. 2,left shows increasing <kio> increases the non-linear [non‑Gaussian] decay. With <kio> fixed at 2.0 s-1, <V> at 8.2 pL, Fig. 2,middle reveals increasing ρ decreases the decay. The decay is ρ-sensitive, but over a large, 51,000 cells/μL, range [64,000 to 115,000]. With ρ fixed at 98,000 cells/μL, <kio> at 2.0 s-1 Fig. 2,right shows little V‑dependence, even with a <V> doubling averaged over nearly 105 cells.Discussion
We choose quality awake human cerebral cortex experimental data18 (3.3 mL ROI; Fig. 2, points) also because the only rigorous, absolute model and ex vivo kio and ρ values are cortical.1 One simulation (red in each panel) matches the data remarkably well. More gratifying, its parameters, <kio> = 2.0 s-1, ρ = 98,000 cells/μL, and <V> = 8.2 pL, are in excellent agreement with literature cortical <kio> = 2 s-1, ρ = 88,000 cells/mL, and <V> values:1 and we have not conducted a formal fitting. Also, the Fig. 2,middle pure water, ρ = 0, black [Gaussian] line agrees with that for living human brain ventricular, acellular water [ADC, 3 μm2/ms].1 Fig. 2 suggests the probabilities of encountering and of permeating cell membranes are the major diffusion determinants, not “viscosity” considerations. It seems <kio>, ρ, and <V> are sufficient to characterize tissue water diffusion.
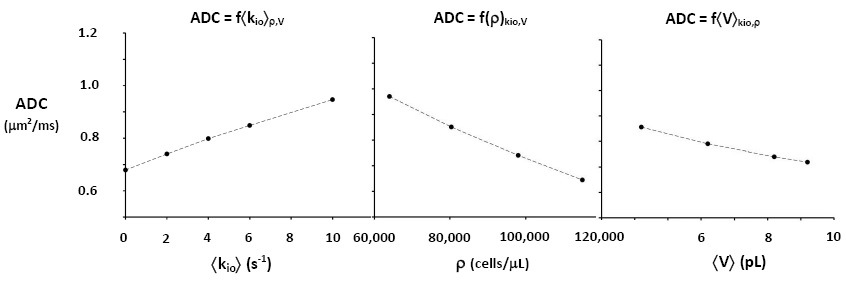
The ultimate goal is fitting entire experimental voxel b decays to produce absolute <kio>, ρ, and <V> parametric maps [during iterations, the variables will interact]. However, we can appraise clinical implications with the empirical ADC values as commonly employed, from only the initial decay. We use the conventional b = 1 [Fig. 2 vertical dashed lines] to determine the asymptotic {ln[S(b)/S0]/b} slope [-ADC], for each Fig. 2 curve. Figure 3,left shows ADC = f<kio>ρ,V; Fig.3,middle, ADC = f(ρ)kio,V; and Fig. 3,right, ADC = f<V>kio,ρ [i.e., f<V>kio,ρ is the ADC <V>-dependence at constant <kio> and ρ]. In Fig. 3,left, the ADC value increases rather linearly with <kio>. Since kio reflects a fast metabolic rate [cMRNKA],1 this suggests acute ADC changes1 are dominated by fast cMRNKA changes. Most Fig. 1 kio changes are acute. Fast literature ADC changes1 are often attributed to <V> changes (e.g., “swelling”), but Fig. 3,right indicates ADC has very weak <V>‑sensitivity, for a large <V> change. Figure 3,middle shows ADC decreases rather linearly with ρ. However, large cellularity changes, > 1000 cells/μL, are required. Thus, ρ effects could dominate chronic ADC changes: cancer cell bed ρ can exceed 106 cells/μL, with very small <V>.1 Effective therapy increases the small malignant tumor ADC.1 But, we expect <kio> should give a faster response. Fig. 3 is also in general agreement with literature values reported for in vivo human brain cortex, ADC = 0.83 (μm)2/ms.1 For our Fig. 2,left kio = 2 s-1 (red) curve, ADC is 0.73 (μm)2/ms. This is quite gratifying: an actual fitting of the cortical data might return an awake human brain <kio> ~5 s‑1; the value suggested by ADC ~0.83 (μm)2/ms in Fig. 3,left. Furthermore, our DWI approach is complementary to those focusing on the tissue water anisotropic D tensor nature.
Acknowledgements
Grant Support: NIH: R44 CA180425, Brenden-Colsen Center for Pancreatic Care.References
1. Springer, JMR, 291:110-126 (2018). 2-17. See Fig. 1 legend. 18. Clark, Le Bihan, MRM, 44:852-859 (2000).Figures