3582
A Graph Theory and Spectral Graph Theory Approach to Correlating Tractography with Parkinson’s Disease.1Physics, University of Florida, Gainesville, FL, United States, 2Clinical and Health Psychology, University of Florida, Gainesville, FL, United States, 3Biochemistry and Molecular Biology, University of Florida, Gainesville, FL, United States
Synopsis
Diffusion imaging is a potentially powerful tool for analyzing the effect of Parkinson’s disease on the brain. DWI analysis may provide some insight into how Parkinson’s disease may affect low executive or low memory functioning in the brain on a structural level. This research aims to analyze the complexity of the brain connectivity using graph theory and spectral graph theory to correlate structural differences between the brains of Parkinson’s patients with low memory functioning or low executive functioning, and controls.
Introduction
Due to the complexity of brain structure, analyzing the effect that a disease, such as Parkinson’s, can be difficult. Diffusion tractography provides information about macroscropic structural connections between different brain regions4, and may be used to help understand the effects that Parkinson’s disease has on the brain structure5. In this study, a graph theory and spectral graph theory approach based on tractography is applied to quantify differences between a control group, participants with Parkinson’s disease and low executive function, and participants with Parkinson’s disease and low memory function.Methods
45 (16 controls, 14 low memory, 15 low executive) participants were scanned on a Siemens 3 T Verio with an 8-channel head coil. Single shot echo planar diffusion-weighted images were acquired with 73 contiguous axial slices and an isotropic voxel resolution of 2 mm. The TR/TE were set to 17,300/81 ms with gradients in 6 (b = 100 s/mm2) and 64 (b = 1000 s/mm2) directions. Diffusion images were interpolated to 1 mm3 using cubic convolution, and then corrected for patient motion and eddy current induced distortions6. The diffusion data was then analyzed using a Mixture of Wisharts diffusion model3, and the brain was segmented into 68 cortical and 14 subcortical regions for a total of 82 regions of interest (ROI) nodes that span the gray matter using FreeSurfer 5.3. Whole brain deterministic tractography was performed using 125 seeds per voxel with in-house code to determine streamline connectivity between the 82 nodes then analyzed using graph theory metrics.The resulting connected network for each participant was used to create an adjacency matrix that represents the connection between all of the nodes in pairs. The Euclidean distance between node pairs were computed to examine the distribution of node pair connections of different lengths. The values were then compared between brains of healthy control subjects, the low executive the low memory functioning group. Graph theory was used to calculate the network density, based on the number of tracts that connected all nodes. These connections, as well as the node degree, were used to compute Laplacian matrices for each participant. These Laplacian matrices are defined with 1’s down the diagonal and as the ijth entry where Di = degree of the ith node and Dj = degree of the jth node2. Then the eigenvalues of the reduced Laplacian matrices were computed. Spectral graph theory was used to extract the algebraic connectivity and the network energy. The algebraic connectivity was determined by calculating the second smallest eigenvalue from the Laplacian matrices2. The network energy was determined by calculating the eigenvalues of the adjacency matrix and summing over the absolute values of the eigenvalues1.Results
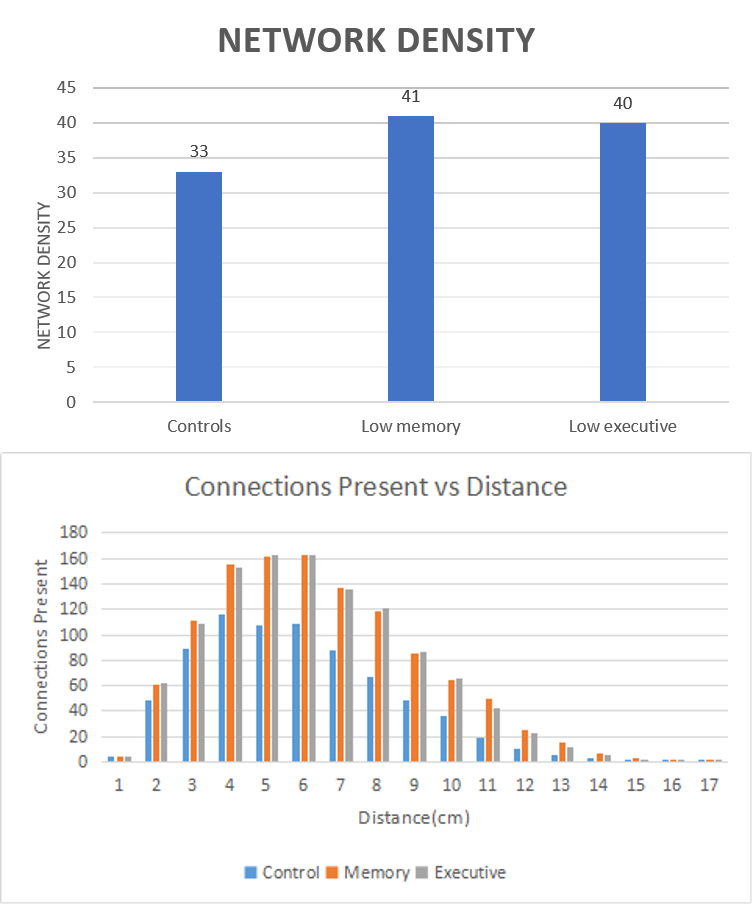
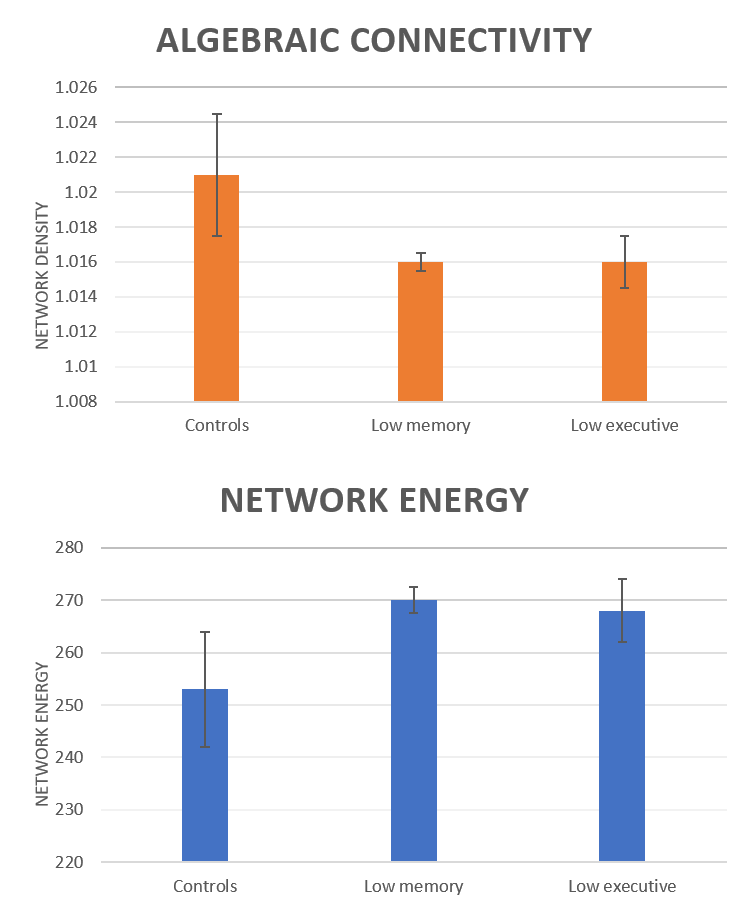
The graph theory and spectral graph theory metrics show a difference between the control group and the low executive and low memory functioning groups. The network density was greater in the low-executive-function group (40.2) and the low-memory-function group (40.8) compared to the control group (33), as shown in Figure 1. The number of connected nodes drops off as the Euclidean distance increases between nodes, as shown in Figure 1. However, the control group shows a smaller number of connections at higher distances when compared to the low executive and low memory functioning group. The algebraic connectivity is shown in Figure 2 and displays a network difference between the control group (1.021 +/- .005) and the low executive (1.016 +/- .0015) and the low memory (1.016 +/- .0005) groups. The network energy was higher in the low executive (268 +/- 6) and the low memory (270 +/- 2.5) groups compared to the control (253 +/- 11) groups. These results show that the metrics derived from both graph theory and spectral graph theory lead to distinct structural differences summarized I these graph metrics between the subtypes of Parkinson’s disease and the control group.Discussion
Graph theory and spectral graph theory were used to correlate low executive and low memory functioning groups with changes in the brain connectivity. These results seem to show a quantifiable difference between these groups and the control groups. While an understanding of how these metrics directly relate to the brain structure is not well understood, these metrics may be powerful tools in characterizing Parkinson’s disease subtypes, and can potentially be use as biomarkers and classification metrics. Future works of this project will involve combining these metrics with cognitive test scores and machine learning to determine classification ability.Acknowledgements
A portion of this work was performed in the Advanced MRI/S (AMRIS) Facility at the McKnight Brain Institute of the University of Florida, which is part of the National High Magnetic Field Laboratory (supported by National Science Foundation Cooperative Agreement DMR-1157490, the State of Florida, and the U.S. Department of Energy). In addition, this work is supported in part by the NIH grants R01NS082386 and R01NR0141181.References
1. Daianu, M., Mezher, A., Jahanshad, N., Hibar, D. P., Nir, T. M., Jack, C. R., Weiner, M. W., Bernstein, M. A., ... Thompson, P. M. (2015). SPECTRAL GRAPH THEORY AND GRAPH ENERGY METRICS SHOW EVIDENCE FOR THE ALZHEIMER'S DISEASE DISCONNECTION SYNDROME IN APOE-4 RISK GENE CARRIERS. Proceedings. IEEE International Symposium on Biomedical Imaging, 2015, 458-461.
2. Chung, F. R. K. (1997). Spectral Graph Theory. : American Mathematical Society.
3. Colon-Perez, L. M., Spindler, C., Goicochea, S., Triplett, W., Parekh, M., Montie, E., Carney, P. R., Price, C., … Mareci, T. H. (2015). Dimensionless, Scale Invariant, Edge Weight Metric for the Study of Complex Structural Networks. PloS one, 10(7), e0131493.
4. Hagmann, P., Kurant, M., Gigandet, X., Thiran, P., Wedeen, V. J., Meuli, R., & Thiran, J. P. (2007). Mapping human whole-brain structural networks with diffusion MRI. PloS one, 2(7), e597.
5. Jian, B., Vemuri, B. C., Ozarslan, E., Carney, P. R., & Mareci, T.H.(2007). A novel tensor distribution model for the diffusion-weighted MR signal. NeuroImage, 37, 164-176.
6. Andersson, J. L. R. & Sotiropoulos, S. N. An integrated approach to correction for off-resonance effects and subject movement in diffusion MR imaging. Neuroimage 125, 1063–1078 (2016).
7.(2012). FreeSurfer. NeuroImage, 62(2), 774-81.
Figures