3580
A diffusion MRI pipeline leveraging Nextflow & Singularity: Robust, Efficient, Reproducible in time!1Sherbrooke Connectivity Imaging Laboratory (SCIL), Université de Sherbrooke, Sherbrooke, QC, Canada, 2Imeka Solutions Inc, Sherbrooke, QC, Canada
Synopsis
How do we assure a diffusion MRI processing pipeline that is: i) deterministic, i.e. given two runs of the pipeline on the same data, the same output is returned, ii) reproducible in time, and iii) efficient? Diffusion MRI has several processing steps that may not be reproducible between multiple runs. This reproducibility varies because of the parameters, multi-threading and the versions of the tools used. Moreoever, processing time for a large database can take several hours when each step are ran sequentially. To solve these problems, we developed a reproducible and efficient diffusion MRI pipeline based on Nextflow and Singularity.
Introduction
In diffusion MRI (dMRI), several processing steps are necessary to obtain diffusion measures and a whole brain tractogram. The different steps of processing are based on multiple dependencies such as FSL1, Mrtrix3 (www.mrtrix.org), ANTS2, DiPy3, in-house tools. These dependencies sometimes require a long and complicated setup phase. These libraries also evolve in time, making it difficult to reproduce the exact same outputs several months to years later. Running the different steps can take hours for each subject and, if steps are not correctly configured, the results can be unreproducible. To solve these problems, we created a dMRI pipeline, based on Nextflow4 and Singularity5.Methods
- Pipeline
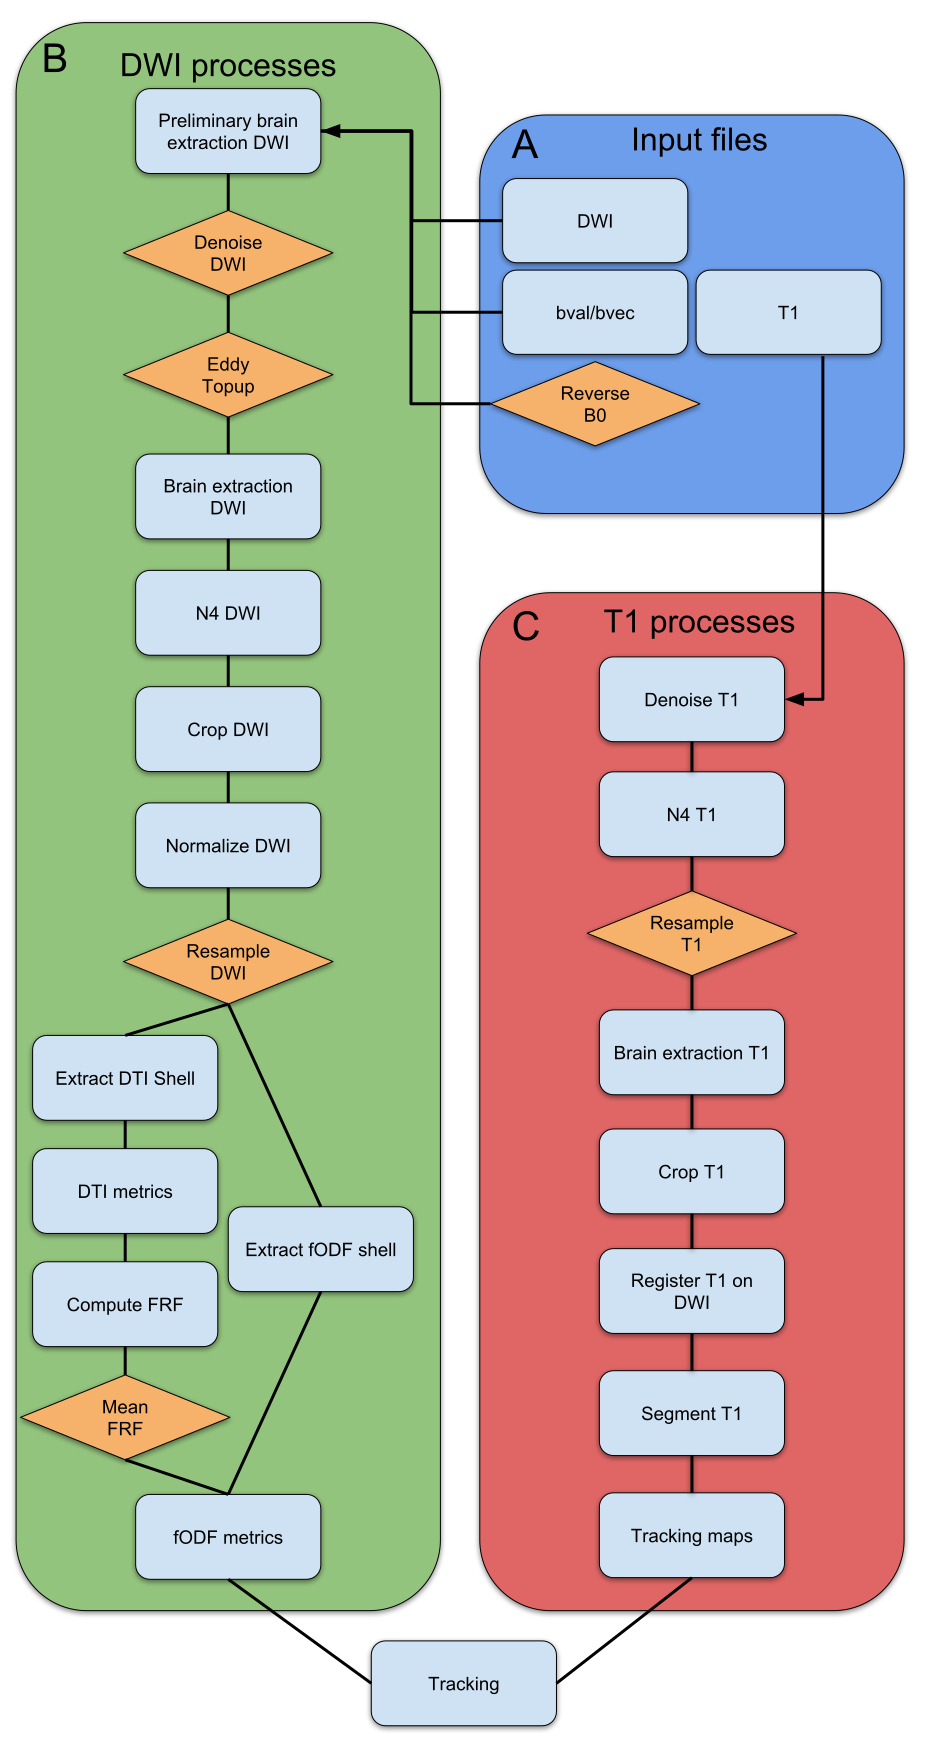
The pipeline consists of 23 different steps. The input data is the DWI, the b-values and the b-vectors and the T1 weighted image (Figure 1.A). A reversed phase encoded b=0 image can be given to apply the deformation field computed using Topup6, 7. The DWI processing consists of 14 steps (denoising, topup/eddy, N4 bias correction, normalization, DTI and fODF metrics) that processes the raw DWI up to the fODF reconstruction8, 9 (Figure1.B). Then, T1 anatomy related steps run (denoising, N4 correction, registration, tissue segmentation) to obtain the tracking maps (Figure 1.C). The fODF and the tracking maps are then used to perform particle filter tractography10. All parameters used across the steps can be modified in a json configuration file. Parameters in the configuration file, as the random number generator parameter or the number of threads, guarantee reproducibility of the pipeline.
Nextflow4 is a pipeline creation tool that is easy, parallelizable, and that supports software containers. Nextflow allows to have a fully automated pipeline that computes subjects in parallel from the raw DWI to the tractogram. Singularity5 is a software container that stores dependencies. Here, the Singularity container regroups the dependencies enumerated in introduction.
The pipeline was ran on a cluster node with 48 cores and 100 Gb of RAM. For each subjects, the pipeline computes all DTI and fODF measures then performs a whole brain tractography, seeding from a WM mask, with 10 seeds per voxel.
- Dataset
To illustrate the reproducibility and runtime of the pipeline, 30 subjects of an in-house database11 were processed. For each subject, DWI, T1 and reversed phase encoded b=0 image were acquired on a 1.5 Tesla MRI (SIEMENS Magnetom). The DWI was acquired along 64 directions, with b=1000 mm2/s and one b=0 mm2/s image. The spatial resolution of the DWI and T1 is respectively 2mm and 1mm isotropic.
- Analysis
To evaluate the reproducibility, our pipeline was ran 3 times on the whole dataset and was compared to a "standard" pipeline, which did not set the random number generator parameter and used default multi-threading of tools. For each subject, each metric of each run was compared by computing the mean correlation coefficient. For each subject, each tracking of each run was compared by computing the percentage of identical segments of streamlines. The number of streamlines, min, max and mean length were also compared from each run.
Results
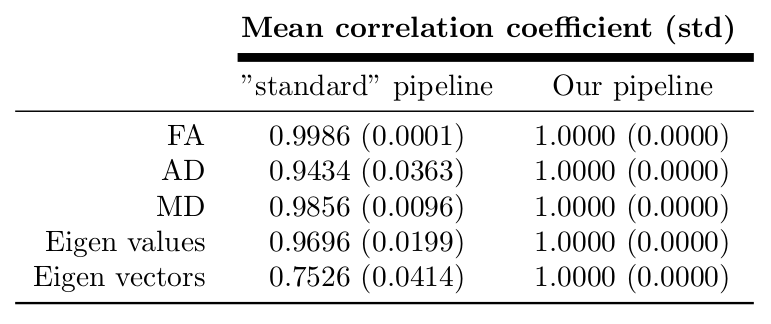
As seen in Table 1, DTI measures generated are 100% reproducible with our pipeline. For a "standard" pipeline, the lowest correlation coefficient is 0.75 while for our pipeline the correlation coefficient is 1.00 for all metrics (Table 1). Comparing the tractograms of 3 runs, the mean reproducibility is 98% across the 30 subjects. The tractograms are not fully reproducible due to small differences in tracking maps. These differences come from the multi-threading of the T1 brain extraction and registration processes. To have a 100% reproducible pipeline, some steps need to be single-threaded. This leads to a slightly longer runtime, but guarantees the reproducibility of the T1 brain extraction and registration steps.
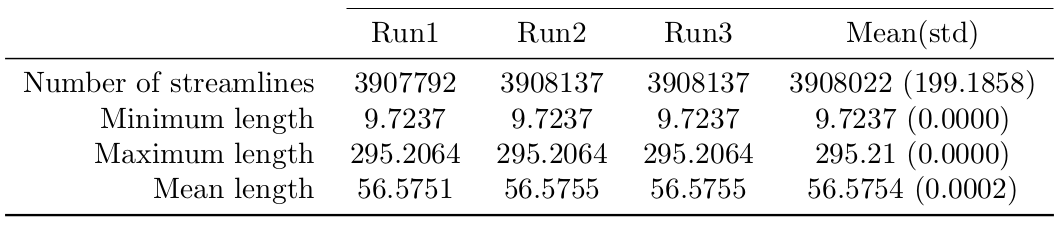
In Table 2, streamline measures are extracted and shown for one subject. Runs 2 and 3 are 100% reproducible. Between runs 1 and 2, a small difference of 0.009% in the number of streamlines is observed. Across the 3 runs, no difference in min and max lengths is noticed. Between runs 1 and 2 a small difference is discerned in the mean length.
Conclusion
Using our Nextflow pipeline, it is possible to process dMRI databases with little, to no installation steps, when using a Singularity container. This container can then be re-used in time to assure reproducibility. Moreover, the pipeline processes databases efficiently (17 hours 12 min for 30 subjects) and the results are reproducible at 98%. 100% reproducibility can be reached with a slightly longer runtime. This is a important step towards efficient and reproducible dMRI pipelines for academia, the industry and the clinic.Acknowledgements
The authors would like to thank the Fonds de recherche du Québec – Nature et technologies (FRQNT), the NSERC Discovery grant from Pr Descoteaux and Mitacs Accelerate for funding this research. We also thank the Université de Sherbrooke institutional chair in neuroinformatics for their support.References
[1] M. Jenkinson, C. F. Beckmann, T. E. Behrens, M. W. Woolrich, and S. M. Smith, “Fsl,” Neuroimage, vol. 62, no. 2, pp. 782–790, 2012.
[2] B. B. Avants, N. Tustison, and G. Song, “Advanced normalization tools (ants),” Insight j, vol. 2, pp. 1–35, 2009.
[3] E. Garyfallidis, M. Brett, B. Amirbekian, A. Rokem, S. Van Der Walt, M. Descoteaux, and I. Nimmo-Smith, “Dipy, a library for the analysis of diffusion mri data,” Frontiers in neuroinformatics, vol. 8, p. 8, 2014.
[4] P. Di Tommaso, M. Chatzou, E. W. Floden, P. P. Barja, E. Palumbo, and C. Notredame, “Nextflow enables reproducible computational workflows,” Nature biotechnology, vol. 35, no. 4, p. 316, 2017.
[5] G. M. Kurtzer, V. Sochat, and M. W. Bauer, “Singularity: Scientific containers for mobility of compute,” PloS one, vol. 12, no. 5, p. e0177459, 2017.
[6] J. L. Andersson, S. Skare, and J. Ashburner, “How to correct susceptibility distortions in spin-echo echo-planar images: application to diffusion tensor imaging,” Neuroimage, vol. 20, no. 2, pp. 870–888, 2003.
[7] S. M. Smith, M. Jenkinson, M. W. Woolrich, C. F. Beckmann, T. E. Behrens, H. Johansen-Berg, P. R. Bannister, M. De Luca, I. Drobnjak, D. E. Flitney, et al., “Advances in functional and structural mr image analysis and implementation as fsl,” Neuroimage, vol. 23, pp. S208–S219,2004.
[8] J.-D. Tournier, F. Calamante, and A. Connelly, “Robust determination of the fibre orientation distribution in diffusion mri: non-negativity constrained super-resolved spherical deconvolution,” Neuroimage, vol. 35, no. 4, pp. 1459–1472, 2007.
[9] M. Descoteaux, R. Deriche, T. R. Knosche, and A. Anwander, “Deterministic and probabilistic tractography based on complex fibre orientation distributions,” IEEE transactions on medical imaging,vol. 28, no. 2, pp. 269–286, 2009.
[10] G. Girard, K. Whittingstall, R. Deriche, and M. Descoteaux, “Towards quantitative connectivity analysis: reducing tractography biases,” Neuroimage, vol. 98, pp. 266–278, 2014.
[11] G. Girard, K. Whittingstall, R. Deriche, and M. Descoteaux, “Structural connectivity reproducibility through multiple acquisitions,” in Organization for Human Brain Mapping, 2015.
Figures