3577
Powering Up Microstructural Imaging: assessing cross-metric and cross-tract statistical power on an ultra-strong gradient MRI system1Cardiff University Brain Research Imaging Centre, Cardiff University, Cardiff, United Kingdom, 2Department of Neuroimaging, King's College London, London, United Kingdom
Synopsis
We present cross-metric and cross-tract assessment of test-retest repeatability for microstructure measures on an ultra strong gradient MRI scanner (CONNECTOM 3T) in the human brain. We show that several MRI metrics of tissue microstructure are reliable and present relative sample sizes required to provide sufficient statistical power across different white matter pathways and microstructure metrics.
Introduction
In the advent of open science and increased demand to pre-register statistical study designs, it is critical that microstructural studies are designed with sufficient statistical power a priori. Comprehensive assessment of test-retest reliability in the same population is lacking in microstructure research. We conducted such a study to show that several MRI metrics of tissue microstructure measured on an ultra strong gradient 3T CONNECTOM MRI scanner are reliable, as demonstrated with statistical measures of variation and correlation. Additionally, we compared relative sample sizes required to ensure sufficiency of statistical power across different microstructure metrics and white matter pathways. Our data suggest that microstructure metrics from McDESPOT1 required the lowest sample size, the macromolecular proton fraction2 and diffusion metrics a larger sample size, and magnetisation transfer ratio2 and restricted diffusion signal fraction3 required the highest sample size to reach statistical power of .84 across various effect sizes for a 2 x 2 between-within ANOVA.Method
MRI brain scans were collected on an ultra strong gradient (300mT/m) 3T MRI scanner (MAGNETOM Skyra CONNECTOM) in six healthy adults (3 female, age range 24-30). Each MRI session lasted approximately 2 hours, and was repeated 5 times within a two-week period. Care was taken to avoid potential diurnal effects by performing scans for each participant at approximately the same time of day. The MRI protocol comprised the following sequences: multi-shell diffusion CHARMED3, multicomponent relaxometry McDESPOT1 and quantitative magnetisation transfer (QMT2, Table 1).
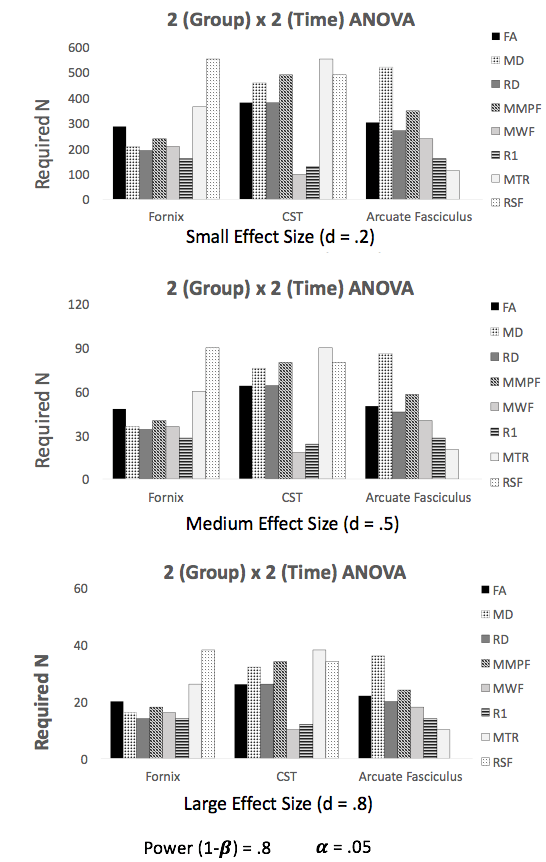
To assess test-retest repeatability, a white matter projection tract (cortico-spinal), association tract (arcuate fasciculus) and the fornix were virtually dissected with probabilistic tractography (MRTrix iFOD214, Fig. 1). Track density maps of the resultant tracts were computed (TDI15) and thresholded to exclude voxels through which streamlines passed less than 20 percent. Metrics were extracted for each vertex along each tract for statistical comparison. The intra-class correlation coefficient (two-way mixed, absolute agreement) and coefficient of variation were computed for assessment of test-retest repeatability (Table 2). Required sample sizes were estimated for a Group (2) x Time (2) between-within groups ANOVA (Fig. 3) across all metrics and tracts at small, medium and large effect sizes to reach statistical power of .84 and significance 𝜶 = .05. Pearson correlation coefficients were used to account for the correlation among repeated measures for sample size estimation (Table 2).
Results
The fornix, arcuate fasciculus and cortico-spinal tracts were successfully dissected bilaterally in each MRI session for each participant (Fig. 1). The coefficients of variation were overall low, ranging between 0.12 to 4.16 percent. Intra-class correlations ranged from .37 to .98 with the majority demonstrating a high degree of repeatability ( >. 7, p <.0001), with the exception of the restricted signal fraction in the arcuate fasciculus, which was subsequently excluded from further analysis (Table 2, Fig. 2). Estimated sample sizes for a 2 x 2 between-within ANOVA with small (.2), medium (.5) and large (.8) effect sizes are presented in Figure 3. Overall, the metrics showed a similar pattern for sample size requirement for the fornix and the cortico-spinal tract. In these tracts, metrics requiring the smallest sample size were the myelin water fraction and longitudinal relaxation (R1). Diffusion metrics (FA, RD, MD) and the macromolecular proton fraction required larger sample sizes, whereas the MTR and the RSF required the largest sample sizes to reach statistical power of .84. In contrast, the arcuate fasciculus demonstrated a pattern in which the diffusion metrics and macromolecular proton fraction required the largest sample size, the myelin water fraction a smaller sample size, and R1 and the MTR the smallest sample size.Discussion
Our data shows that microstructure metrics measured on a high gradient MRI scanner (CONNECTOM 3T) are highly repeatable in white matter microstructure. Additionally, our data provides a framework for cross-metric and cross tract assessment of sample size estimation to sufficiently power studies a priori.Acknowledgements
This work was funded by the Wellcome Trust Investigator Award (096646/Z/11/Z)References
1. Deoni, S. C., Rutt, B. K., Arun, T., Pierpaoli, C., & Jones, D. K. (2008). Gleaning Multi-Component T1 and T2 Information from Steady-State Imaging Data. Mag Res Med, 60, 2008, 1372-1387
2. Wood (2018). QUIT: Quantitative Imaging Tools. Journal of Open Source Software, 3(26), 656.
3. Assaf, Y., Freidlin, R. Z., Rohde, G. K., & Basser, P. J. (2004). New modeling and experimental framework to characterize hindered and restricted water diffusion in brain white matter. Mag Res Med, 52(5), 965–978. https://doi.org/10.1002/mrm.20274
4. Cohen, J. (1988). Statistical Power Analysis for the Behavioral Sciences. Biometrics, 26(3), 588. https://doi.org/10.2307/2529115
5. Veraart, J., Novikov, D. S., Christiaens, D., Ades-aron, B., Sijbers, J., & Fieremans, E. (2016). Denoising of diffusion MRI using random matrix theory. NeuroImage, 142, 394–406. https://doi.org/10.1016/J.NEUROIMAGE.2016.08.016
6. Vos, S. B., Tax, C. M. W., Luijten, P. R., Ourselin, S., Leemans, A., & Froeling, M. (2017). The importance of correcting for signal drift in diffusion MRI. Mag Res Med, 77(1), 285–299. https://doi.org/10.1002/mrm.26124
7. Andersson, J. L. R., Skare, S., & Ashburner, J. (2003). How to correct susceptibility distortions in spin-echo echo-planar images: application to diffusion tensor imaging. NeuroImage, 20(2), 870–888. https://doi.org/10.1016/S1053-8119(03)00336-7
8. Andersson, J. L. R., & Sotiropoulos, S. N. (2016). An integrated approach to correction for off-resonance effects and subject movement in diffusion MR imaging. NeuroImage, 125, 1063–1078. https://doi.org/10.1016/J.NEUROIMAGE.2015.10.019
9. Glasser, M. F., Sotiropoulos, S. N., Wilson, J. A., Coalson, T. S., Fischl, B., Andersson, J. L., … WU-Minn HCP Consortium, for the W.-M. H. (2013). The minimal preprocessing pipelines for the Human Connectome Project. NeuroImage, 80, 105–24.
10. Kellner, E., Dhital, B., Kiselev, V. G., & Reisert, M. (2016). Gibbs-ringing artifact removal based on local subvoxel-shifts. Mag Res Med, 76(5), 1574–1581. https://doi.org/10.1002/mrm.26054
11. Hoy, A. R., Koay, C. G., Kecskemeti, S. R., & Alexander, A. L. (2014). Optimization of a free water elimination two-compartment model for diffusion tensor imaging. NeuroImage, 103, 323–333. https://doi.org/10.1016/J.NEUROIMAGE.2014.09.053
12. Zhang, Y. and Brady, M. and Smith, S. Segmentation of brain MR images through a hidden Markov random field model and the expectation-maximization algorithm. IEEE Trans Med Imag, 20(1):45-57, 2001.
13. Jeurissen, Ben., et al. Multi-tissue constrained spherical deconvolution for improved analysis of multi-shell diffusion MRI data. NeuroImage 103 (2014): 411-426.
14. Tournier, J.D., Calamante, F. & Connelly, A. Improved probabilistic streamlines tractography by 2nd order integration over fibre orientation distributions. Proc Int Soc Mag Res Med, 2010, 1670, 15.
15. Calamante, F., Tournier, J. D., Jackson, G. D., & Connelly, A. (2010). Track-density imaging (TDI): Super-resolution white matter imaging using whole-brain track-density mapping. NeuroImage, 53(4), 1233–1243. https://doi.org/10.1016/j.neuroimage.2010.07.024 https://doi.org/10.1016/j.neuroimage.2013.04.127
16. Fisher, R. A. (1915). Frequency distribution of the values of the correlation coefficient in samples of an indefinitely large population. Biometrika. Biometrika Trust. 10 (4): 507521. doi:10.2307/2331838. JSTOR 2331838.
Figures
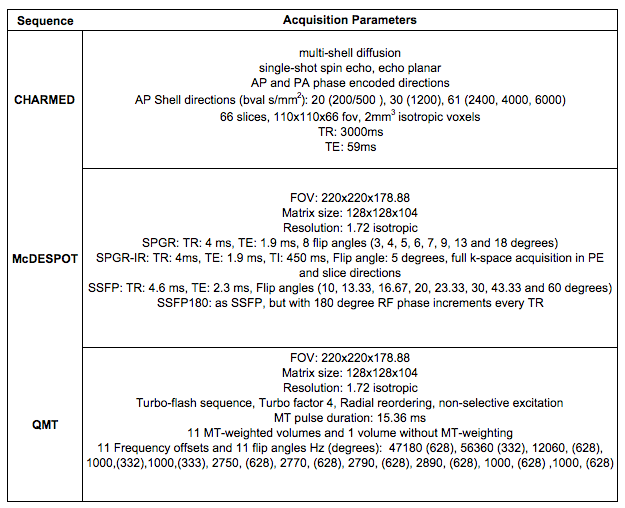
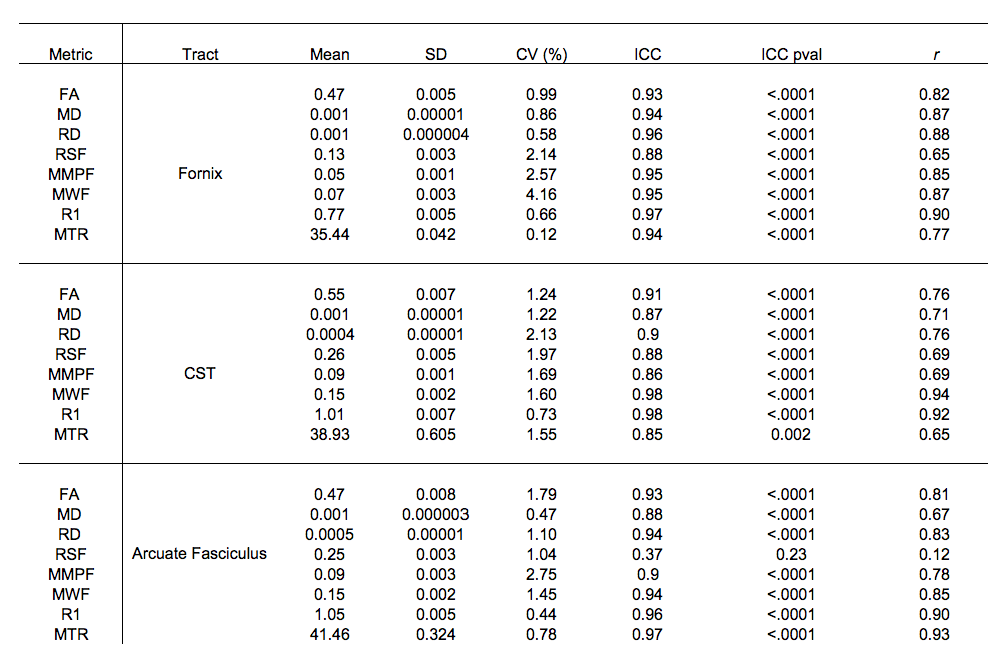
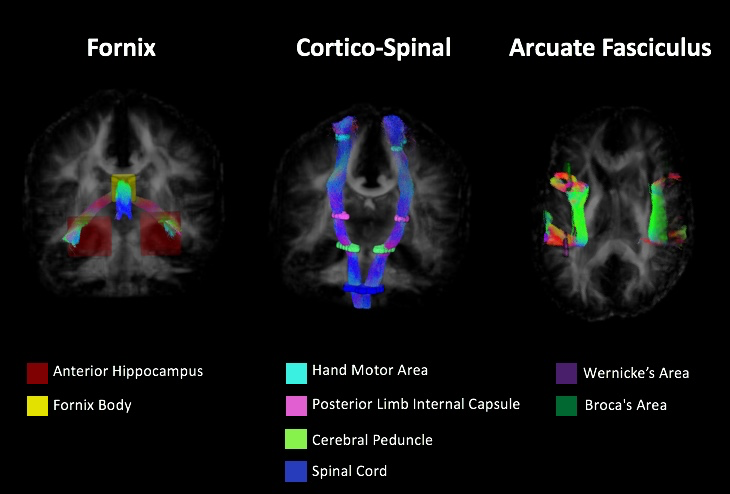
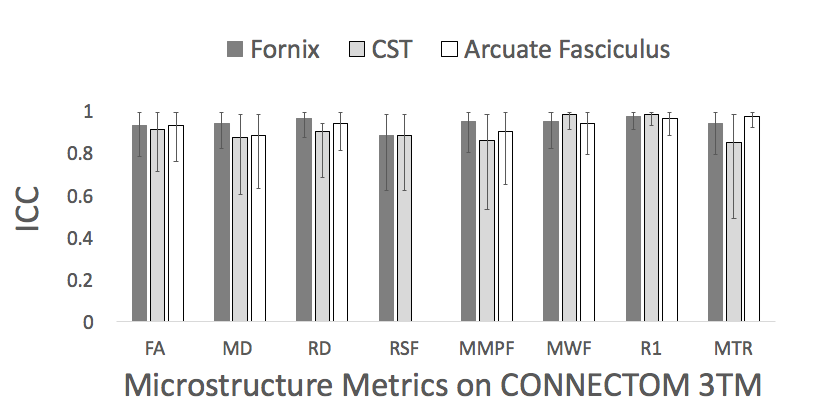
Figure 2. Intra-class correlation coefficients (two-way mixed, absolute agreement) for test-retest repeatability of microstructure metrics measured 5 times in 6 participants.