3576
Test-retest reliability of 3-tissue constrained spherical deconvolution of diffusion MRI data by analysis of three separate cohorts1Department of Radiology & Medical Imaging, Division of Neuroradiology, University of Virginia Health System, University of Virginia, Charlottesville, VA, United States, 2The Florey Department of Neuroscience, University of Melbourne, Melbourne, Australia, 3The Florey Institute of Neuroscience and Mental Health, Melbourne, Australia, 4Center for Applied Biomechanics, University of Virginia, Charlottesville, VA, United States
Synopsis
It has previously been demonstrated that, by using 3-tissue constrained spherical deconvolution, separate compartments encompassing cerebrospinal fluid-like, white matter-like, and grey matter-like, signal fractions can be derived from diffusion MRI data. This study explores the reliability of these compartments in three test-retest cohorts with a variety of timescales and scanning parameters. Whole-brain average signal fractions show excellent reliability across all datasets, particularly in determining the CSF-like signal fraction. This suggests that variations in whole brain signal fraction measurements are likely to be attributable to experimental manipulation or pathology and not variation introduced by performing the analysis.
Introduction
Multi-shell, multi-tissue, constrained spherical deconvolution (MSMT-CSD) has been described as an effective means of removing signal in diffusion MRI (dMRI) data that arises from compartments of isotropically diffusing water in grey matter (GM) or cerebrospinal fluid (CSF), in order to better elucidate white matter (WM) signal and directionality1. Recently, using an unsupervised algorithm to determine response functions directly from the dMRI data2, a quantitative utilization of 3-tissue CSD to estimate the WM/GM/CSF signal fractions (using patterns of diffusion thought to arise from the microarchitecture of each compartment) was demonstrated in white matter hyperintensities in Alzheimer’s disease3,4. However it has not been formally established if the tissue signal fractions resulting from 3-tissue CSD are reliable or if the measurements are stable over time. The aim of this study is to determine if the average value of each tissue compartment in each subject varies significantly due to the analysis pipeline. Two multi-shell datasets and a publicly available single-shell dataset are analyzed to explore multiple timescales and scanning parameters.Methods
3-tissue CSD was performed using the open source software MRtrix5, several preprocessing and postprocessing steps also utilized FSL6and ANTs7. Three cohorts of subjects were scanned twice to create baseline and retest dMRI images. The first cohort consisted of individuals participating in a separate study that included multiple scanning sessions. In each session two identical dMRI sequences were performed sequentially without table repositioning to evaluate reliability of the analysis technique. Data was acquired on a Siemens Prisma 3T scanner with isotropic voxels 1.7x1.7x1.7mm3, TE=70ms and TR=2900ms; 10 b=0 images were acquired, and 64 gradient directions at both b=1500s/mm2and b=3000s/mm2.
For the second cohort images were obtained from the publicly available Nathanial Kline Institute for Psychiatric Research enhanced test-retest dataset (eNKI-TRT)8. Baseline and rescan sessions occurred between 7-60 days apart. Images were obtained using a Siemens Trio Tim with voxel size 2x2x2mm3, TE=85ms and TR=2400ms; 9 b=0 images were acquired and 127 directions at b=1500s/mm2.
The third cohort was composed of individuals from a previous experiment9. Scanning sessions were spaced 3 months apart. Data was acquired on the same Siemens 3T scanner as the first cohort using a different sequence with voxel size 2.7x2.7x2.7mm3, TE=100ms; 1 b=0 image was acquired, and 30 gradient directions at both b=1000s/mm2 and b=2000s/mm2.
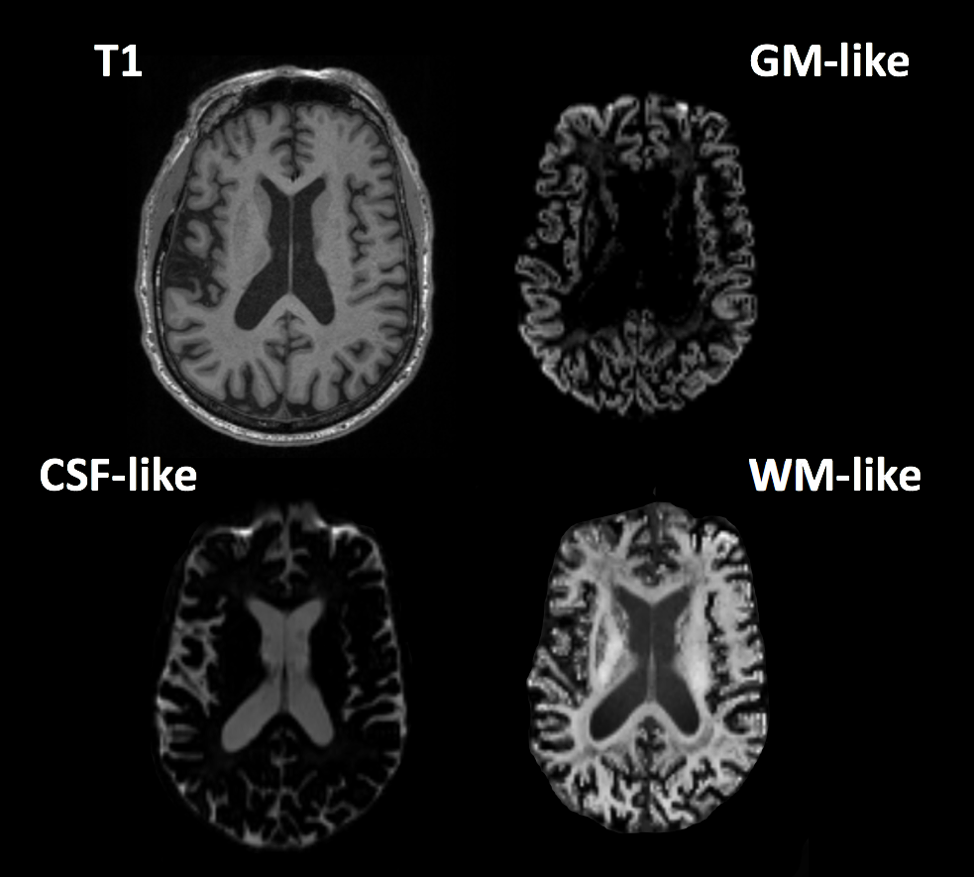
All data was analyzed using the following pipeline: images were denoised10, corrected for Gibbs ringing11, susceptibility distortions12, motion13, and eddy currents14. All images were upsampled to a voxel size of 1.3x1.3x1.3mm3 and 3-tissue CSD was performed after selecting response functions using an unsupervised method2. Final tissue map intensities were intensity normalized, and each compartment is presented as representing the fraction of total signal observed in each voxel (Fig. 1).
Results
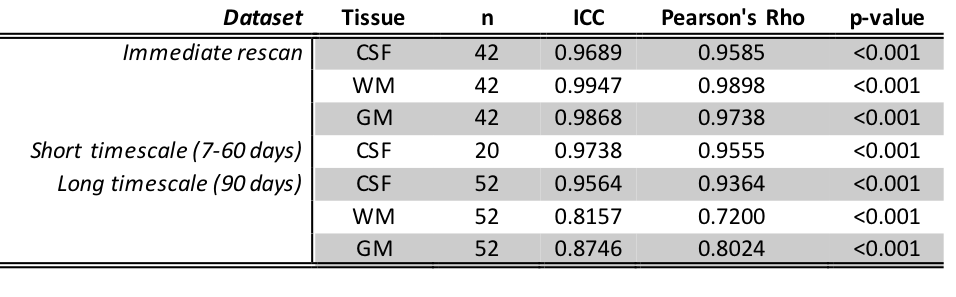
The WM and GM maps were analyzed by calculating the whole brain signal average for each compartment, while the CSF map was analyzed as the average intensity in voxels where the WM and GM together summed to greater than 50%. This was performed in order to obtain as close as possible estimate of CSF infiltration into the brain tissue; a measure that is potentially more unique and indicative of healthy/pathological function than one including the (CSF in) ventricles and subarachnoid space. All measured tissue compartments were averaged across each subject’s brain and compared between baseline scan and retest with intraclass correlation coefficients (ICC) calculated as well as Pearson’s correlations. The complete results for all datasets are presented in Table 1.Discussion
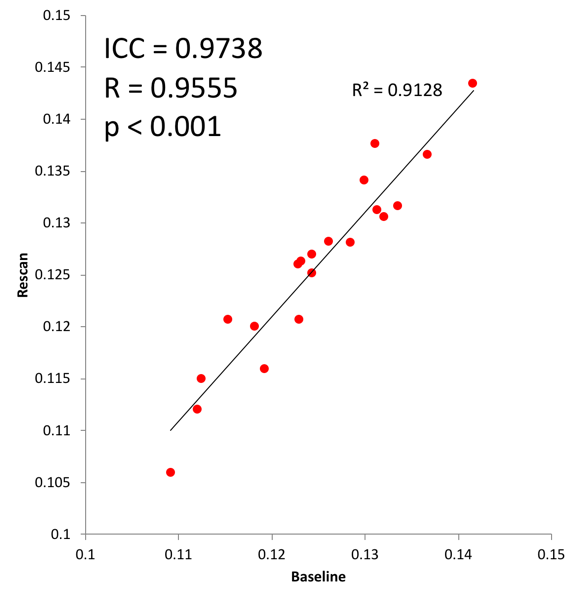
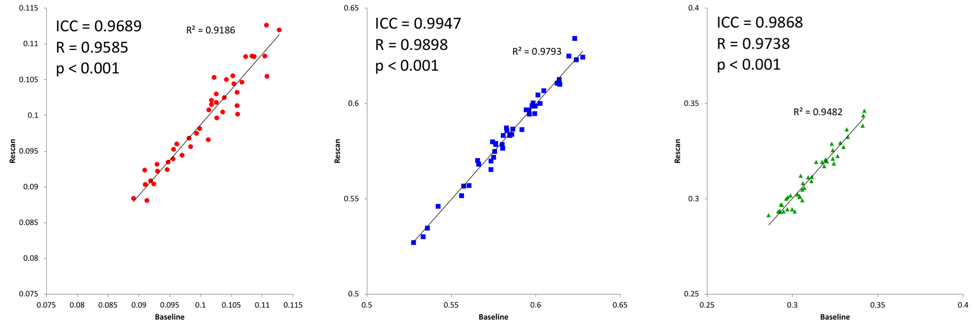
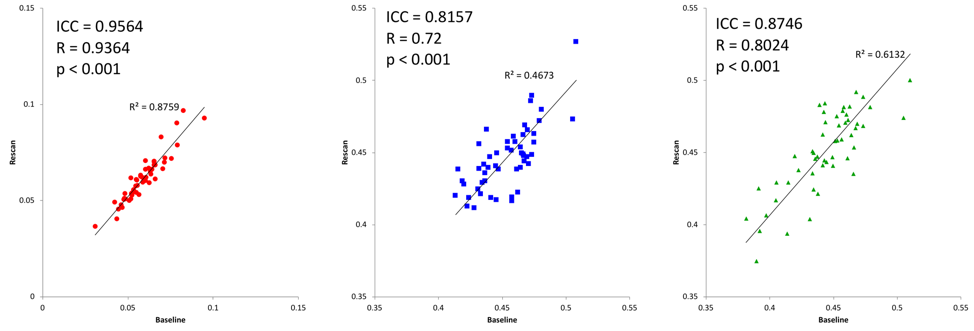
Despite not including any majority CSF voxels in the ventricles or subarachnoid space, the CSF compartment displayed the greatest reliability across all cohorts, with ICC values being above 0.95 in each, including the single-shell dataset (Fig. 2). WM and GM compartments both demonstrated very high reliability in the immediate cohort (both ICC>0.98; Fig. 3), however this declined in the long timescale cohort to both ICC>0.8 (Fig. 4). This may be partially explained by the lower maximum b-value leading to worse angular resolution of WM fibers, and increased difficulty in teasing apart WM-like and GM-like contributions. In general, the varying sequences used in this study lend both a strength in demonstrating the wide variety of diffusion input that can be reliably analyzed using 3-tissue CSD; however based on the available data, the reasons for variance in reliability in the longer sample can only be speculated at this point.Conclusion
Compartments derived from 3-tissue CSD are reliable in a test-retest setting up to 3 months following baseline. Alterations in tissue map values due to experimental manipulation are likely not due to noise or variations introduced by the analysis pipeline.Acknowledgements
No acknowledgement found.References
1. Jeurissen, B., Tournier, J. D., Dhollander, T., Connelly, A., & Sijbers, J. (2014). Multi-tissue constrained spherical deconvolution for improved analysis of multi-shell diffusion MRI data. NeuroImage, 103
2. Dhollander, T., Raffelt, D., & Connelly, A. (2016). Unsupervised 3-tissue response function estimation from single-shell or multi-shell diffusion MR data without a co-registered T1 image. In ISMRM Workshop on Breaking the Barriers of Diffusion MRI(Vol. 5)
3. Mito, R., Dhollander, T., Raffelt, D., Xia, Y., Salvado, O., Brodtmann, A., Rowe, C., Villemagne, V., & Connelly, A. (2018). Investigating microstructural heterogeneity of white matter hyperintensities in Alzheimer’s disease using single-shell 3-tissue constrained spherical deconvolution. Proceedings of the 26th International Society of Magnetic Resonance in Medicine, 26, 0135.
4. Dhollander, T., Raffelt, D., & Connelly, A. (2017). Towards interpretation of 3-tissue constrained spherical deconvolution results in pathology. Proceedings of the 25th International Society of Magnetic Resonance in Medicine, 25, 1815.
5. Tournier, J. D., Calamante, F., & Connelly, A. (2012). MRtrix: diffusion tractography in crossing fiber regions. International Journal of Imaging Systems and Technology, 22(1), 53-66.
6. Jenkinson, M., Beckmann, C. F., Behrens, T. E. J., Woolrich, M. W., & Smith, S. M. (2012). FSL. NeuroImage, 62(2), 782-790.
7. Avants, B. B., Tustison, N., & Song, G. (2009). Advanced normalization tools (ANTS). Insight j, 2, 1-35.
8. 1000 Functional Connectomes Project (http://www.nitrc.org/projects/fcon_1000/); Nathan S. Kline Institute for Psychiatric Research (NKI), enhanced NKI (eNKI) test–retest data.
9. Reynolds, B. B., Stanton, A. N., Soldozy, S., Goodkin, H. P., Wintermark, M., & Druzgal, T. J. (2017). Investigating the effects of subconcussion on functional connectivity using mass-univariate and multivariate approaches. Brain imaging and behavior, 1-14.
10. Veraart, J., Fieremans, E., & Novikov, D. S. (2016). Diffusion MRI noise mapping using random matrix theory. Magnetic resonance in medicine, 76(5), 1582-1593.
11. Kellner, E., Dhital, B., Kiselev, V. G., & Reisert, M. (2016). Gibbs‐ringing artifact removal based on local subvoxel‐shifts. Magnetic resonance in medicine, 76(5), 1574-1581.
12. Smith, S. M., Jenkinson, M., Woolrich, M. W., Beckmann, C. F., Behrens, T. E., Johansen-Berg, H., ... & Niazy, R. K. (2004). Advances in functional and structural MR image analysis and implementation as FSL. Neuroimage, 23, S208-S219.
13. Andersson, J. L., Graham, M. S., Zsoldos, E., & Sotiropoulos, S. N. (2016). Incorporating outlier detection and replacement into a non-parametric framework for movement and distortion correction of diffusion MR images. NeuroImage, 141, 556-572.
14. Andersson, J. L., & Sotiropoulos, S. N. (2016). An integrated approach to correction for off-resonance effects and subject movement in diffusion MR imaging. Neuroimage, 125, 1063-1078.
Figures