3571
Dependence of harmonic power on b-value for fiber ball imaging: comparison of theory and experiment1Department of Neuroscience, Medical University of South Carolina, Charleston, SC, United States, 2Center for Biomedical Imaging, Medical University of South Carolina, Charleston, SC, United States, 3Department of Neurology, Medical University of South Carolina, Charleston, SC, United States
Synopsis
Fiber ball imaging (FBI) is a recently proposed diffusion MRI (dMRI) method for estimating fiber orientation density functions together with specific microstructural parameters in white matter. The theory underlying FBI predicts the b-value dependence for the dMRI harmonic power of any given degree as long as the b-value is sufficiently large. Good agreement between theory and experiment has been previously demonstrated for the zero-degree harmonic power. Here the predicted functional forms for higher degree harmonics are shown to also agree well with experimental measurements, providing additional support for the validity of FBI.
Introduction
Fiber ball imaging (FBI)1 is a diffusion MRI (dMRI) method that relates high angular diffusion imaging (HARDI)2 data for large $$$b$$$-values in white matter (WM) to the fiber orientation density function of axonal fiber bundles. FBI is based on two fundamental assumptions: first, the dMRI signal for large $$$b$$$-values is dominated by the contribution of water within axons, and second, axons can be modeled as thin, straight tubes. Support for these assumptions is given by the observation that the direction-averaged dMRI signal decreases with the $$$b$$$-value, $$$b$$$, as $$$b^{-\frac{1}{2}}$$$ for large $$$b$$$-values ($$$b\geq4000$$$ s/mm2).3,4 This direction-averaged dMRI signal is proportional to the square root of the zero-degree harmonic power of a spherical harmonic expansion of the dMRI signal. FBI also predicts the $$$b$$$-value dependence for the harmonic power of higher degree terms in the expansion. Here we tested these predictions experimentally in order to further validate FBI.Theory
The spherical harmonic expansion for the dMRI signal can be written as $$S(b,{\bf n})=S_{0}\sum_{l=0}^{\infty}\sum_{m=-l}^{l}a_{l}^{m}Y_{l}^{m}(\theta,\phi),\tag{1}$$ where $$$S_{0}$$$ is the signal for the $$$b=0$$$, $$$Y_{l}^{m}$$$ are the spherical harmonics, $$$(\theta,\phi)$$$ are the spherical angles for $$${\bf n}$$$, and $$$a_{l}^{m}$$$ are the expansion coefficients of degree $$$l$$$ and order $$$m$$$. The harmonic power for each degree may then be defined as
$$p_{l}\equiv\frac{1}{2l+1}\sum_{m=-l}^{l}|a_{l}^{m}|^{2}.\tag{2}$$
All odd degree harmonics vanish by reflection symmetry, $$$S(b,-{\bf n})=S(b,{\bf n})$$$, implying $$$p_{l}>0$$$ for even degree harmonics only. Neglecting extra-axonal contributions, the theory underlying FBI predicts1
$$p_{l}\approx\frac{u_{l}}{b}\left[g_{l}(bD_{a})\right]^{2},\tag{3}$$
for even degrees when $$$b\geq4000$$$ s/mm2 where $$$u_{l}$$$ is a scaling factor independent of $$$b$$$, and
$$g_{l}(x)=\frac{\left(\frac{l}{2}\right)!x^{\frac{l+1}{2}}}{\Gamma\left(l+\frac{3}{2}\right)} {_1}F_{1}\left(\frac{l+1}{2};l+\frac{3}{2};-x\right), \text{ for } l=0,\space2,\space4,\space 6,...\tag{4}$$
with $$${_1}F_{1}$$$ being the confluent hypergeometric function and $$$\Gamma$$$ indicating the gamma function. Equation (3) implies $$$p_{0}\approx u_{0}/b$$$ for large $$$b$$$, which is equivalent to the observed $$$b^{-\frac{1}{2}}$$$ decay of the direction-averaged signal. However, for higher even degrees, Equation (3) predicts that the harmonic power has a peak for finite $$$b$$$-values. Thus, one finds
$$b_{l}=\frac{\nu_{l}}{D_{a}},\tag{5}$$
where $$$b_{l}$$$ is the $$$b$$$-value for the harmonic power peak of degree $$$l$$$ and $$$\nu_{l}$$$ is a constant. The first few values of $$$\nu_{l}$$$ are found numerically to be $$$\nu_{2}\approx3.969$$$, $$$\nu_{4}\approx11.040$$$, $$$\nu_{6}\approx22.023$$$, and $$$\nu_{8}\approx37.014$$$.
Method
For one adult volunteer, HARDI data were gathered on a Siemens 3T Prisma with $$$b$$$-values ranging from 1000 to 10,000 s/mm2 with 64 diffusion-encoding directions and 11 $$$b=0$$$ s/mm2 per $$$b$$$-value shell. Other acquisition parameters were TE=110ms, TR=4400ms, FOV=222 x222mm2, and voxel size = (3mm)3.
Image processing included denoising,5 Gibbs ringing removal,6 and Rician noise bias correction.7 In-house MATLAB scripts were used to calculate the spherical harmonic expansion of the dMRI signal up to $$$l=6$$$, as well as the corresponding $$$p_{l}$$$ for each harmonic using Equation (2). Additionally, several diffusion and microstructural parameters were estimated from the data by applying diffusional kurtosis imaging and the fiber ball WM (FBWM) model.8,9 In a WM mask defined as all brain voxels with mean kurtosis>1.0 and mean diffusivity<1.5 μm2/ms,10 excluding the cerebellum, the harmonic powers were either averaged over all voxels within the mask or within an individual anatomical slice of the mask.
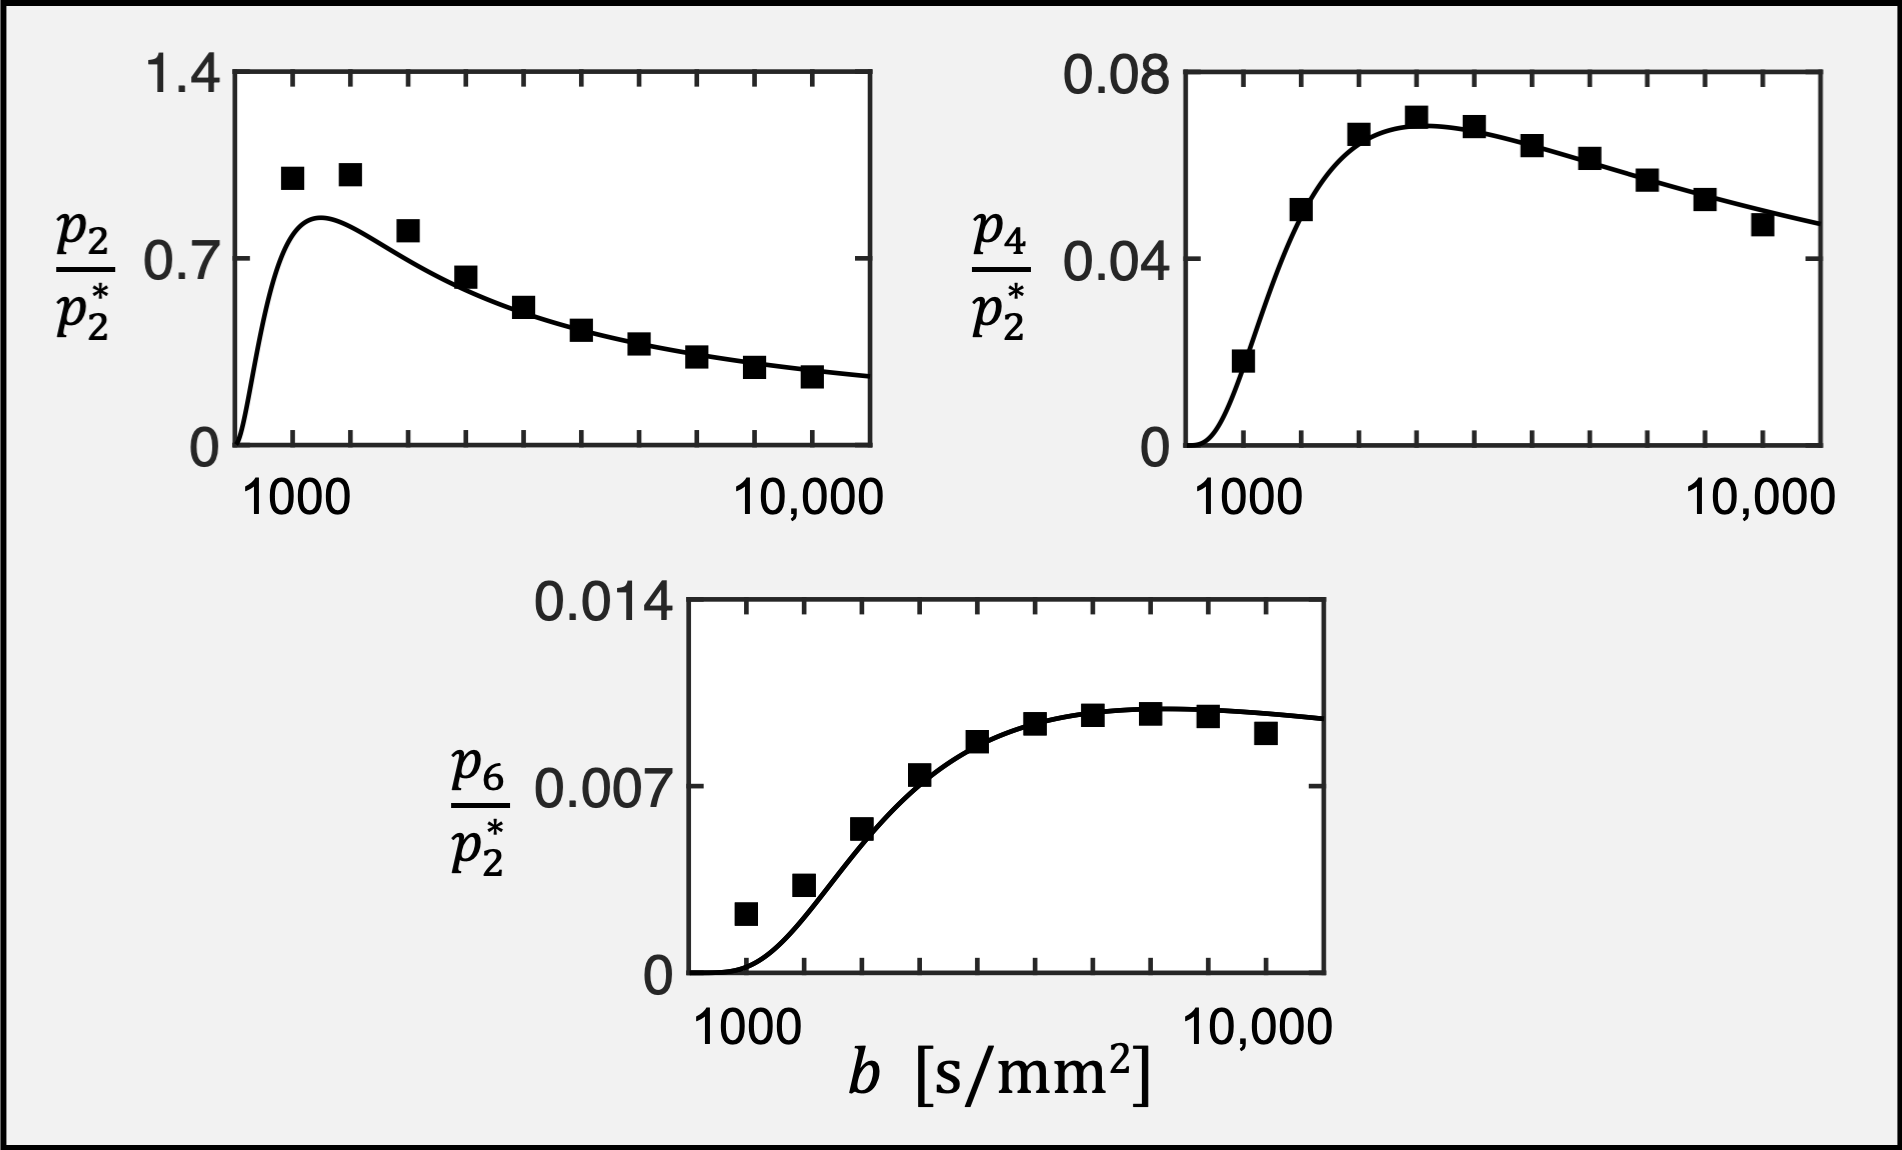
A quadratic fit to $$$p_{4}$$$ at $$$b=3000,4000\text{ and }5000$$$ s/mm2 estimated $$$b_{4}$$$ which was used in Equation (5) to calculate $$$D_{a}$$$. This value for $$$D_{a}$$$ was fixed in Equation (3) and the harmonic power of each degree for $$$b=0-10,000$$$ s/mm2 was calculated. Normalization was done for each $$$p_{l}$$$ by $$$p_{2}$$$ at $$$b=1000$$$ s/mm2 $$$(p_{2}^{*})$$$ and the scale factor $$$u_{l}$$$ was set so that theory and experiment coincided at $$$b=6000$$$ s/mm2. Thus, for the full dataset, only four adjustable parameters were used.
Results
In Figure 1, a remarkable agreement is seen between the experimentally measured and the theoretically predicted harmonic power curves for all three degrees shown. The location of the peak was estimated as $$$b=4140$$$ s/mm2, implying $$$D_{a}= 2.67$$$ mm2/ms. This is comparable to the average value of $$$D_{a}=2.34\pm0.51$$$ mm2/ms obtained from FBWM.9 A slice-by-slice comparison of $$$D_{a}$$$ as calculated from the harmonic power and from FBWM is shown in Figure 2 for 10 consecutive anatomical slices.Discussion
Our results provide strong evidence supporting the validity of the approximations upon which FBI relies. The value for $$$D_{a}$$$ found from the $$$p_{4}$$$ peak is similar to, but somewhat larger than, the $$$D_{a}$$$ value predicted by FBWM, as well as literature values obtained using alternative methods.4,9,11-13 This small discrepancy could be due to effects arising from incomplete suppression of the extra-axonal dMRI signal in the experimental data and from the neglect of the finite axon radius and/or curvature in the theory.Acknowledgements
This work was supported in part by National Institute for Health (NIH) Research grant T32GM008716 (to N. Demore) and the Litwin Foundation (to J.A. Helpern).References
1. Jensen JH, Russell Glenn G, Helpern JA. Fiber ball imaging. Neuroimage. 2016;124(Pt A):824-833.
2. Tuch DS, Reese TG, Wiegell MR, Makris N, Belliveau JW, Wedeen VJ. High angular resolution diffusion imaging reveals intravoxel white matter fiber heterogeneity. Magn Reson Med. 2002;48(4):577-582.
3. McKinnon ET, Jensen JH, Glenn GR, Helpern JA. Dependence on b-value of the direction-averaged diffusion-weighted imaging signal in brain. Magn Reson Imaging. 2017;36:121-127.
4. Veraart J, Fieremans E, Novikov DS. On the scaling behavior of water diffusion in human brain white matter. Neuroimage. 2018;185:379-387.
5. Veraart J, Novikov DS, Christiaens D, Ades-Aron B, Sijbers J, Fieremans E. Denoising of diffusion MRI using random matrix theory. Neuroimage. 2016;142:394-406.
6. Kellner E, Dhital B, Kiselev VG, Reisert M. Gibbs-ringing artifact removal based on local subvoxel-shifts. Magn Reson Med. 2016;76(5):1574-1581.
7. Gudbjartsson H, Patz S. The Rician distribution of noisy MRI data. Magn Reson Med. 1995;34(6):910-914.
8. Jensen JH, Helpern JA. MRI quantification of non-Gaussian water diffusion by kurtosis analysis. NMR Biomed. 2010;23(7):698-710.
9. McKinnon ET, Helpern JA, Jensen JH. Modeling white matter microstructure with fiber ball imaging. Neuroimage. 2018;176:11-21.
10. Yang AW, Jensen JH, Hu CC, Tabesh A, Falangola MF, Helpern JA. Effect of cerebral spinal fluid suppression for diffusional kurtosis imaging. J Magn Reson Imaging. 2013;37(2):365-371.
11. Kaden E, Kelm ND, Carson RP, Does MD, Alexander DC. Multi-compartment microscopic diffusion imaging. Neuroimage. 2016;139:346-359.
12. Veraart J, Novikov DS, Fieremans E. TE dependent Diffusion Imaging (TEdDI) distinguishes between compartmental T2 relaxation times. Neuroimage. 2018;182:360-369.
13. Dhital B, Reisert M, Kellner E, Kiselev VG. Intra-axonal diffusivity in brain white matter arXiv preprint arXiv:1712.04565
Figures