3570
Diffusion of the perivascular space fluid is anisotropic in conventional DWI1Stevens Neuroimaging and Informatics Institute, Keck School of Medicine, University of Southern California, Los Angeles, CA, United States, 2Department of Psychology, University of Southern California, Los Angeles, CA, United States, 3Neuroscience graduate program, University of Southern California, Los Angeles, CA, United States, 4Department of Radiology, University of Southern California, Los Angeles, CA, United States, 5Department of Radiology, Alfred Health, Melbourne, Australia
Synopsis
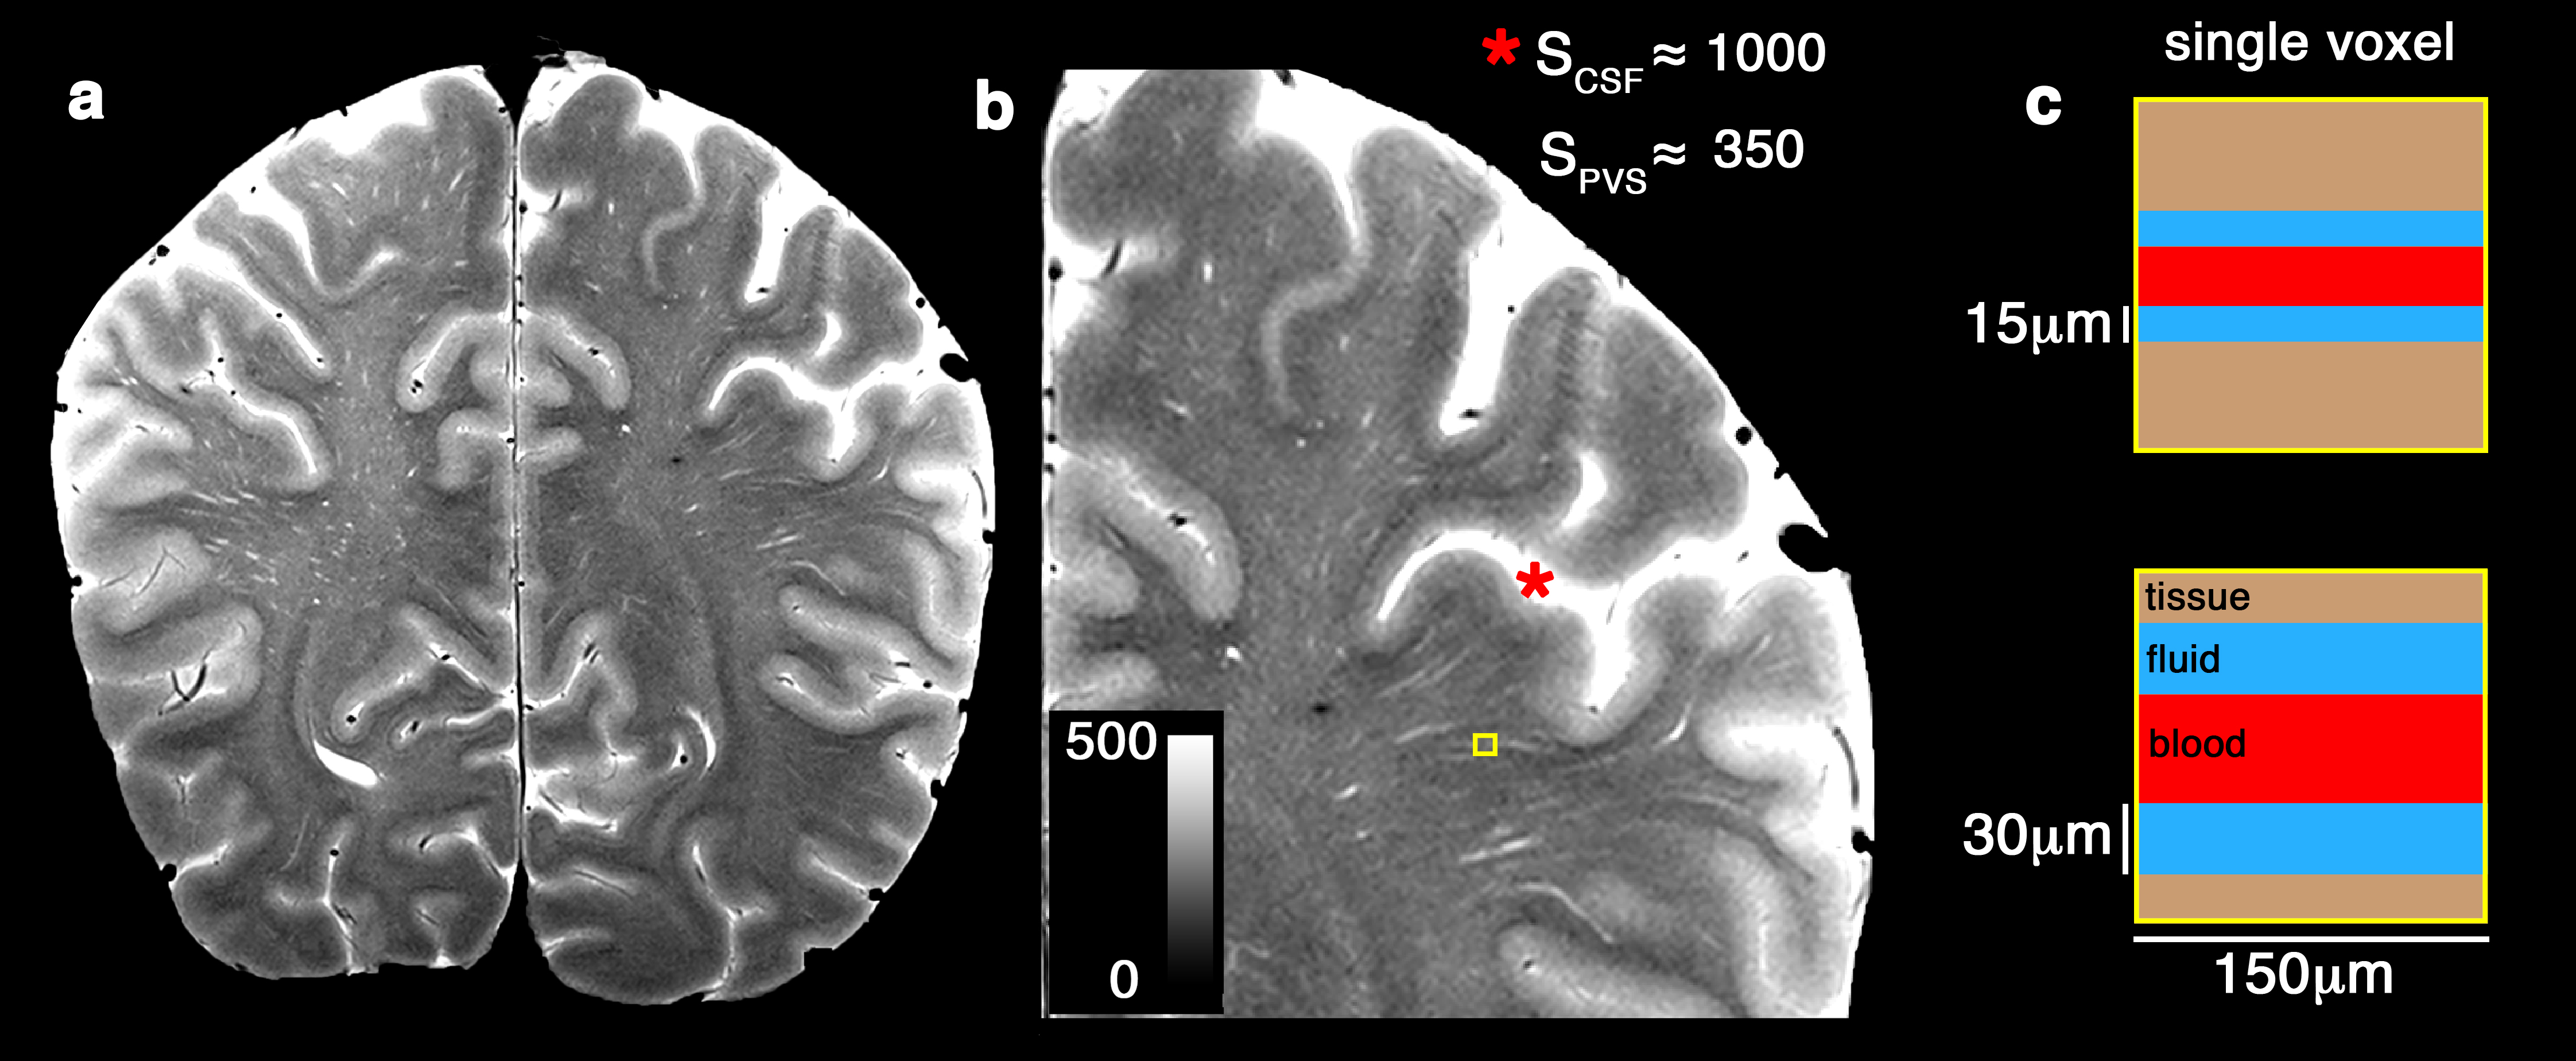
Perivascular space (PVS), also known as Virchow-Robin space, is a pial-lined, fluid-filled structure that surrounds vessels in the cerebral cortex 1,2, and occupies a large portion of the cerebral tissue. PVS has an anisotropic morphology 3–5 and is mainly aligned with the white matter 6. However, its diffusion MRI profile has not been studied. Here we show experimental evidences that that PVS can be measured with diffusion MRI and the signature of this compartment is anisotropic.
Introduction
PVS fluid occupies a large portion of the white matter and has a fast diffusivity relative to the parenchyma. This compartment is often overlooked by the diffusion community. Many techniques have been proposed to account for free water presence 7–11, mainly to overcome the contamination of the cerebrospinal fluid, but not specifically the PVS fluid. In most of these models, the “free water” is assumed to be isotropic, and often fixed. Here we show that the PVS diffusion is anisotropic, making it distinct from cerebrospinal fluid.Method
We acquired a multi-shell diffusion MRI of a healthy 32-years-old female volunteer. An hour of scan was conducted to acquire 632 diffusion MRI volumes. B-values of 0, 200, 400, 600, 800, 1000, 1200, 1500 and 2000 s/mm2 was acquired with isotropic resolution of 1.5 mm3 using a 3T scanner (Prisma, Siemens Healthcare, Erlangen, Germany), with a variation of the Human Connectome Project acquisition protocol 12. Thirty gradient-encoding directions for low b-value shells (<1500) and sixty gradient-encoding directions for other shells were acquired in both anterior-posterior and posterior-anterior phase encoding directions. We used a single-channel quadrature transmit radiofrequency (RF) coil and a 32-channel receive array coil (Nova Medical Inc., MA). High-resolution T2-weighted images were also acquired on a 7 Tesla, whole-body scanner (Terra, Siemens Healthcare, Erlangen, Germany). T2-weighted using turbo-spin echo sequences with in-plane resolution of 300 µm (interpolated to 150 µm) and 2 mm slice thickness were collected. Four averages and two concatenations were acquired to enhance image SNR and CNR 13. The total acquisition time of the TSE was 11 minutes, with TE=73 ms, TR=3.5 s and total of 25 slices. The institutional review board of the University of Southern California approved the study. Informed consent was obtained from the volunteers, and the image datasets were anonymized.Data analysis
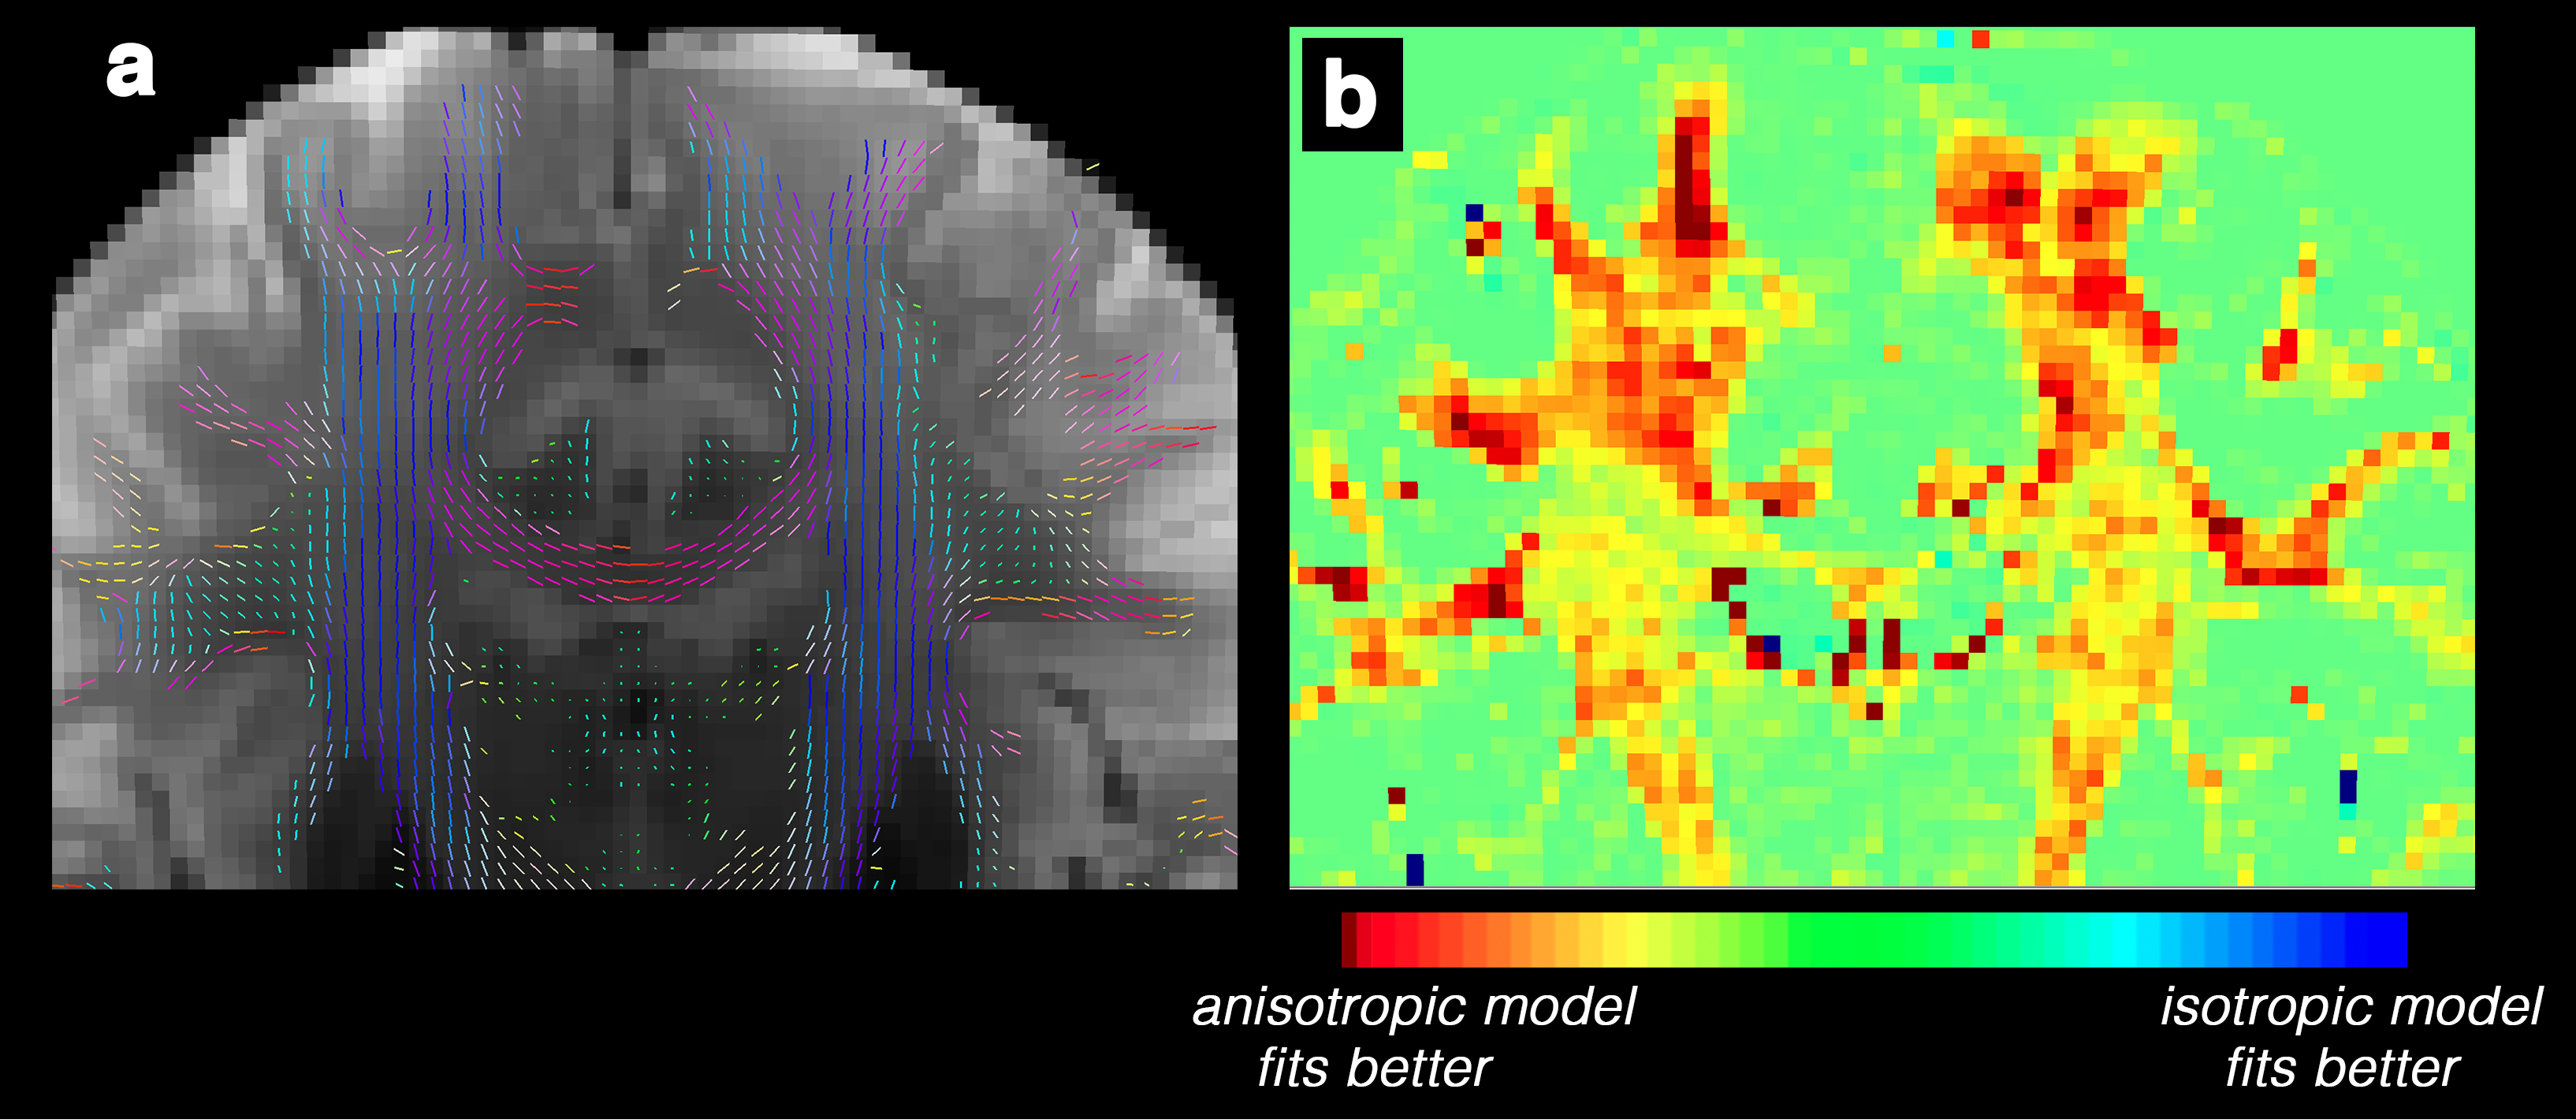
dcm2nii was used to convert the dicomimages to the nifti file format 14. Diffusion MRI data were corrected for subject motion, eddy current, EPI distortion. FSL’s TOPUP was used to correct for B0-inhomogeneity distortion using two opposing phase encoded images 15. FSL's EDDY was used to correct for current induced field inhomogeneity and subject’s head motion 16, followed by correction for the gradient nonlinearity. Two bi-tensor models were fitted to the diffusion data, one allowing anisotropic diffusion for PVS and one constrained to isotropic diffusion. Quantitative Imaging Toolkit (QIT) 17 was used for fitting and visualization. Except for the diffusion profile of the PVS compartment, an identical fitting routine was used for both models. Fitting was performed with derivative-free optimization using Powell’s constrained trust-region BOBYQA algorithm 18. The signal fraction was required to be between zero and one, the fluid compartment was required to be axially symmetric fluid compartment with positive diffusivities and have an axis aligned to the tissue principal direction, and the tissue compartment was constrained to be positive definite using a re-parameterization with the Cholesky decomposition.Result
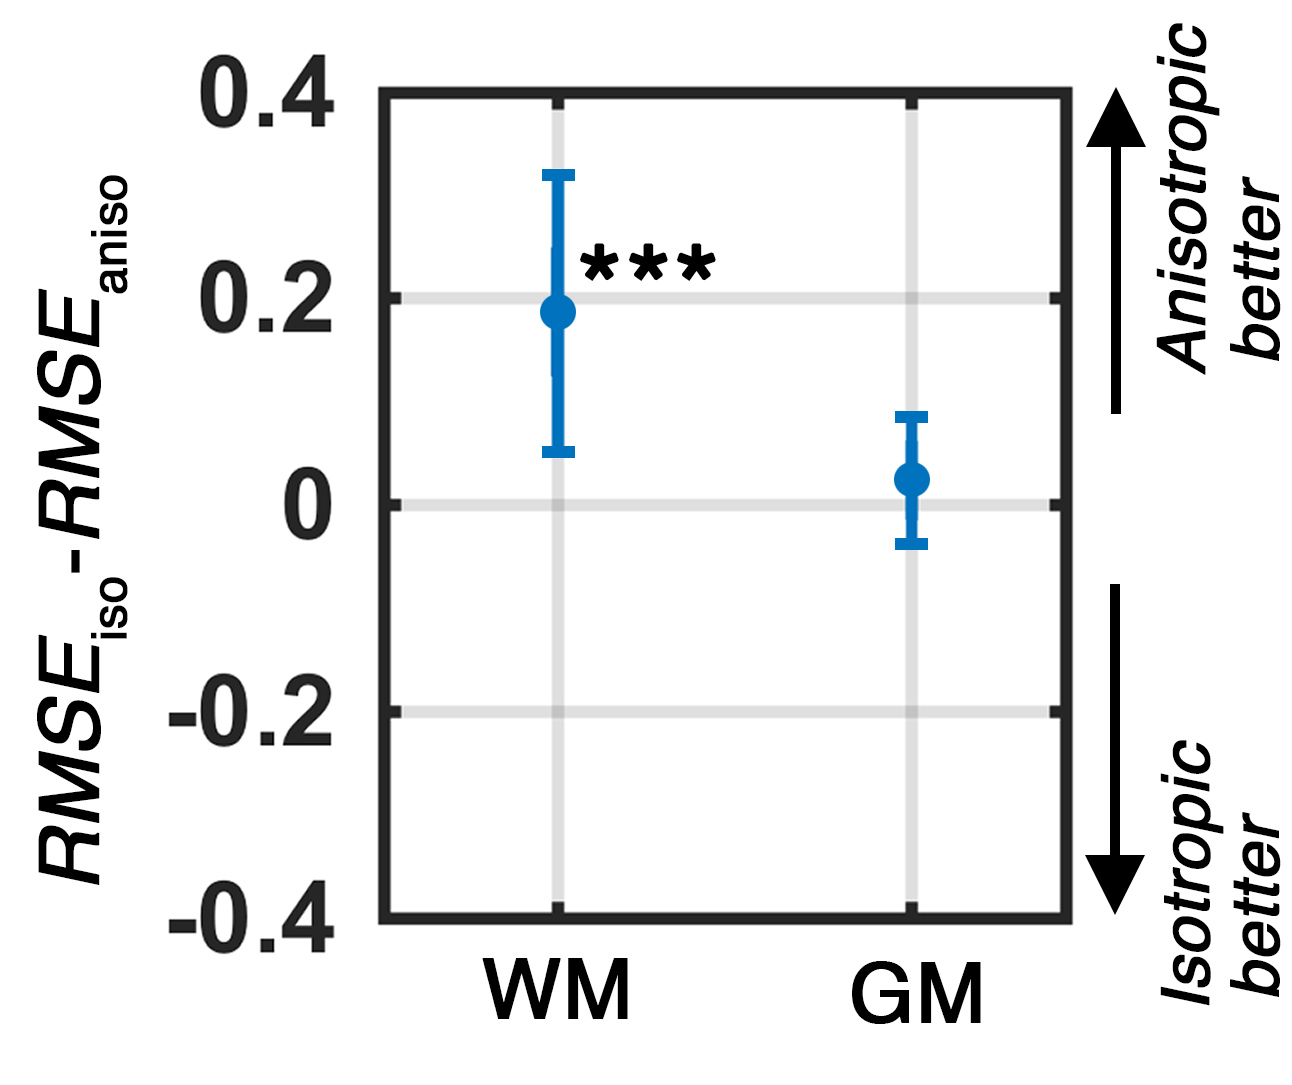
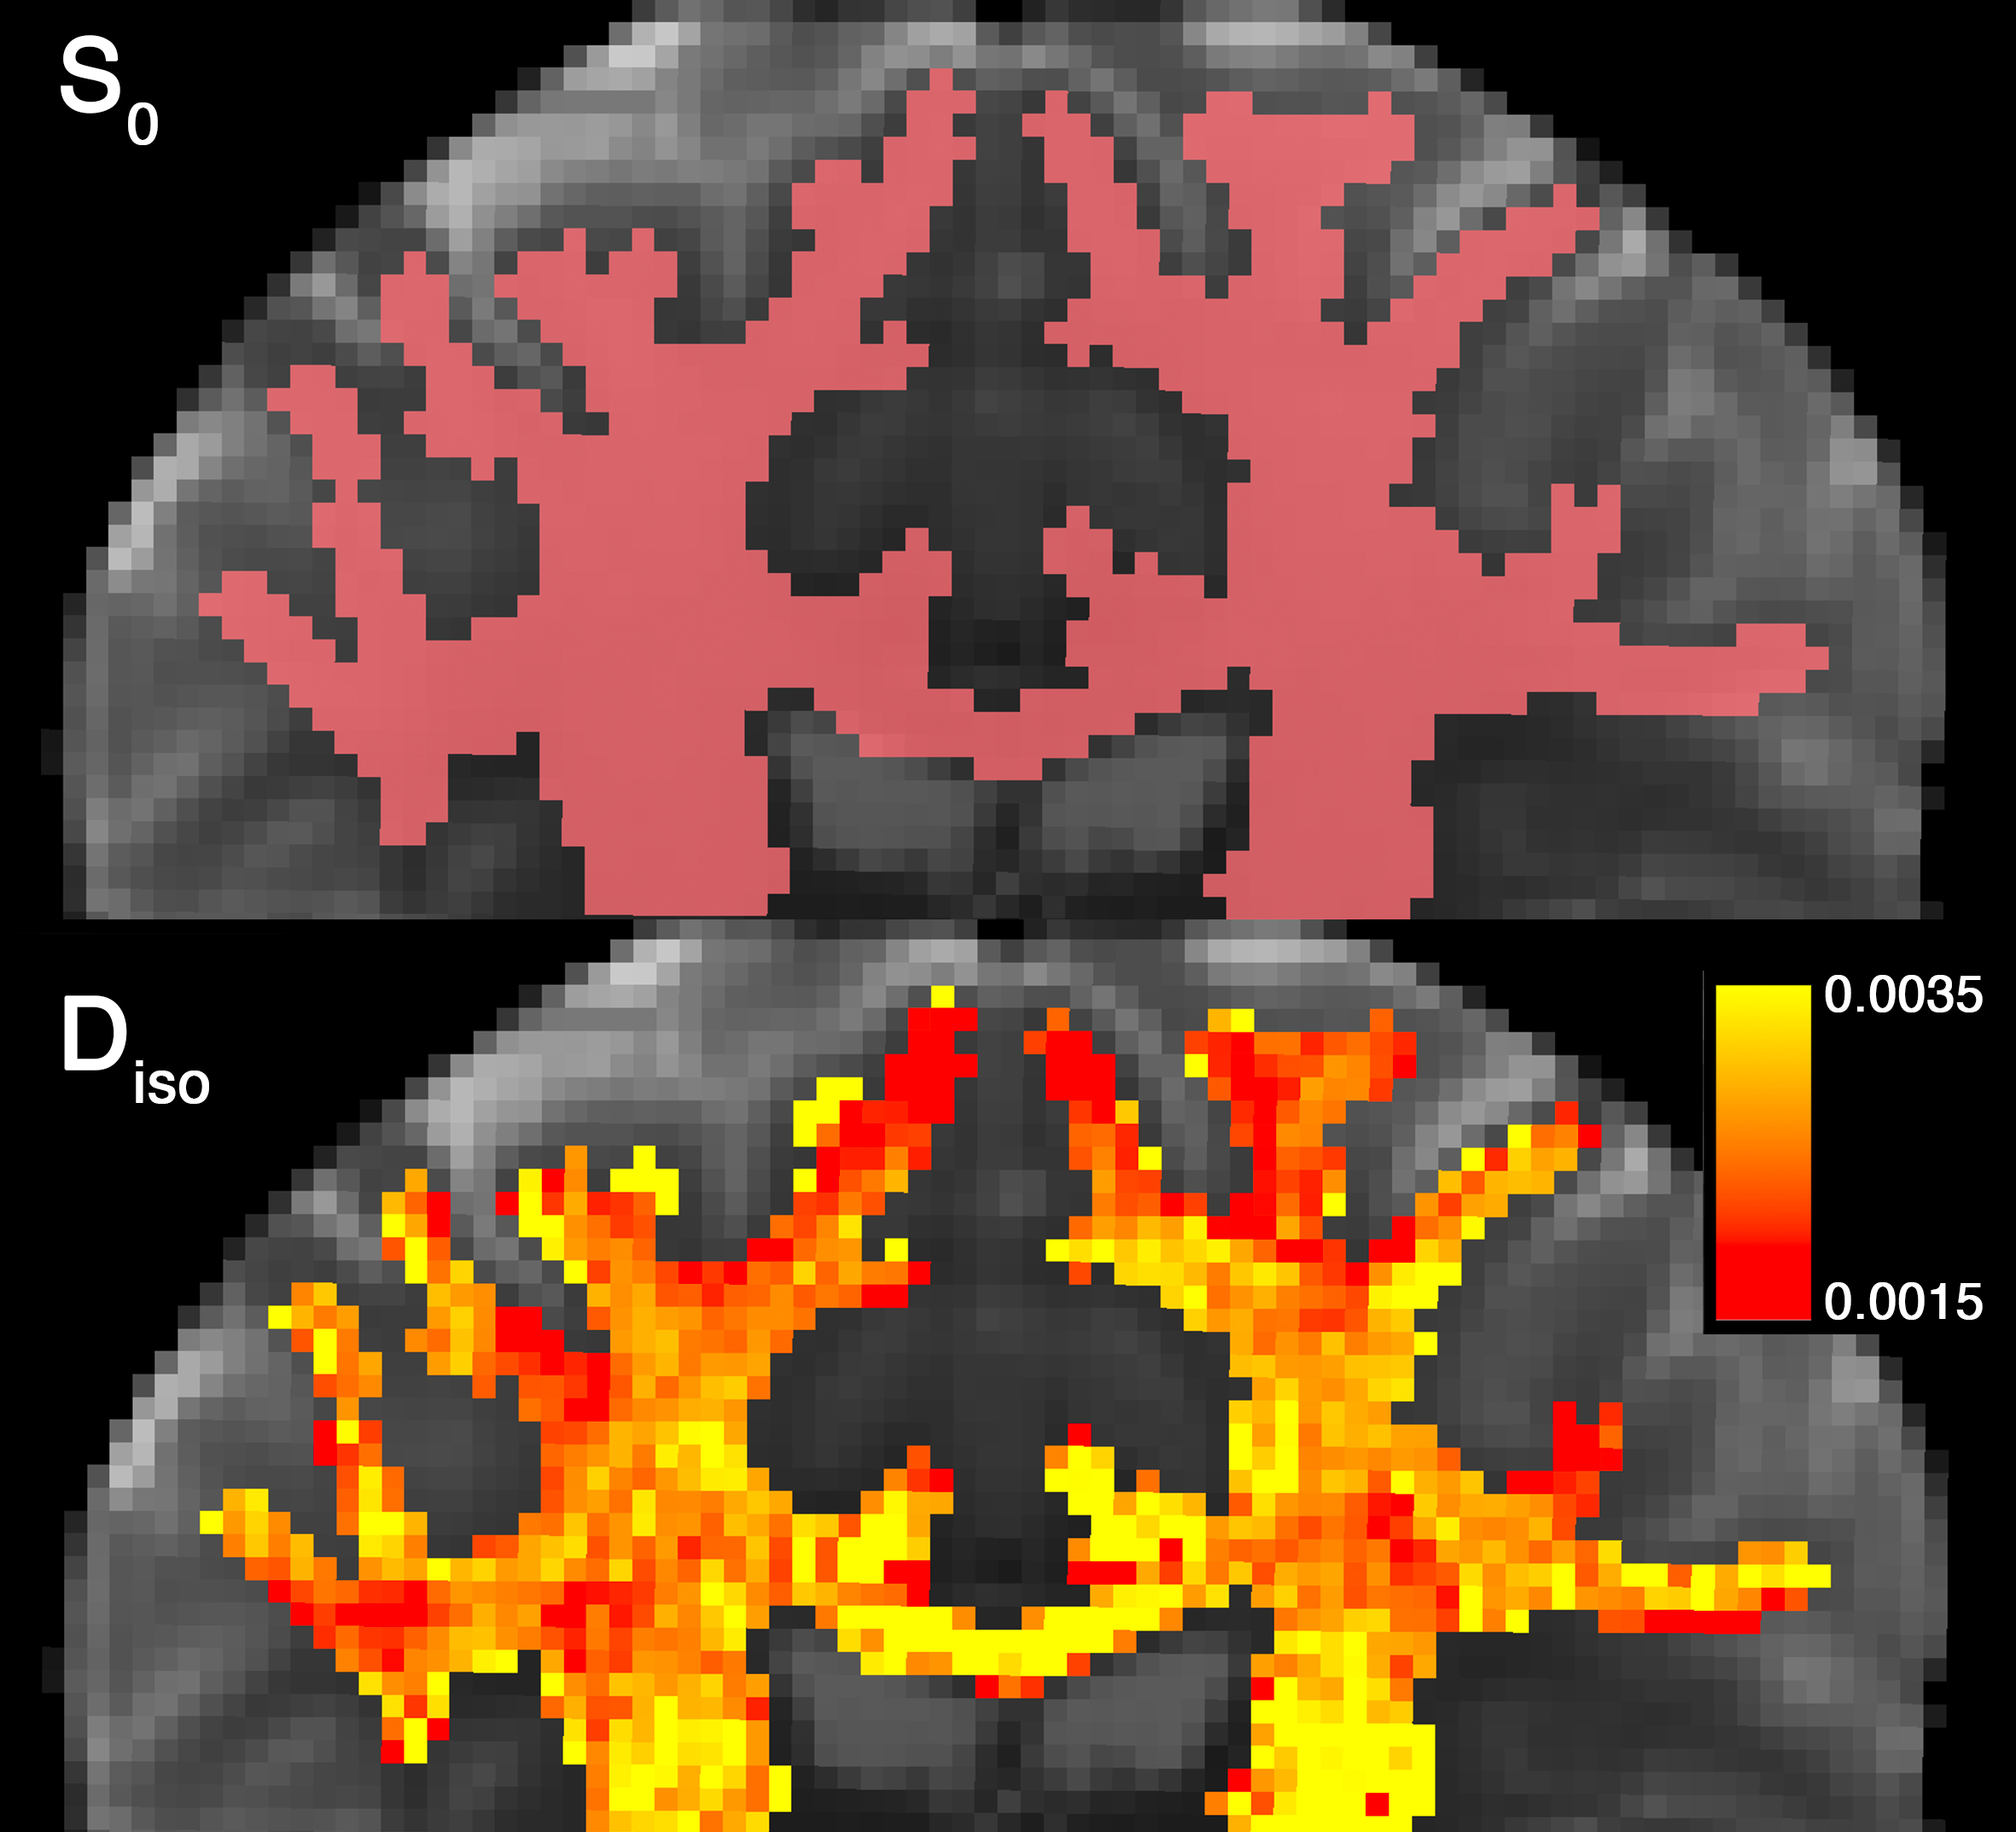
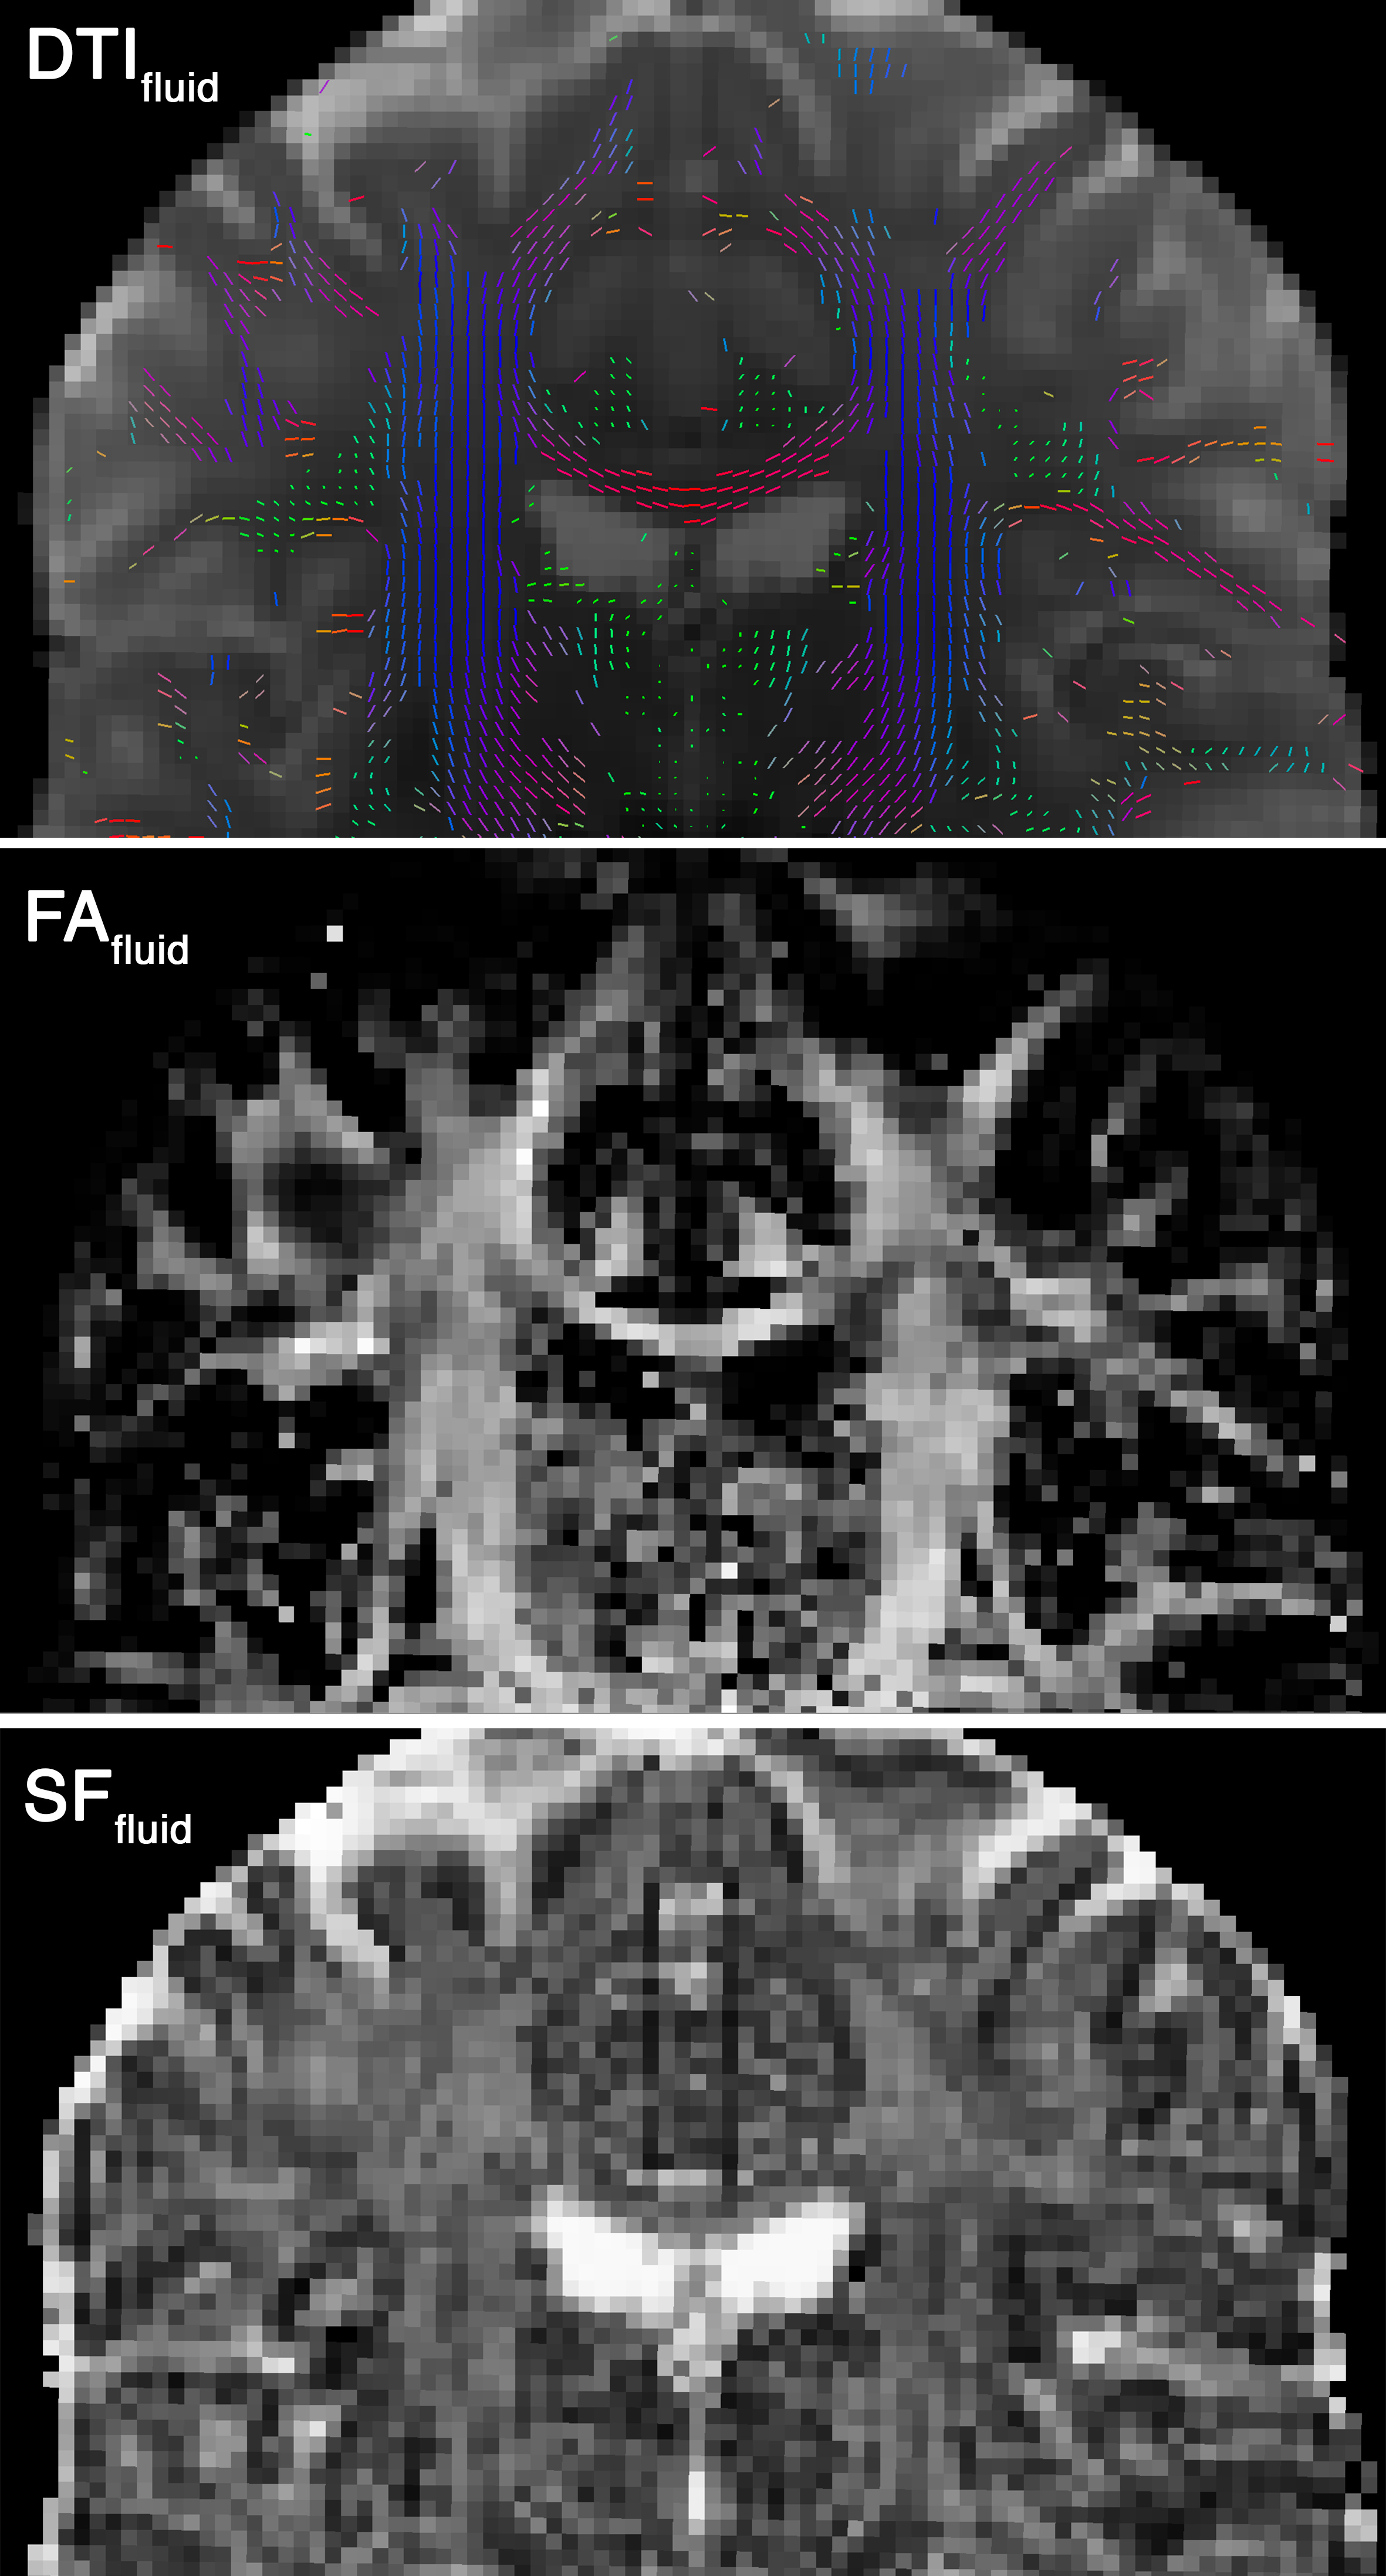
Experimental data showed that an anisotropic model of the PVS is a better fit to diffusion data compared to an isotropic model (Figure 1). Anisotropic model fitted more accurately to the white matter voxels compare to the isotropic model and performed similarly in gray matter and CSF voxels (Figure 2 and 3). The fitting was particularly superior in voxels with high PVS presence. For example, pre-cortical white matter voxels around centrum semiovale (Figure 2) were best modeled when the anisotropic model of the PVS was utilized. Statistically, the root mean square error of the anisotropic model fitting was significantly lower than that of the isotropic model: t(15095)=147.73, p<0.001. The superiority of the anisotropic model was not enforced by the fractional anisotropy of the white matter and was mainly explained by the PVS presence (note low error difference in corpus callosum voxels). FA and signal fraction maps of the fluid compartment suggested a large anisotropic fluid presence throughout the white matter (Figure 4). Finally, when an isotropic model of the white matter fluid was used, a large diffusivity variation was observed (Figure 5), suggesting that a fixed diffusivity value is not optimum for white matter non-parenchymal fluid.Discussion
Here we show experimental evidence that the PVS diffusion MRI signal is anisotropic. If ignored, PVS diffusion signal contribution could significantly bias diffusion MRI measures such as mean diffusivity and fractional anisotropy of DTI or FWE-DWI 19.Acknowledgements
This work was supported by NIH grants: 2P41EB015922-21, 1P01AG052350-01 and USC ADRC 5P50AG005142.References
1.Krueger, M. & Bechmann, I. Glia58, 1–10 (2010).
2.Zhang, E.T., Inman, C.B. & Weller, R.O. J. Anat.170, 111 (1990).
3.Amato, S.P., Pan, F., Schwartz, J. & Ragan, T.M. Front. Neuroanat.10, 1–11 (2016).
4.Cavaglia, M. et al. Brain Res.910, 81–93 (2001).
5.Duvernoy, H.M., Delon, S. & Vannson, J.L. Brain Res. Bull.7, 519–579 (1981).
6.Doucette, J. et al. Neuroimage (2018).doi:https://doi.org/10.1016/j.neuroimage.2018.10.035
7.Pierpaoli, C. & Jones, D.K. Int. Soc. Magn. Reson. Med. Present. ISMRM1215 (2004).
8.Pasternak, O., Sochen, N., Gur, Y., Intrator, N. & Assaf, Y. Magn. Reson. Med.62, 717–730 (2009).
9.Hoy, A.R. et al. PLoS One12, 1–21 (2017).
10.Berlot, R., Metzler-Baddeley, C., Jones, D.K. & O’Sullivan, M.J. Neuroimage92, 27–35 (2014).
11. Metzler-Baddeley, C., O’Sullivan, M.J., Bells, S., Pasternak, O. & Jones, D.K. Neuroimage59, 1394–1403 (2012).
12. Essen, D.C. Van et al. Neuroimage80, 62–79 (2013).
13. Sepehrband, F., Wang, D.J.J. & Toga, A.W. Alzheimer’s Assoc. Int. Conf. (2018).
14.Li, X., Morgan, P.S., Ashburner, J., Smith, J. & Rorden, C. J. Neurosci. Methods264, 47–56 (2016).
15. Andersson, J.L.R., Skare, S. & Ashburner, J. Neuroimage20, 870–888 (2003).
16.Andersson, J.L.R. et al. Jt. Annu. Meet. ISMRM-ESMRMB20, 2426 (2012).
17.Cabeen, R.P., Laidlaw, D.H. & Toga, A.W. ISMRM-ESMRMB Abstr.12–14 (2014).
18.Powell, M.J.D. Cambridge NA Rep. NA2009/06, Univ. Cambridge, Cambridge26–46 (2009).
19.Sepehrband, F. et al. bioRxiv (2018).at <http://biorxiv.org/content/early/2018/08/20/395012.abstract>
Figures