3569
Improving Tractography in Baby Diffusion MRI via Asymmetric Spectrum Imaging1Department of Radiology and BRIC, University of North Carolina, Chapel Hill, Chapel Hill, NC, United States
Synopsis
Fiber tractography in baby diffusion MRI is challenging due to the low and spatially-varying diffusion anisotropy. In this abstract, we will introduce a method called asymmetric spectrum imaging (ASI) to improve estimation of white matter pathways in the baby brain by (1) incorporating an asymmetric fiber orientation model to help resolve subvoxel fiber configurations such as fanning and bending, and (2) explicitly modeling the spectrum of diffusion typical in the developing brain.
Introduction
In diffusion magnetic resonance imaging (DMRI)1, the orientation information at each voxel is encoded in a fiber orientation distribution function (FODF). Multi-tissue constrained spherical deconvolution (MTCSD)2 is an effective method for computing FODFs, taking into account response functions specific to white matter (WM), gray matter (GM), and cerebrospinal fluid (CSF). However, MTCSD is limited in that it uses a fixed set of response functions throughout the brain, ignoring the spatial changes in hindered and restricted diffusion, which is typical in the developing brain. Moreover, MTCSD lacks the capability to deal with complex axonal trajectory configurations such as fanning and bending due to its inherent assumption that the FODF needs to be antipodal symmetric. To tackle these limitations, we introduce a method called asymmetric spectrum imaging (ASI) to allow subvoxel orientation asymmetry and to take into account a wide-ranging spectrum of hindered/restricted diffusion.Methods
MTCSD2 voxel-wisely decomposes the diffusion signal $$$S_{\mathbf{p}}(\mathbf{g})$$$ for diffusion gradient $$$\mathbf{g}\in\mathbb{S}^2$$$ and voxel location $$$\mathbf{p}\in\mathbb{R}^3$$$ into three tissue types (anisotropic: white matter, isotropic: gray matter and cerebrospinal fluid), each represented as the spherical convolution of an antipodal and axially symmetric response function (RF)3 $$$R(\mathbf{g},\mathbf{u})$$$ and an antipodal symmetric FODF $$$F_{\mathbf{p}}(\mathbf{u})$$$, giving an overall signal of \begin{equation}S_{\mathbf{p}}(\mathbf{g}) = \int_{\mathbf{u}\in\mathbb{S}^2} R_{\text{WM}} (\mathbf{g},\mathbf{u})F_{\mathbf{p}}(\mathbf{u})d\mathbf{u} + h_{\mathbf{p},\text{GM}}R_{\text{GM}} + h_{\mathbf{p},\text{CSF}}R_{\text{CSF}},\end{equation}where $$$h_{\mathbf{p},\text{GM}}$$$ and $$$h_{\mathbf{p},\text{CSF}}$$$ are weights indicating the contribution of the WM and CSF, respectively.
ASI captures the asymmetry of the underlying fiber geometry in a local neighborhood by incorporating information from neighboring voxels in estimating asymmetric FODFs (AFODFs). Estimation of the AFODF is constrained by orientation continuity across voxels4. To capture changes in hindered/restricted diffusion across voxels, ASI employs a spectrum of RFs. Unlike the fixed set of RFs used in MTCSD, the spectrum of RFs in ASI allows the AFODF to be estimated correctly in spite of the changes in diffusion patterns. The ASI signal model is\begin{equation}S_{\mathbf{p}}(\mathbf{g}) = \int_{\mathbf{u}\in\mathbb{S}^2}\sum_{i=1}^{N_{\text{aniso}}}h_{\mathbf{p},i}^{\text{aniso}} R_{i}^{\text{aniso}}(\mathbf{g},\mathbf{u})\mathcal{F}_{\mathbf{p}}(\mathbf{u})+ \sum_{j=1}^{N_{\text{iso}}}h_{\mathbf{p},j}^{\text{iso}} R_{j}^{\text{iso}}.\end{equation}We solve for $$$\{h_{\mathbf{p},i}^{\text{aniso}}\}$$$, $$$\{h_{\mathbf{p},i}^{\text{iso}}\}$$$, and the asymmetric $$$\mathcal{F}_{\mathbf{p}}(\mathbf{u})$$$ of all voxels concurrently using the alternating direction method of multipliers (ADMM).
Results
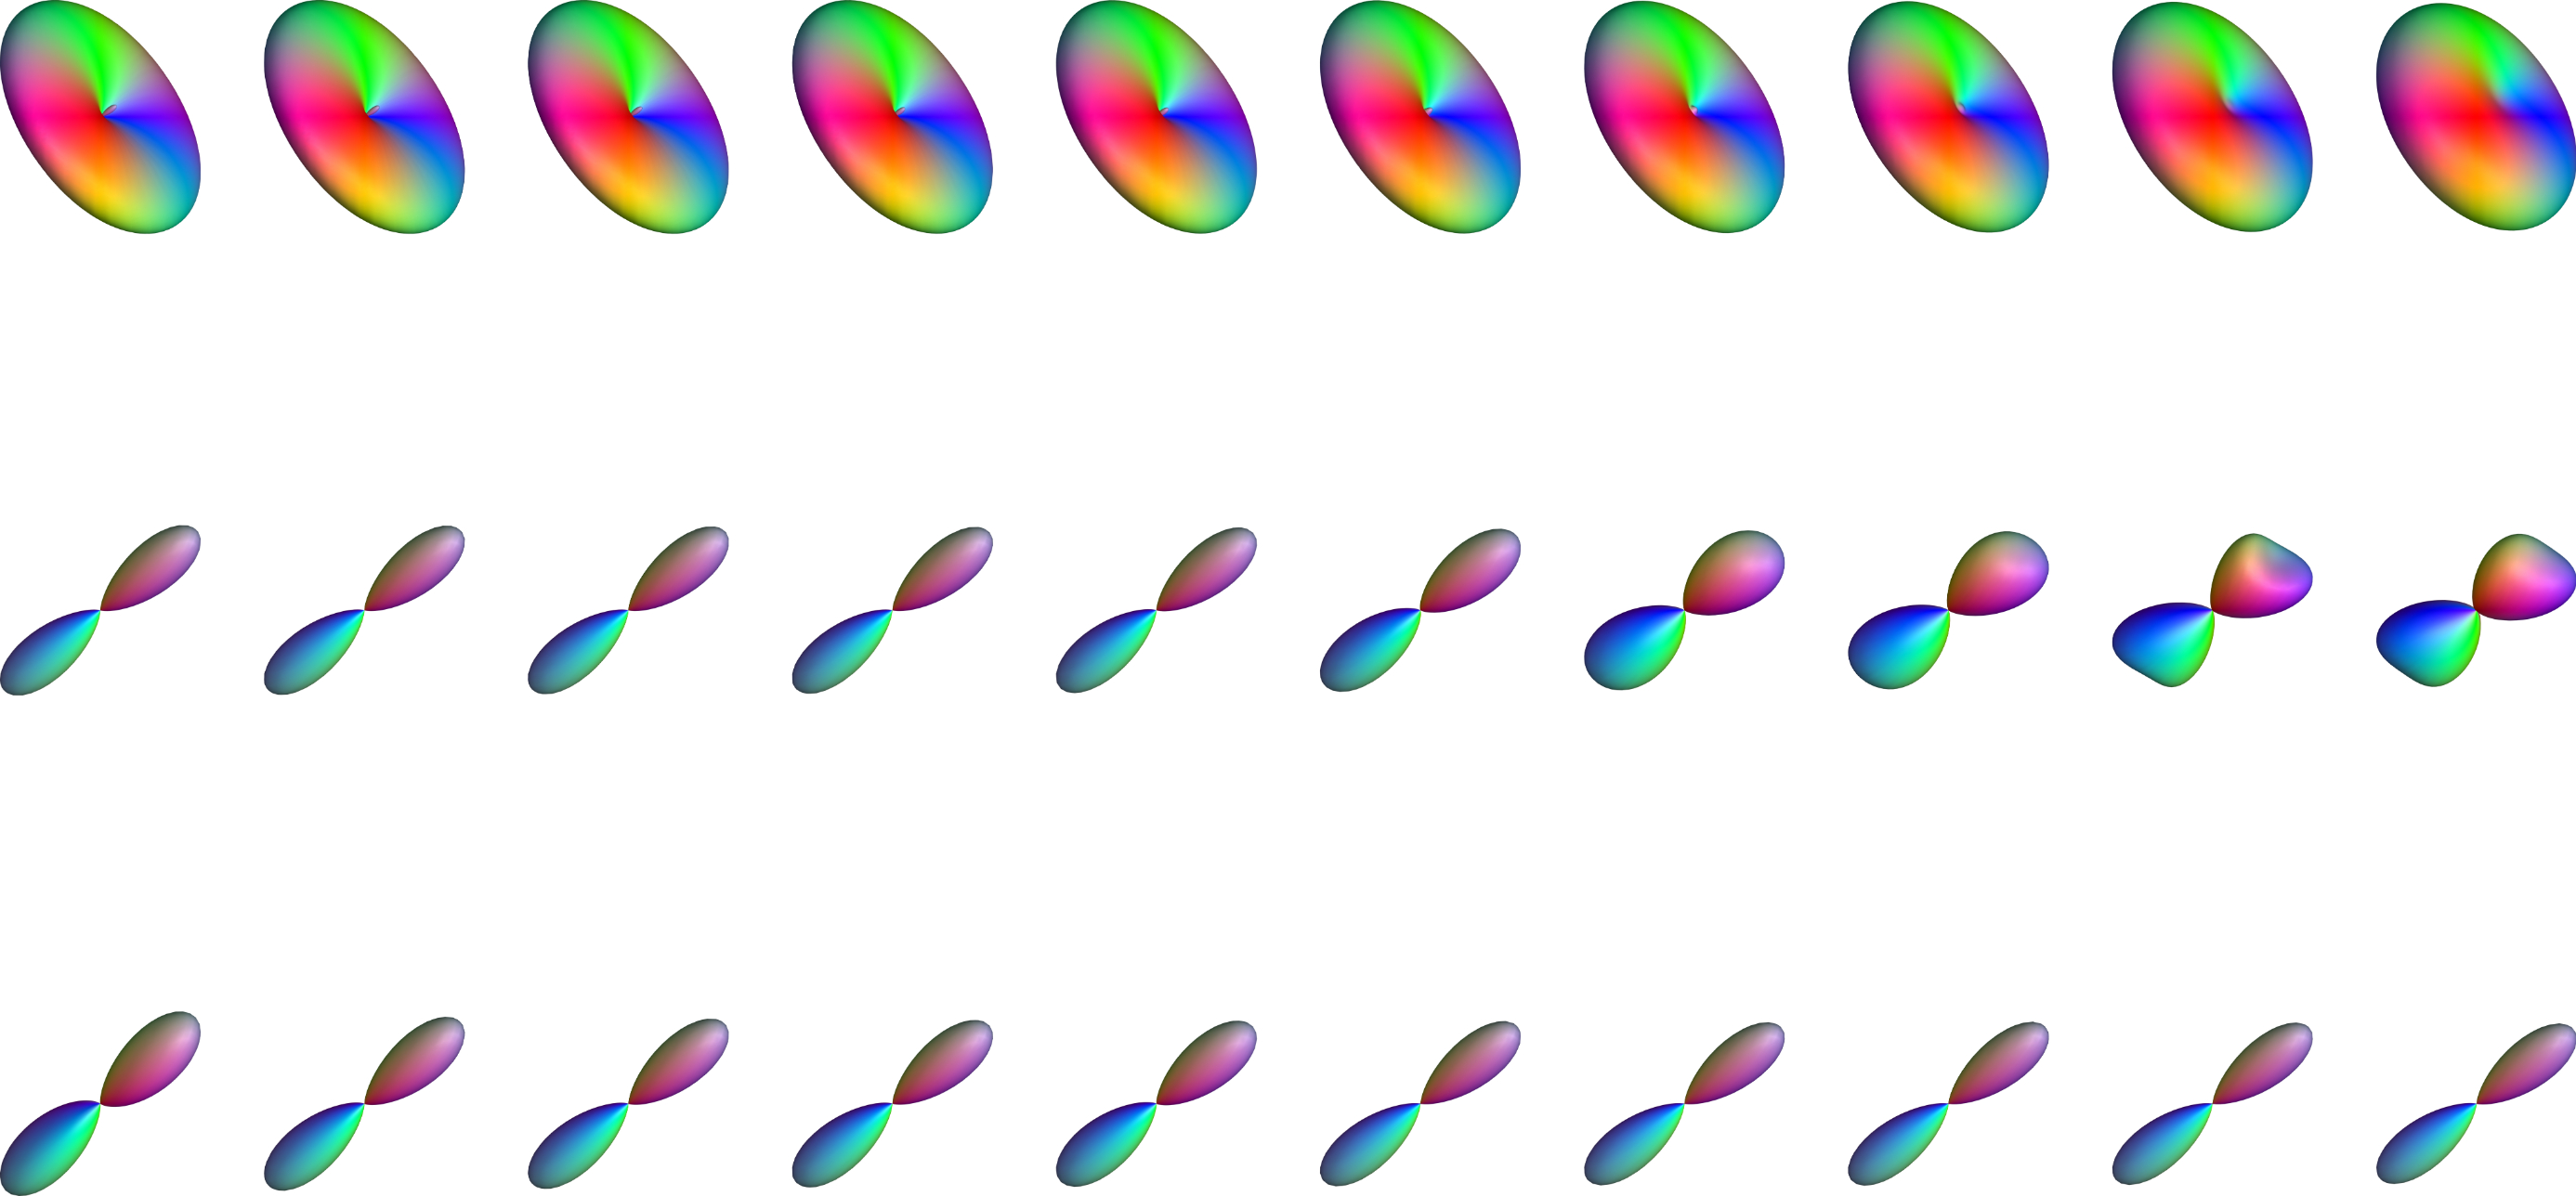
Figure 1 shows the FODFs estimated for diffusion profiles generated with increasing radial diffusivity and hence decreasing anisotropy. Unlike MTCSD, the FODFs estimated by ASI remain relatively consistent. This is crucial in ensuring that ASI will estimate sharp FODFs in low anisotropy regions typical in the baby brain.
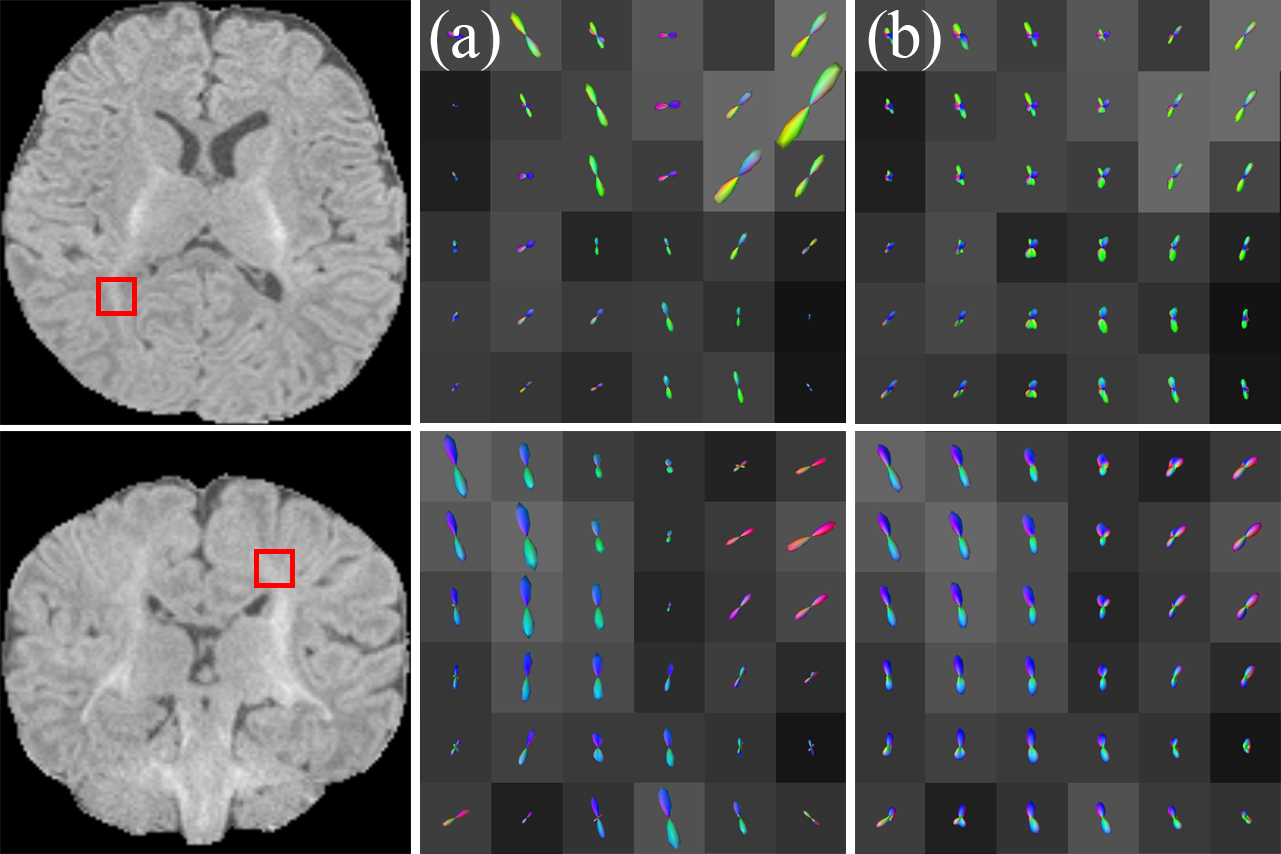
Figure 2 shows that the AFODFs given by ASI correctly reflect the complex WM fiber configurations.
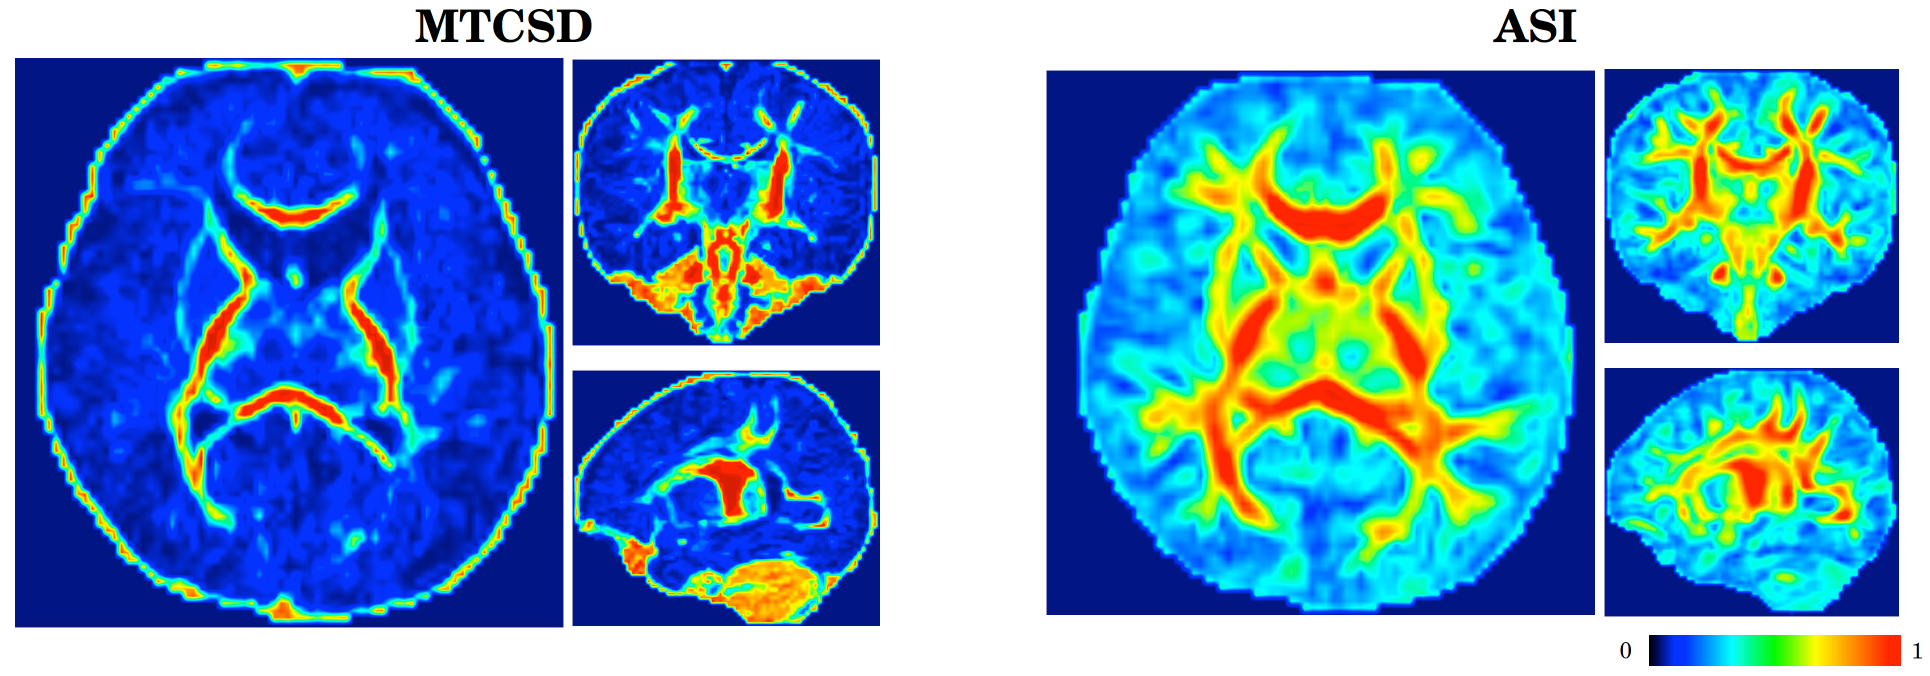
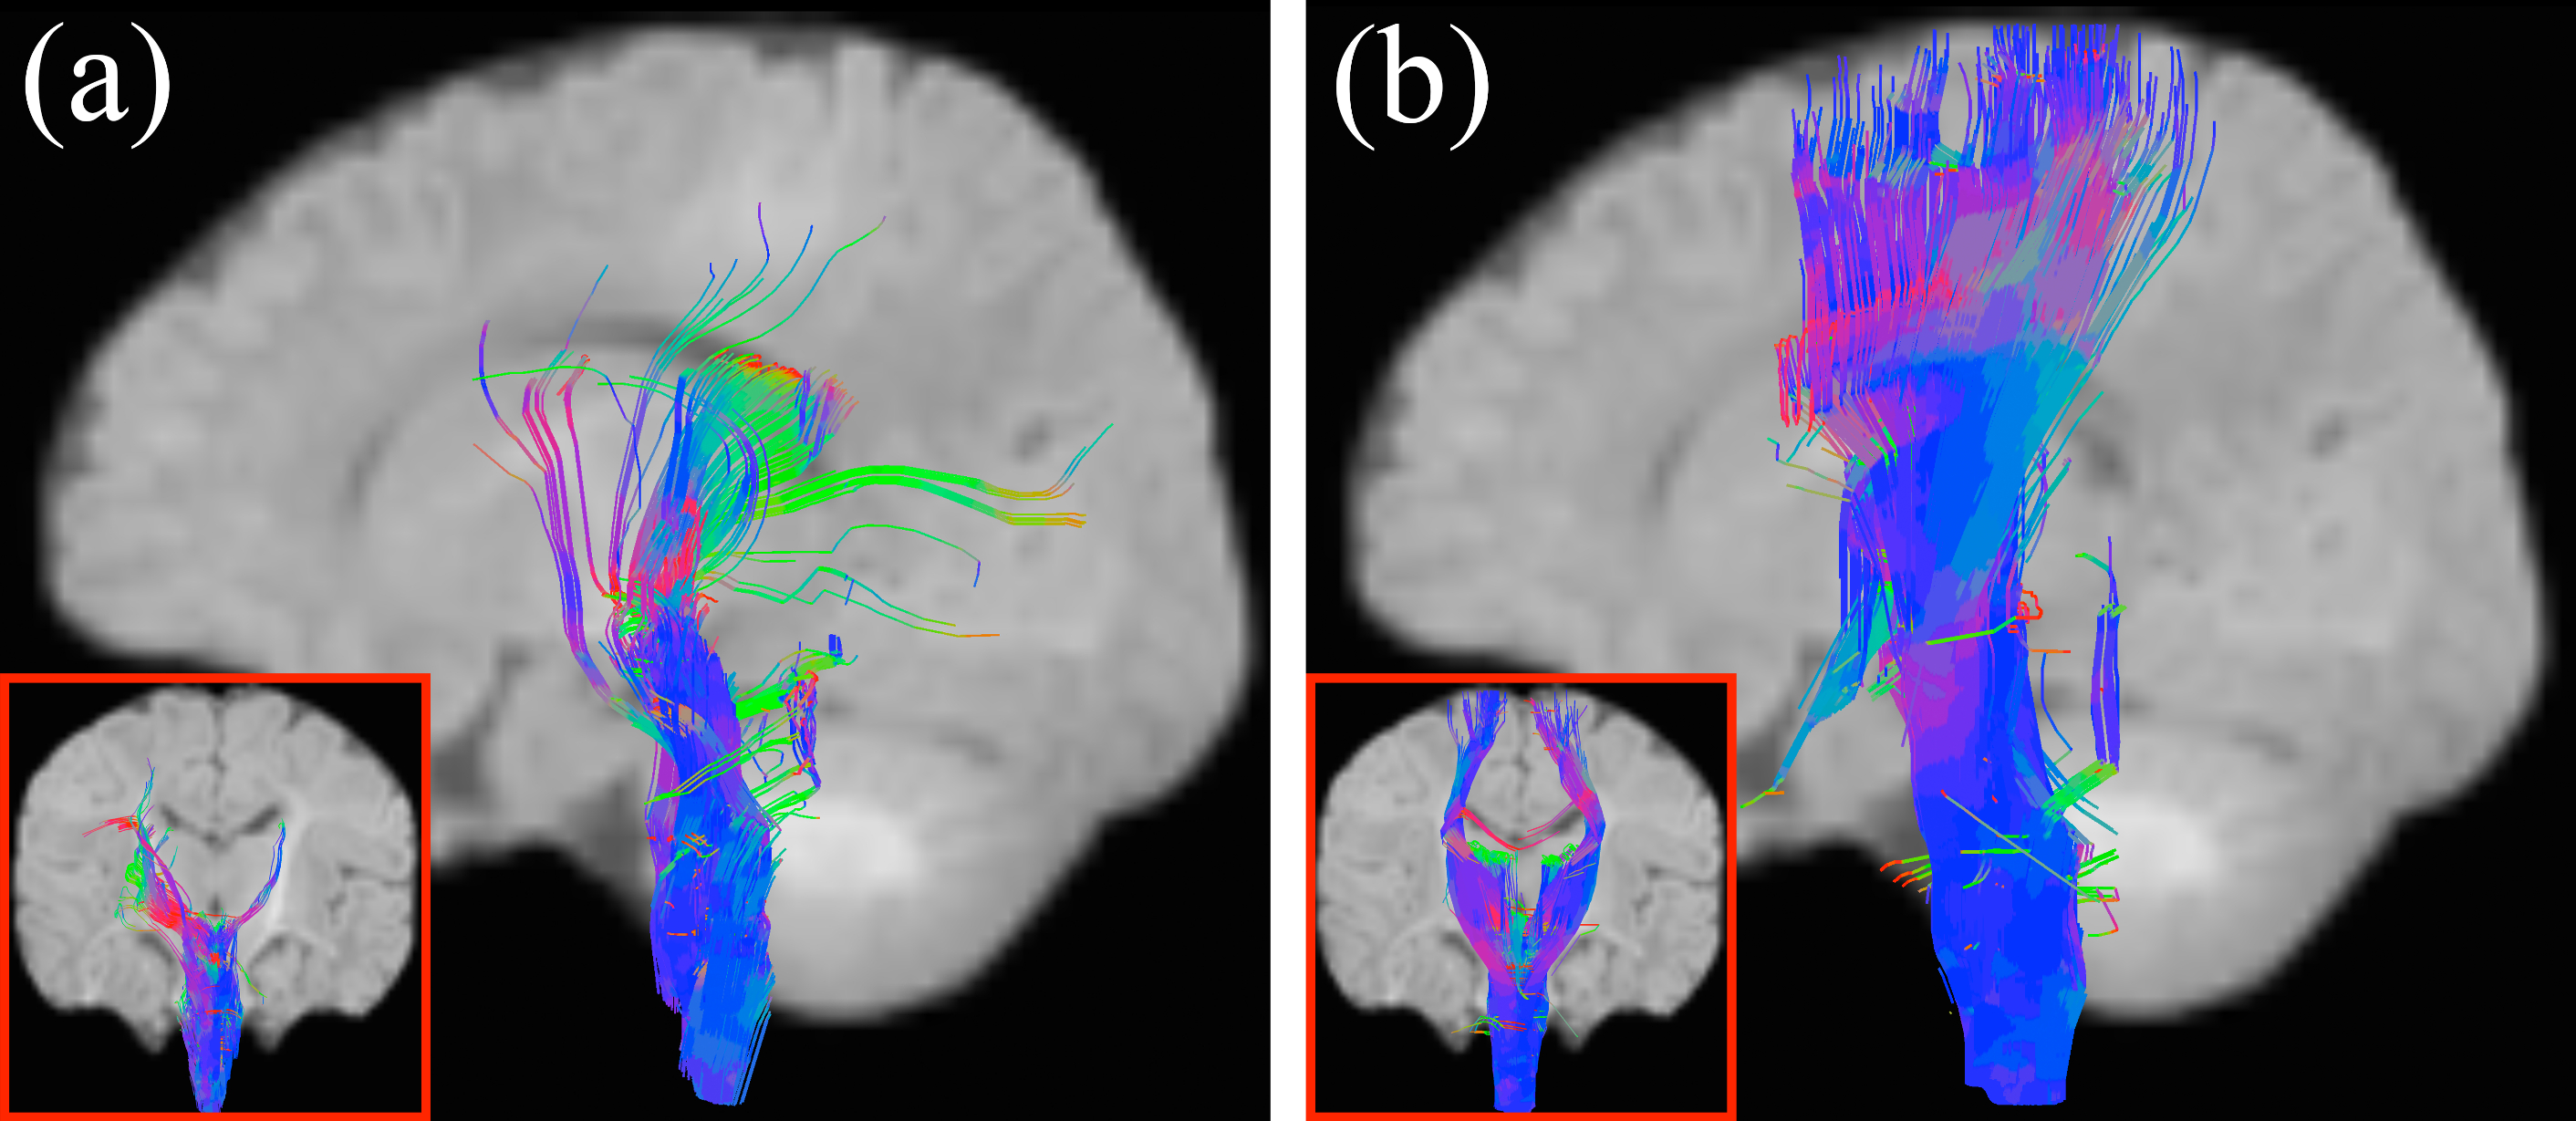
Figure 3 shows the generalized GFA maps of the FODFs estimated using MTCSD and ASI. The significantly higher GFA values given by ASI, especially in superficial WM regions, imply that tractography can be carried out more reliably. This is confirmed by Figure 4, indicating that the corticospinal tract (CST) can be tracked all the way in a 54-day-old pediatric subject from the brain stem to the cortex using the FODFs estimated using ASI but not MTCSD.
Conclusion
We have presented a method, called ASI, for effective tractography in the developing brain. ASI allows characterization of complex subvoxel fiber configurations and accurate estimation of the fiber orientation distribution function in spite of changes in diffusion patterns.Acknowledgements
This work was supported in part by NIH grants (NS093842, EB022880, and 1U01MH110274) and the efforts of the UNC/UMN Baby Connectome Project Consortium.References
1. Heidi Johansen-Berg and Timothy EJ Behrens. 2013. Diffusion MRI: from quantitative measurement to in vivo neuroanatomy. Academic Press.
2. Ben Jeurissen, Jacques-Donald Tournier, Thijs Dhollander, Alan Connelly, and Jan Sijbers. 2014. Multi-tissue constrained spherical deconvolution for improved analysis of multi-shell diffusion MRI data. NeuroImage 103 (2014), 411–426.
3. J-Donald Tournier, Fernando Calamante, and Alan Connelly. 2007. Robust determination of the fibre orientation distribution in diffusion MRI: non-negativity constrained super-resolved spherical deconvolution. Neuroimage 35, 4 (2007), 1459–1472.
4. Ye Wu, Yuanjing Feng, Dinggang Shen, and Pew-Thian Yap. 2018. A Multi-Tissue Global Estimation Framework for Asymmetric Fiber Orientation Distributions. In International Conference on Medical Image Computing and Computer-Assisted Intervention. Springer, 45–52.
Figures