3568
Polynomial Meta-Model of Bloch-Torrey Equation for Track-based Regularization of Microstructural Inversion1Mechanical Science and Engineering, Univeristy of Illinois at Urbana Champaign, Urbana, IL, United States, 2Biomedical Engineering, Illinois Institute of Technology, Chicago, IL, United States, 3Mechanical Science and Engineering, University of Illinois at Urbana Champaign, Urbana, IL, United States
Synopsis
A meta-model approach is presented which fits a multi-dimensional polynomial to numerical solutions of the Bloch-Torrey equation after being parameterized by microstructural and diffusion encoding parameters. This meta-model allows analytical representation of the solution space enabling analytical analysis of the space as well as
Introduction
Both gradient strength and diffusion time have been identified as important parameters to control when quantifying muscle microstructure with diffusion MRI.1-4 Determining which of these encoding parameters yield the most structural information into the dMRI signal will allow more accurate estimation of microstructural parameters. Diffusion MRI is governed by the Bloch-Torrey equation which is a 2nd order PDE. Solving this equation over a realistic domain requires computationally expensive numerical solutions. Being able to interpolate between already computed points saves computational time and allows rapid solution times. In this abstract, we fit a polynomial surface to numerical solutions of the Bloch-Torrey equation to provide an analytical representation, or metamodel, of the relationship between the microstructural parameters, diffusion encoding parameters, and the dMRI signal.Methods
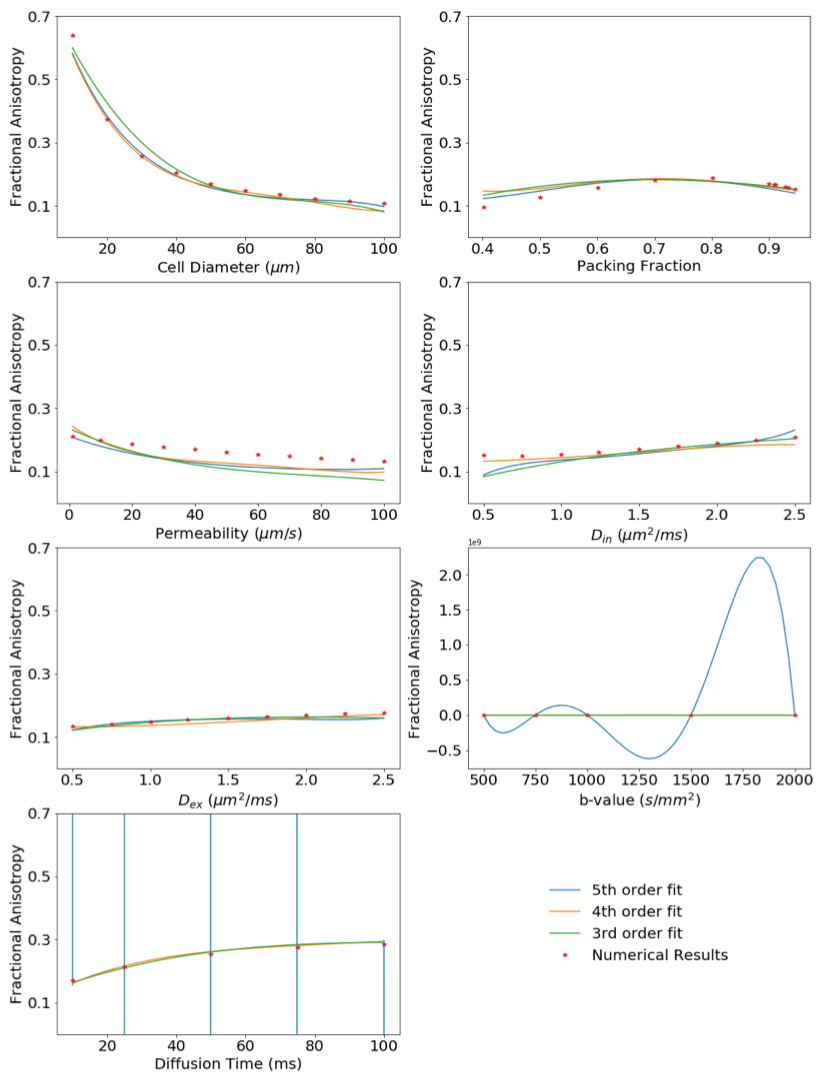
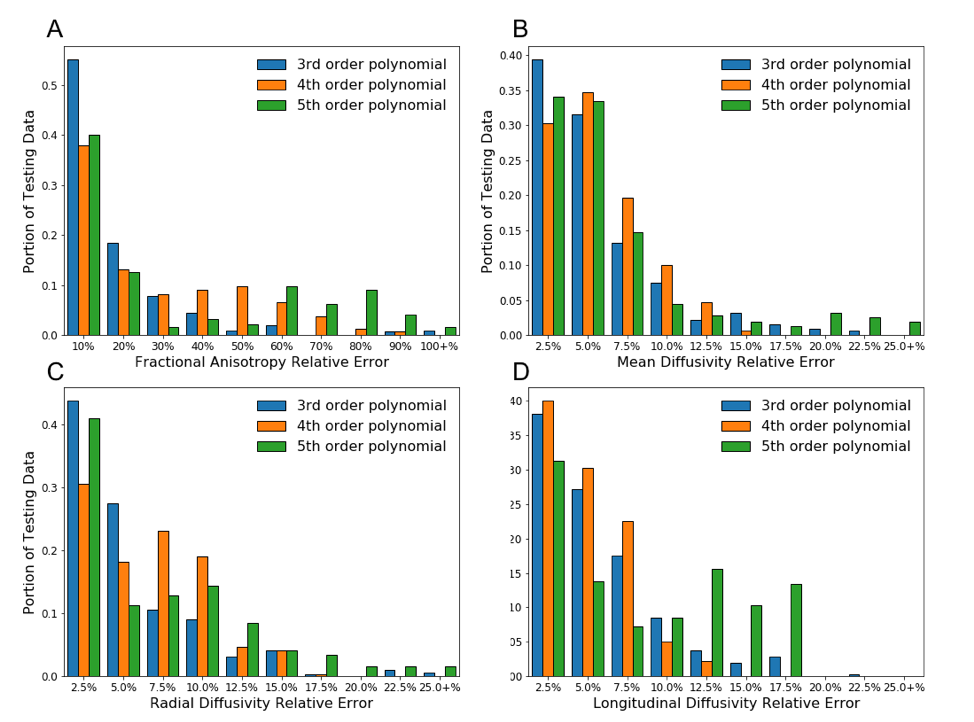
Using a numerical model based on a Lattice Boltzmann Method solution of the Bloch-Torrey equation,5 dMRI experiments were computed6 over a domain of periodically packed hexagonal cells surrounded by a permeable membrane and embedded in an extracellular matrix. The domain was parameterized by intra- and extracellular diffusion, cell diameter, membrane permeability, and volume fraction and sampled with a Sobol sequence7 to create 1600 parameter combinations (Din,ex∈[0.5,3] μm2/ms, a∈[10,100] μm, κ∈[1,150] μm/s, f ∈ [0.4, 0.95]). PGSE sequences were simulated for 5 b-values (500, 750, 1000, 1500, and 2000 s/mm2). At each b-value 5 diffusion times (Δ) were simulated (10, 25, 50, 75, and 100 ms) with a gradient timing of 7.5 ms. Six gradient directions were used to estimate a diffusion tensor from which fractional anisotropy (FA), mean diffusivity (MD), longitudinal diffusivity (LD) and radial diffusivity (RD) were extracted. Further simulations were performed with a single microstructural parameter varied and all other parameters held constant and for a different Sobol sequence to generate an additional 320 parameter combinations. The opensource python package Chaospy8 was used to create a metamodel which fit microstructural and DTI encoding parameters to each of the four DTI metrics (i.e. FA = f(Din, Dex, a, κ, f, b, Δ)). Polynomials of order n were fit using least squares for n = 3, 4, and 5.Results
Comparison of the fitted polynomial meta-model with the numerical testing data for variations of a single parameter at a time is shown in for FA Figure 1. Figure 2 shows how the Sobol testing data compares with the fitted polynomials for various orders of n. Diffusion coefficients are fit with much higher accuracy than FA. A sufficient number of points is necessary to constrain the fitted polynomial in each dimension, a criterion not satisfied for the 5th order polynomial in terms of b-value of diffusion time demonstrating the limits of such a modeling procedure.Discussion and Conclusion
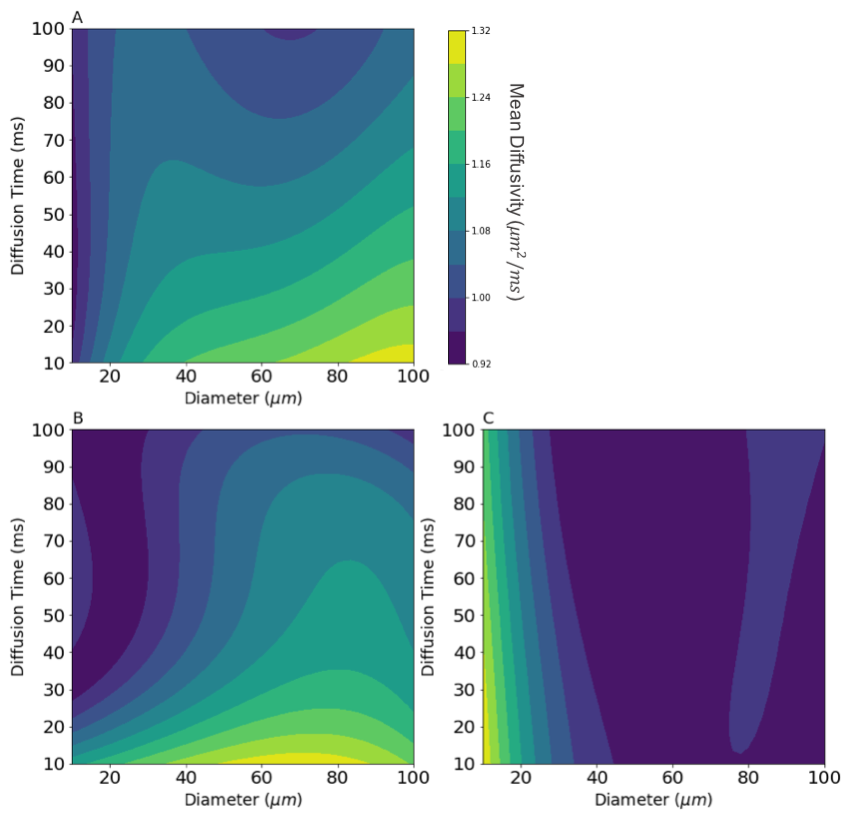
The primary goal of this abstract was to determine the feasibility and accuracy of such a metamodel representation of the Bloch-Torrey equation. While more work can be done to improve the fitting procedure, it is clearly possible to represent the overall behavior of the equation through use of such a hypersurface. The utility of such a surface is the ability to analytically represent the relationship between microstructure, DTI pulse parameters, and the resulting DTI measurements, allowing analysis of regions of high or low sensitivity to changes in parameters (Figure 3). Knowledge of parameter sensitivity is important in determining confidence intervals when estimating microstructure and can determine which diffusion encoding parameters needed to be sensitive to change in a particular microstructural parameter. Additionally, by assuming that muscle structure is smoothly and slowly varying between voxels, this surface can be used to regularize predicted microstructure. In such a system, an initial subsurface at each voxel of the possible parameters (Pi) would be generated that satisfy the condition FAi ∩ MDi ∩ LDi ∩ RDi. This subsurface could then be regularized by nearby voxels by examining Pi ∩ Pj subject to some relaxation condition, or, if such an intersection does not exist, by examining the shortest distance between the two subsurfaces Pi and Pj. This regularization approach can be combined with tractography to regularize by voxels in the same muscle track. Histology of different muscles can create priors for allowable parameter values allowing the creation of a DTI parameter atlas which can inform such track-based microstructural inversion. The results presented in this abstract demonstrate that a metamodel representation of the Bloch-Torrey equation is possible and point to future methods of exploiting its features in bolstering microstructural estimation in skeletal muscle.Acknowledgements
Funding for this work was provided by NSF Grant CMMI-1437113 and NSF Graduate Research Fellowship for NMN. This work used the Extreme Science and Engineering Discovery Environment (XSEDE), which is supported by National Science Foundation grant number ACI-1548562 and provided access to the SDSC Comet Cluster under allocation #TG-MCB180044.References
[1] Porcari, P., Hall, M. G., Clark, C. A., et al. (2018). The effects of aging on mouse muscle microstructure: a comparative study of time-dependent diffusion MRI and histological assessment. NMR in Biomedicine, 31(3), e3881.
[2] Filli, L., Kenkel, D., Wurnig, M. C., & Boss, A. (2016). Diffusional kurtosis MRI of the lower leg: changes caused by passive muscle elongation and shortening. NMR in Biomedicine, 29(6), 767–775.
[3] Scheel, M., von Roth, P., Winkler, T., et al. (2013). Fiber type characterization in skeletal muscle by diffusion tensor imaging. NMR in Biomedicine, 26(10), 1220–1224.
[4] Kim, S., Chi-Fishman, G., Barnett, A. S., & Pierpaoli, C. (2005). Dependence on diffusion time of apparent diffusion tensor of ex vivo calf tongue and heart. Magnetic Resonance in Medicine, 54(6), 1387–1396.
[5] Naughton, N. M., Tennyson, C. G., & Georgiadis, J. G., Lattice Boltzmann method for simulation of diffusion magnetic resonance imaging physics in heterogeneous tissue models. Journal of Computational Physics, (submitted 2018)
[6] Towns, J., Cockerill, T., Dahan, M., Foster, I., et al. (2014). XSEDE: accelerating scientific discovery. Computing in Science & Engineering, 16(5), 62-74.
[7] Herman, J. and Usher, W. (2017) SALib: An open-source Python library for sensitivity analysis. Journal of Open Source Software, 2(9).
[8] Feinberg, J., & Langtangen, H. P. (2015). Chaospy: An open source tool for designing methods of uncertainty quantification. Journal of Computational Science, 11, 46-57.
Figures