3567
Non-parametric axon diameter distribution mapping with PGSE: reconstruction of uni- and multimodal distributions1Signal Processing Lab (LTS5), Ecole Polytechnique Fédérale de Lausanne, Lausanne, Switzerland, 2Danish Research Center for Magnetic Resonance, Copenhagen University Hospital Hvidovre, Hvidovre, Denmark, 3Department of Computer Science, University of Verona, Verona, Italy, 4Department of Radiology, University Hospital Center and University of Lausanne, Lausanne, Switzerland, 5Department of Applied Mathematics and Computer Science, Technical University of Denmark, Kongens Lyngby, Denmark
Synopsis
White matter diffusion MRI enables non-invasive estimation of the axon diameter distribution, which is of interest as it modulates communication speed and delays between brain regions, and changes during development and pathology. Distribution mapping is challenging: current methods simplify it by either estimating the mean diameter, imposing parametric distributions, or combining non-parametric approaches with Double Diffusion Encoding. We present a non-parametric framework based on a PGSE protocol. Simulations show robust reconstruction of unimodal and bimodal distributions. The method is sensitive to population specific changes within bimodal distributions, as long as the underlying populations are separated by a minimum distance.
Introduction
Estimating volume-weighted axon diameter distribution (ADD) from dMRI is challenging due to the ill-posedness of the problem. Current approaches involve using parametric methods combined with Pulsed Gradient Spin Echo (PGSE),1,2 non-parametric methods combined with Double Diffusion Encoding (DDE) dMRI,3 or estimating the mean diameter instead.4 Here, we present a method for non-parametric ADD reconstruction based on the PGSE sequence, and study its performance using simulations. We show that i) a 20-shell protocol allows robust uni- and bimodal ADD reconstruction, ii) for multimodal ADDs, a minimum distance between underlying populations is required to detect population specific changes.Methods
Reconstruction framework:
We assume the dMRI signal can be expressed as follows:3$$y=f_{ic}\sum_{i=1}^{N_r}\Psi(d_i)S_{cyl}(d_i,d_\parallel,\Omega^\star)+(1-f_{ic})S_{tensor}(d_\perp,d_\parallel,\Omega^\star)$$where $$$f_{ic}$$$ is the Intra-axonal Compartment (IC) volume fraction, $$$\Psi(d)$$$ is the ADD, $$$S_{cyl}$$$ is the dMRI signal for a cylinder5 of diameter $$$d_i$$$, parallel diffusivity $$$d_\parallel$$$ and PGSE protocol settings $$$\Omega^\star$$$, and $$$S_{tensor}$$$ is the dMRI signal for a zeppelin6 with perpendicular diffusivity $$$d_\perp$$$. The signal is acquired in 60 directions. We focus on ex-vivo imaging and IC signal only, and therefore fixed $$$d_\parallel=0.6\times10m.s^{-1}$$$ and $$$f_{ic}=1$$$. Equation 1 can be expressed as a linear formulation $$$y=Ax$$$, where x can be recovered from the convex inverse problem:3,7,8$$argmin_{x\geq 0}||Ax-y||^2_2+\lambda||\Gamma x_{ic}||_2^2$$Ill-posedness can be reduced by decreasing the mutual coherence of $$$A$$$ (using DDE9 for example), by using regularization $$$||\Gamma x||_2^2$$$),7 and/or by extracting the mean diameter index $$$a'$$$ instead of $$$\Psi$$$.4,8 We propose to combine Laplacian regularization $$$\Gamma=L$$$,7 with a PGSE protocol designed to maximize sensitivity to a range of diameters according to our biophysical model.
Protocol design and ADD reconstructions:
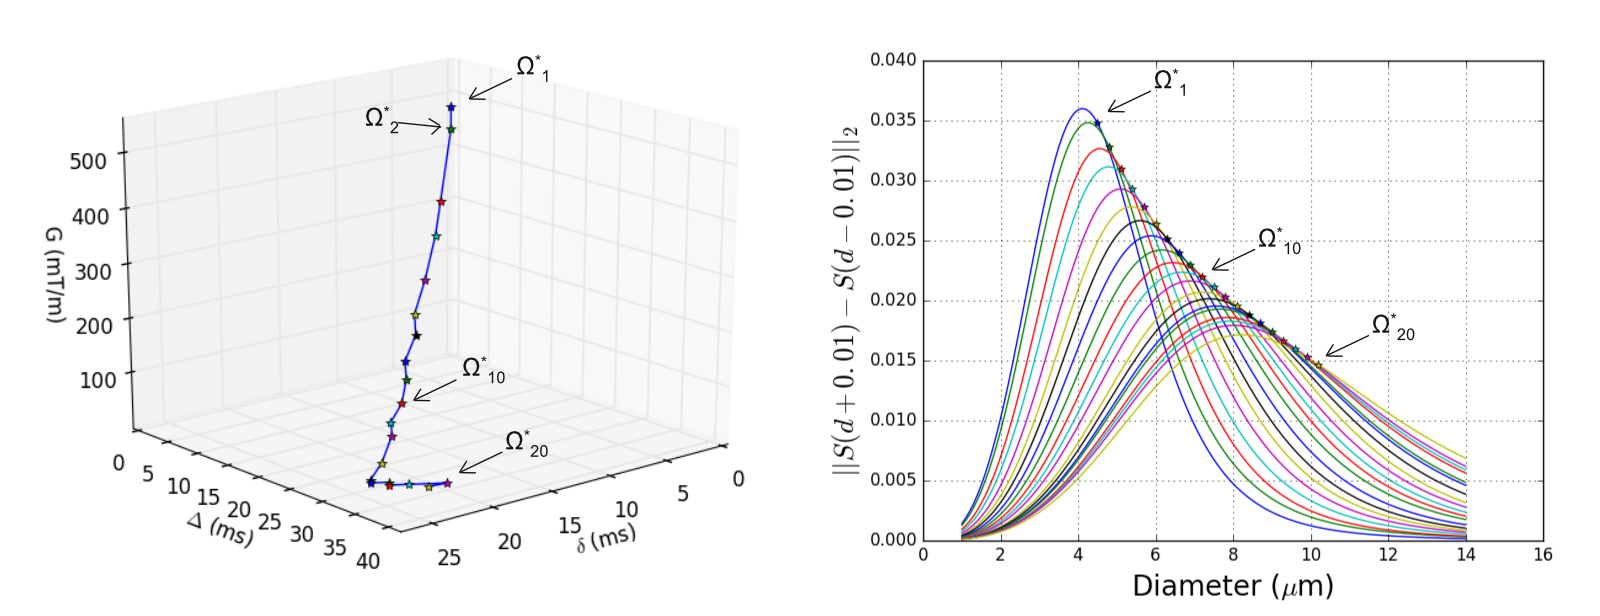
The PGSE parameter space is $$$\Omega={G,\Delta,\delta}$$$. We performed a grid-search on $$$\Omega$$$10 in order to find a set of 20 shells $$$\Omega^\star$$$ that maximized the sensitivity $$$S'(d_i)$$$ to a set of 20 diameters: $$$S'(d_i)=||S_{cyl}(d_i+\epsilon,\Omega_i)-S_{cyl}(d_i-\epsilon,\Omega_i)||_2$$$. We bounded $$$\Omega$$$ to $$$G_{max}=550mT/m$$$, 2.0<$$$\delta\leq$$$70ms and $$$\Delta\geq\delta+6ms$$$.
We computed the IC signal for cylinders with diameters sampled from different gamma distributions from histological samples,4 and reconstructed $$$\Psi$$$ from 100 noisy realisations (Rician noise, SNR=30, $$$\lambda=0.2$$$).
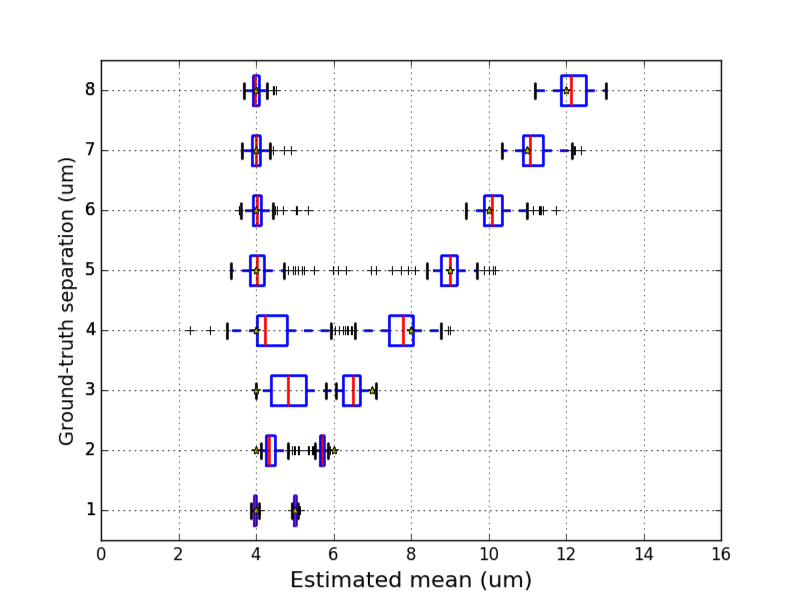
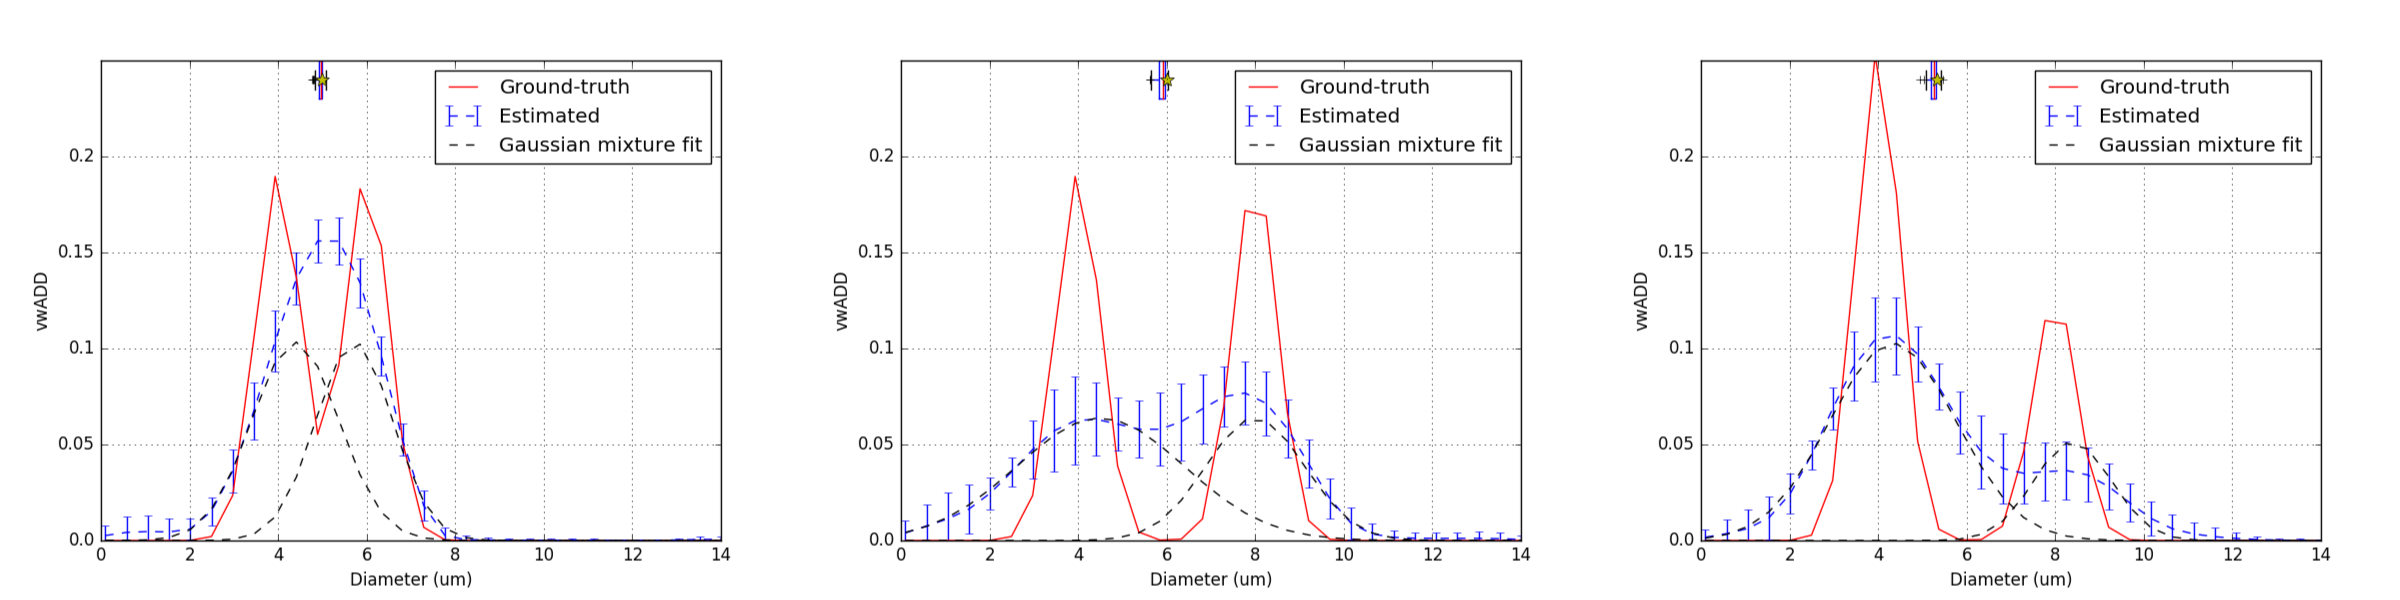
We then created bimodal distributions containing two gaussians: a first fixed population $$$N_1$$$ ($$$\mu_1$$$=4.0$$$\mu$$$m) and a second moving population $$$N_2$$$ with increasing mean $$$\mu_2$$$. We extracted two estimated means $$$\hat{\mu_1}$$$ and $$$\hat{\mu_2}$$$ by fitting a gaussian mixture model to the estimated $$$\Psi$$$. A second experiment tested if the method is sensitive to a reduction of 50% in the amplitude of $$$N_2$$$.
Results and discussion
The 20 selected shells maximize the sensitivity to diameters between 4.5$$$\mu$$$m and 10.0$$$\mu$$$m (Figure 1). By maximizing sensitivity to a set of diameters, differences between columns of $$$A$$$ are increased, reducing its mutual coherence.3
Unimodal distributions
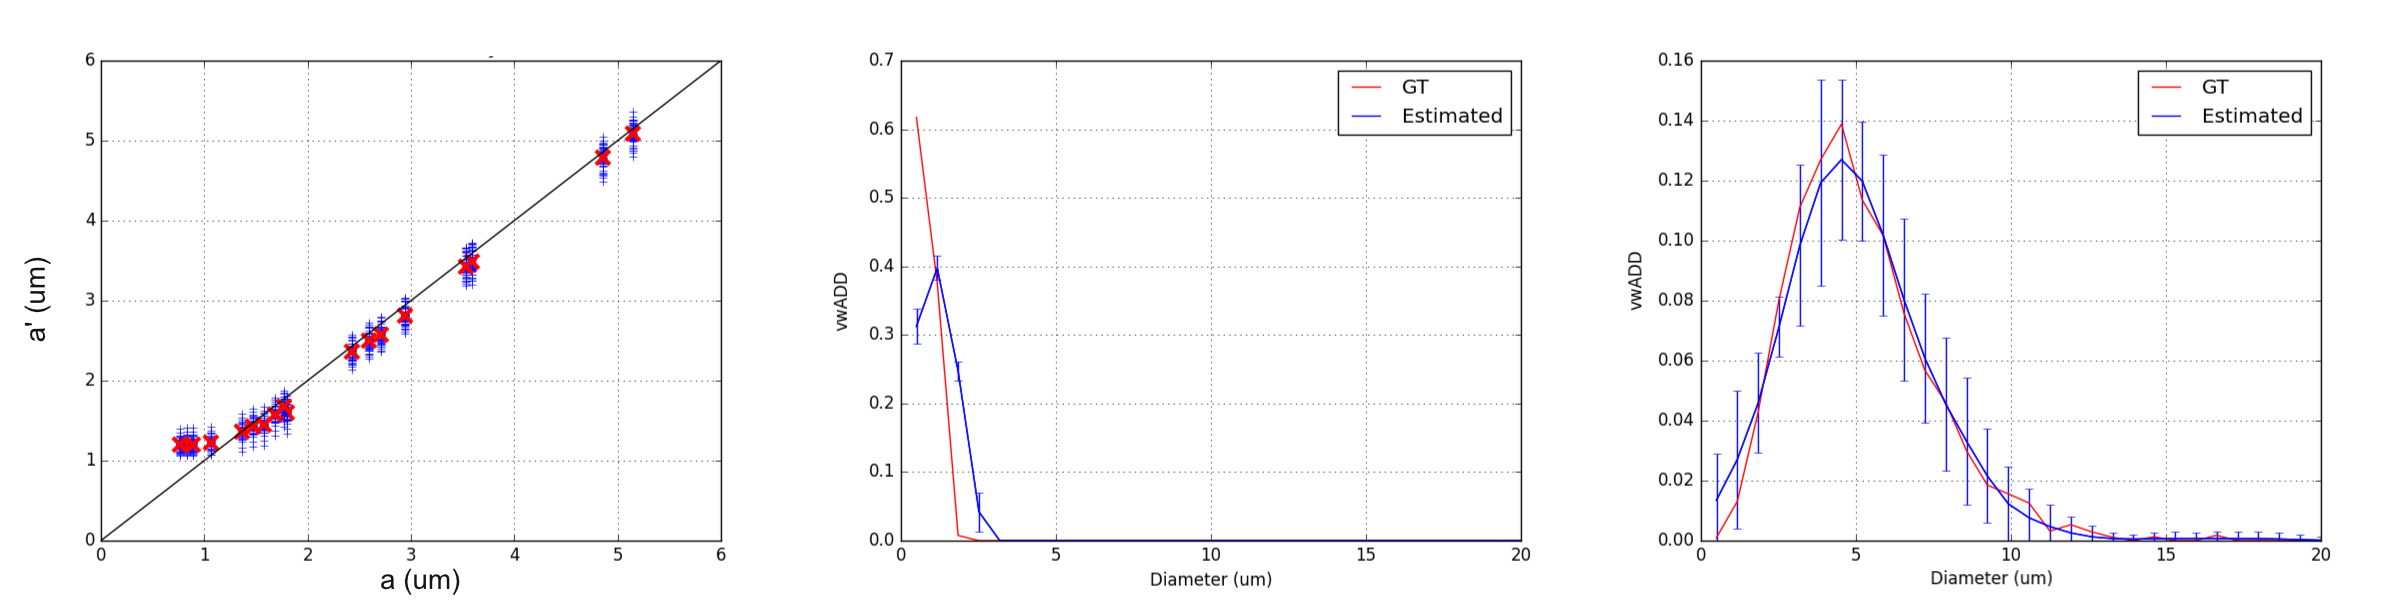
Unimodal distributions are reliably reconstructed for all simulations (Figure 2). The mean diameter index4 $$$a'$$$ is robustly estimated for values down to almost 1.0$$$\mu$$$m, although the expected lower bound has previously been shown to be around 2$$$\mu$$$m.11 The smaller lower bound could be due to prediction or extrapolation properties of the regularization.
Resolving two axonal populations
As shown in Figure 3, $$$N_1$$$ and $$$N_2$$$ should be separated by at least 4.0$$$\mu$$$m for their respective means to be recovered ($$$\mu_1$$$ and $$$\mu_2$$$ are not within the 1st and 3rd quartiles of $$$\hat{\mu_1}$$$ and $$$\hat{\mu_2}$$$ for smaller separations). This minimal separation depends on amplitude and variance of the populations. When the two populations are separated enough, $$$\mu_1$$$ and $$$\mu_2$$$ are well estimated and population specific changes can be detected (Figure 4). Interestingly, preliminary results indicate that removing the last 10 shells of $$$\Omega^\star$$$ compromised bimodal reconstructions while preserving robustness for unimodal distributions, showing that $$$\Omega^\star_{10-20}$$$ provides information for bigger diameters.
Conclusion
Mapping ADD changes is challenging due to the ill-posedness of the problem.7,9 Our simulations show the feasibility of reconstructing non-parametric unimodal and bimodal distributions using a simple IC model based on PGSE. We showed the sensitivity of the method to population specific changes within bimodal distributions, as long as the two populations are separated by a minimal distance. Nonparametric and multi-modal ADD designs could therefore identify changes in ADD that are known to occur in development12 and diseases, like multiple sclerosis,13 providing specific characterization of neuronal tissue microstructure. Such specific information cannot be achieved by current mean diameter mapping techniques as ActiveAx4 or parametric methods as AxCaliber.1 Future work will involve testing robustness to the extra-axonal compartment (which might bias estimates and influence the diameter lower bound) and acquisition of real ex-vivo datasets.Acknowledgements
This project was funded by the Swiss National Fundation, grant 31003A_157063References
1. Y. Assaf, T. Blumenfeld-Katzir, Y. Yovel, and P. J. Basser. AxCaliber: a method for measuring axon diameter distribution from diffusion MRI. Magn. Reson. Med. 2008;59:1347.
2. D. Barazany, P. J. Basser, and Y. Assaf. In vivo measurement of axon diameter distribution in the corpus callosum of rat brain. Brain. 2009;132:1210.
3. D. Benjamini, M. E. Komlosh, L. A. Holtzclaw, U. Nevo, and P. J. Basser. White matter microstructure from non parametric axon diameter distribution mapping. Neuroimage. 2016;135:333.
4. D. C. Alexander, P. L. Hubbard, M. G. Hall, E. A. Moore, M. Ptito, G. J. M. Parker, et al. Orientationally invariant indices of axon diameter and density from diffusion MRI. Neuroimage. 2010;52:1374.
5. P. van Gelderen, D. DesPres, P. C. van Zijl, and C. T. Moonen. Evaluation of restricted diffusion in cylinders. Phosphocreatine in rabbit leg muscle. J. Magn. Reson. B. 1994;103:255.
6. E. Panagiotaki, T. Schneider, B. Siow, M. G. Hall, M. F. Lythgoe, and D. C. Alexander. Compartment models of the diffusion MR signal in brain white matter: A taxonomy and comparison. Neuroimage. 2012;59:2241.
7. K. G. Hollingsworth and M. L. Johns. Measurement of emulsion droplet sizes using PFG NMR and regularization methods. J. Colloid Interface Sci. 2003;258:383.
8. A. Daducci, E. J. Canales-Rodríguez, H. Zhang, T. B. Dyrby, D. C. Alexander, and J.-Ph. Thiran. Accelerated Microstructure Imaging via Convex Optimization (AMICO) from diffusion MRI data. Neuroimage. 2015;105:32.
9. D. Benjamini, Y. Katz, and U. Nevo. A proposed 2D framework for estimation of pore size distribution by double pulsed field gradient NMR. J. Chem. Phys. 2012;137:224201.
10. I. Drobnjak, H. Zhang, A. Ianus, E. Kaden, and D. C. Alexander. PGSE, OGSE, and Sensitivity to Axon Diameter in Diffusion MRI: Insight from a Simulation Study. Magn. Reson. Med. 2016;75:688.
11. T. Dyrby, L. Sogaard, M. Hall, M. Ptito, and D. C. Alexander. Contrast and stability of the axon diameter index from microstructure imaging with diffusion MRI. Magn. Reson. Med. 2013;70:711.
12. R. Colello and M. Schwab. A role for oligodendrocytes in the stabilization of optic axon numbers. J.Neurosci. 1994;14.
13. G. C. DeLuca, G. C. Ebers, and M. M. Esiri. Axonal loss in multiple sclerosis: a pathological survey of the corticospinal and sensory tracts. Brain. 2004;127:1009.
Figures