3565
On the feasibility of apparent exchange rate mapping in non-periodic systems with multiple cell sizes1Department of Medical Physics in Radiology, German Cancer Research Center (DKFZ), Heidelberg, Germany, 2Faculty of Physics and Astronomy, Heidelberg University, Heidelberg, Germany, 3Institute of Radiology, University Hospital Erlangen (FAU), Friedrich-Alexander-Universität Erlangen-Nürnberg, Erlangen, Germany
Synopsis
Apparent exchange rate (AXR) mapping might provide an insight into the exchange of water between intra- and extracellular space by using a double-diffusion encoded sequence with varying mixing times between the two gradient pairs. The connection between AXR and permeability has already been validated for simplified two-compartment models. However, multi-compartment systems and non-periodic geometries have not been evaluated so far. In this study, we were able to show that it is also possible to reliably connect permeabilities to AXR-values for these geometries. Furthermore, the AXR was only dependent on average cell size and not on the number of compartments.
Introduction
The exchange of water between intra- and extracellular space is an important biological process in human physiology. It is therefore of high interest to noninvasively measure this parameter in clinics, potentially leading to new diagnostic possibilities. For this purpose, the filter-exchange imaging (FEXI) technique, which is also called apparent exchange rate (AXR) mapping, was proposed by Lasič et al. [1,2]. It was previously shown that the AXR can be correlated to the membrane permeability for periodic two-dimensional grids over a broad range of permeabilities [3,4]. In this study, we wanted to focus on randomized grids and size distributions of simulated cells, in order to investigate the behavior of AXR in more realistic multi-compartment systems.Methods
Simulations
were performed using Monte Carlo Simulations with GPU acceleration implemented
in MATLAB (The MathWorks, Inc., Natick, MA). A schematic representation of the
AXR sequence can be found in Figure 1. Transition probabilities for random
walkers encountering a membrane were calculated according to [5]. Random
walkers which were not allowed to cross the membrane were elastically
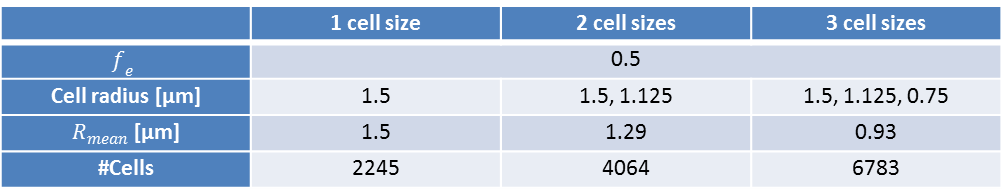
reflected. For this study, we used randomly positioned 2D cylinders with one,
two, and three diameters and a packing density of 50%. The grids used for the
simulations are shown in Figure 2. The 3 grids had been precomputed and were then
used for all simulations. More detailed information about the grids can be
found in Table 1. The grid size was set to 200 µm2,
since larger grids had no further influence on the simulation results. To
evaluate the influence of the membrane permeability, 10 logarithmically spaced
permeabilities between$$$\,\rho=0.0005\,$$$µm/ms and$$$\,\rho=0.05\,$$$µm/ms were
simulated. Simulation of ADC-values was carried out for 10$$$\,t_m$$$ with a maximal value of$$$\,8/AXR$$$;
values larger than one second were always set to$$$\,t_{m,max}=1\,$$$s due
to the limitation of the mixing time by T1-relaxation in real world
experiments. The gradient duration for the filter block was set to$$$\,t_f=14\,$$$ms and
the echo time was set to$$$\,T_f=28\,$$$ms, while
the diffusion weighting was set to $$$t_d=16\,$$$ms and $$$T_d=32ms\,$$$. Gradient
amplitude was set to$$$\,G_f=G_d=0.8\,$$$T/m. Equilibrium
ADC-values were simulated with$$$\,G_f=0\,$$$T/m. The
step-size for all simulations was$$$\,dt=5\,$$$µs.
In order to allow for some statistical analysis, 8 averages with
75000 particles each were simulated. The particle count was chosen to adjust
fluctuations due to Monte-Carlo-noise to a range which may be similar to actual
experiments. The reference
AXR-values were calculated using:$$AXR_{reference}=\rho\cdot\frac{S_{cell}}{V_i}\cdot\frac{1}{f_e},$$where $$$S_{cell}$$$ is the surface of the cell and $$$V_i$$$ the volume and $$$f_e=(V_{total}-V_{inside})/V_{total}$$$.
Reference AXR-values were then calculated using the average cell radius
shown in table 1. AXR-values were fitted according to [1].
Results
Exemplary ADC-curves, using$$$\,\rho=0.0039\,$$$µm/ms (A) and$$$\,\rho=0.03\,$$$µm/ms (B) for the three grids, are shown in Figure 3. For the lower permeability, the error introduced by the simulation is much smaller than the change in ADC-values between the mixing times, whereas the error becomes large in comparison to the change for the higher permeability. The standard deviation of the ADC-values represents the noise which is in the range of 5% and may thus be similar to real world experiments. The ADC-curves show no influence of higher compartment counts. AXR-results are shown in Figure 4. The reference AXR-value for each of the grids was calculated using the mean cell radius given in table 1. The AXR-values for all three grids correspond well to the reference values for small to medium permeabilities. For the higher permeabilities, highlighted by the light red area in Figure 4, the change in ADC-values between the different mixing times had the same order of magnitude as the noise of the Monte-Carlo simulations (Figure 3), leading to decreased fitted values. These results deviate from the reference AXR and also show an increased standard deviation. For lower permeabilities, the presented data indicate that the AXR is only dependent on the average cell size and thus on the average exchange rate of the system, even for multi-compartment systems.Discussion and Conclusion
The deviations for high permeabilities in Figure 4 are mainly governed by the effects of noise shown in Figure 3. This limitation is, of course, not influenced by the compartment count but solely dependent on signal-to-noise and thus on the number of simulated particles in this study. However, the presented data still show that, regardless of the number of compartments, the systems are well described by the theory when only using the average cell radius and the packing density for AXR calculations. This unfortunately also means that AXR measurements presumably cannot be used to distinguish between different permeabilities and cell size distributions.Acknowledgements
Financial support by the DFG (Grant No. KU 3362/1-1 and LA 2804/6-1) is gratefully acknowledged.
One of the two Titan Xp GPUs used for this study was donated by the NVIDIA Corporation.
References
[1] Lasič, Samo, et al. "Apparent exchange rate mapping with diffusion MRI." Magnetic resonance in medicine 66.2 (2011): 356-365.
[2] Nilsson, Markus, et al. "Noninvasive mapping of water diffusional exchange in the human brain using filter‐exchange imaging." Magnetic resonance in medicine 69.6 (2013): 1572-1580.
[3] Tian, Xin, et al. "Evaluation and comparison of diffusion MR methods for measuring apparent transcytolemmal water exchange rate constant." JMR 275 (2017): 29-37.
[4] Ludwig, Dominik et al. “Apparent exchange rate mapping: relation to membrane permeability” ISMRM Annual Meeting 2018, In proc., E-Poster #3231
[5] Fieremans, Els, et al. "Monte Carlo study of a two‐compartment exchange model of diffusion." NMR in Biomedicine 23.7 (2010): 711-724.
Figures