3562
Estimating mixtures of 6D diffusion tensor distributions with "Magic DIAMOND": are b-plates better than b-spheres?1Université de Sherbrooke, Sherbrooke, QC, Canada, 2MR Clinical Science, Philips Healthcare Canada, Markham, ON, Canada, 3Dept. of Radiology, Boston Children’s Hospital, Boston, MA, United States
Synopsis
Tensor-valued diffusion encoding enables disentangling isotropic and anisotropic diffusion components. However, its impact on estimating brain microstructural features has only been studied in a handful of parametric models. In this work, we evaluate the Magic DIAMOND model, that allows characterization of crossing fascicles and assessment of diffusivities for each, using combinations of linear, planar and spherical encodings in vivo. Building statistics through stratified bootstrap, we show that spherical encoding substantially increases the variance in estimated parameters and should be avoided. Planar encoding, on the other hand, did not offer clear improvement or worsening within our current acquisition scheme and setup.
Context and purpose
Complementing the single (linear) diffusion encoding yielded by "Stejskal-Tanner"-like sequences1, double2 (planar) and triple3 (spherical) diffusion encodings have recently drawn much attention4-10, especially with the emergence of tensor-valued diffusion encoding11-15. From a modeling standpoint, the main interest lies in assessing whether the estimation of microstructural features benefits from non-trivial diffusion encodings or not. The impact of planar and spherical encodings has already been investigated in “ball and stick”-like models such as the white matter Standard Model16 and NODDI17, focusing mainly on precision18,19 and degeneracy20,21 in parameter estimation. In this work, we study their impact on a multi-fascicle compartment model, the Magic DIAMOND model22, a b-tensor extension of the DIAMOND model23,24 that allows not only modeling of crossing fascicles but also individual characterization of their diffusional features.
Theory
Within Magic DIAMOND22, the diffusion-weighted signal is modeled in each voxel as the weighted sum over a free water (FW) compartment and up to three anisotropic compartments (fascicles) of the Laplace transforms of each compartment's diffusion tensor distribution (DTD):$$\frac{\mathcal{S}(\mathbf{B})}{\mathcal{S}_0}=f_\text{FW}\,\frac{\mathcal{S}_\text{FW}(b)}{\mathcal{S}_0}+\sum_{j=1}^{N_\text{f}}f_j\,\frac{\mathcal{S}_j(\mathbf{B})}{\mathcal{S}_0}=f_\text{FW}\,\mathrm{exp}(-bD_\text{FW})+\sum_{j=1}^{N_\text{f}}f_j\int_{\mathbf{D}\in\mathrm{Sym}^+(3)}\!\mathcal{P}_{\Gamma,j}(\mathbf{D})\,\mathrm{exp}(-\mathbf{B}:\mathbf{D})\,\mathrm{d}\mathbf{D}\,,$$where $$$\mathcal{S}_0=\mathcal{S}(\mathbf{B}=\mathbf{0})$$$, the $$$f$$$'s are the different signal fractions, $$$N_\text{f}\in\{0,1,2,3\}$$$ is the number of intra-voxel fascicles, $$$\mathrm{Sym}^+(3)$$$ is the set of $$$3\times 3$$$ symmetric positive-definite matrices, $$$\mathbf{B}$$$ is the b-tensor associated to the q-space trajectory, $$$b=\mathrm{Tr}(\mathbf{B})$$$ is the usual b-value, and $$$\mathbf{B}:\mathbf{D}=\sum_{ik}B_{ik}\,D_{ik}$$$ is the Frobenius inner product. Model selection based on the Akaike criterion is performed to set $$$N_\text{f}$$$ in each voxel. While the free water diffusion is treated as a ball of fixed diffusivity $$$D_\text{FW}=3\;\mu\mathrm{m^2/ms}$$$, each fascicle $$$j$$$ is characterized by a 6D non-central matrix-variate Gamma distribution22-27 $$$\mathcal{P}_{\Gamma,j}(\mathbf{D})$$$.
Let us omit the compartment index $$$j$$$ for clarity. In the axisymmetric diffusion case, the average compartmental diffusion tensor $$$\mathbf{D}^0$$$ ($$$\mathcal{P}_\Gamma$$$'s expectation) only has two distinct eigenvalues: $$$\lambda^\perp\leq\lambda^\parallel$$$. Considering $$$\mathcal{P}_\Gamma$$$'s shape parameters $$$\kappa^\parallel$$$ and $$$\kappa^\perp$$$ that enable the description of an asymmetric DTD in $$$\mathrm{Sym}^+(3)$$$ and defining $$$\beta$$$ as the Euler angle separating the main axes of $$$\mathbf{B}$$$ and $$$\mathbf{D}^0$$$, Magic DIAMOND yields22 the following signals$$\frac{\mathcal{S}_\text{lin.}}{\mathcal{S}_0}=\left[1+b\left(\frac{\lambda^\parallel}{\kappa^\parallel}\cos^2\beta+\frac{\lambda^\perp}{\kappa^\perp}\sin^2\beta\right)\right]^{-\kappa^\perp}\mathrm{exp}\!\left[\frac{-b\,(\kappa^\parallel-\kappa^\perp)\,\lambda^\parallel\cos^2\beta}{\kappa^\parallel+b\left(\lambda^\parallel\cos^2\beta+\frac{\kappa^\parallel}{\kappa^\perp}\,\lambda^\perp\sin^2\beta \right)}\right]\,,$$
$$\frac{\mathcal{S}_\text{plan.}}{\mathcal{S}_0}=\left(1+\frac{b}{2}\,\frac{\lambda^\perp}{\kappa^\perp}\right)^{-\kappa^\perp}\left[1+\frac{b}{2}\left(\frac{\lambda^\parallel}{\kappa^\parallel}\sin^2\beta+\frac{\lambda^\perp}{\kappa^\perp}\cos^2\beta \right)\right]^{-\kappa^\perp}\mathrm{exp}\!\left[\frac{-b\,(\kappa^\parallel-\kappa^\perp)\,\lambda^\parallel\sin^2\beta}{2\kappa^\parallel+b\left(\lambda^\parallel\sin^2\beta+\frac{\kappa^\parallel}{\kappa^\perp}\,\lambda^\perp\cos^2\beta\right)}\right]\,,$$and$$\frac{\mathcal{S}_\text{sph.}}{\mathcal{S}_0}=\left[\left(1+\frac{b}{3}\,\frac{\lambda^\perp}{\kappa^\perp}\right)^2\left(1+\frac{b}{3}\,\frac{\lambda^\parallel}{\kappa^\parallel}\right)\right]^{-\kappa^\perp}\mathrm{exp}\!\left[\frac{-b\,(\kappa^\parallel-\kappa^\perp)\,\lambda^\parallel}{3\kappa^\parallel+b\,\lambda^\parallel}\right]$$for linear, planar and spherical encodings, respectively.
Acquisitions and methods
MRI acquisitions were performed on a clinical 3T system with 45mT/m maximum gradient amplitude (Ingenia, Philips Healthcare, Best, the Netherlands) using a 32-channel head coil. Imaging was performed on one healthy male volunteer using a prototype diffusion-weighted spin-echo EPI sequence with numerically optimized28 spherical, planar and linear encoding waveforms of similar frequency contents29. Acquisition parameters were: TR=6500ms, TE=121ms, spatial resolution=2.5x2.5x2.5mm3, 48 slices, SENSE factor=1.9, Multiband-SENSE factor=2, multi-shell scheme30 of 45 directions with 1xb=0, 6xb=100, 6xb=700, 12xb=1400 and 20xb=2000 (s/mm2). The acquired images were eddy-corrected and resampled to 2x2x2mm3 using linear interpolation.
We considered three encoding combinations: 45 linear + 45 linear gradients (LL), 45 linear + 45 planar gradients (LP) and 45 linear + 45 spherical gradients (LS). We acquired twice each of these combinations and evaluated them using stratified bootstrap. Stratified bootstrap creates a large number of "virtual" acquisitions by randomly choosing for each diffusion gradient one of the two repetitions, allowing simulation of a large number of noise realizations. Statistics were then computed within a white-matter mask to assess the precision of estimated parameters throughout these realizations.
Results and discussion
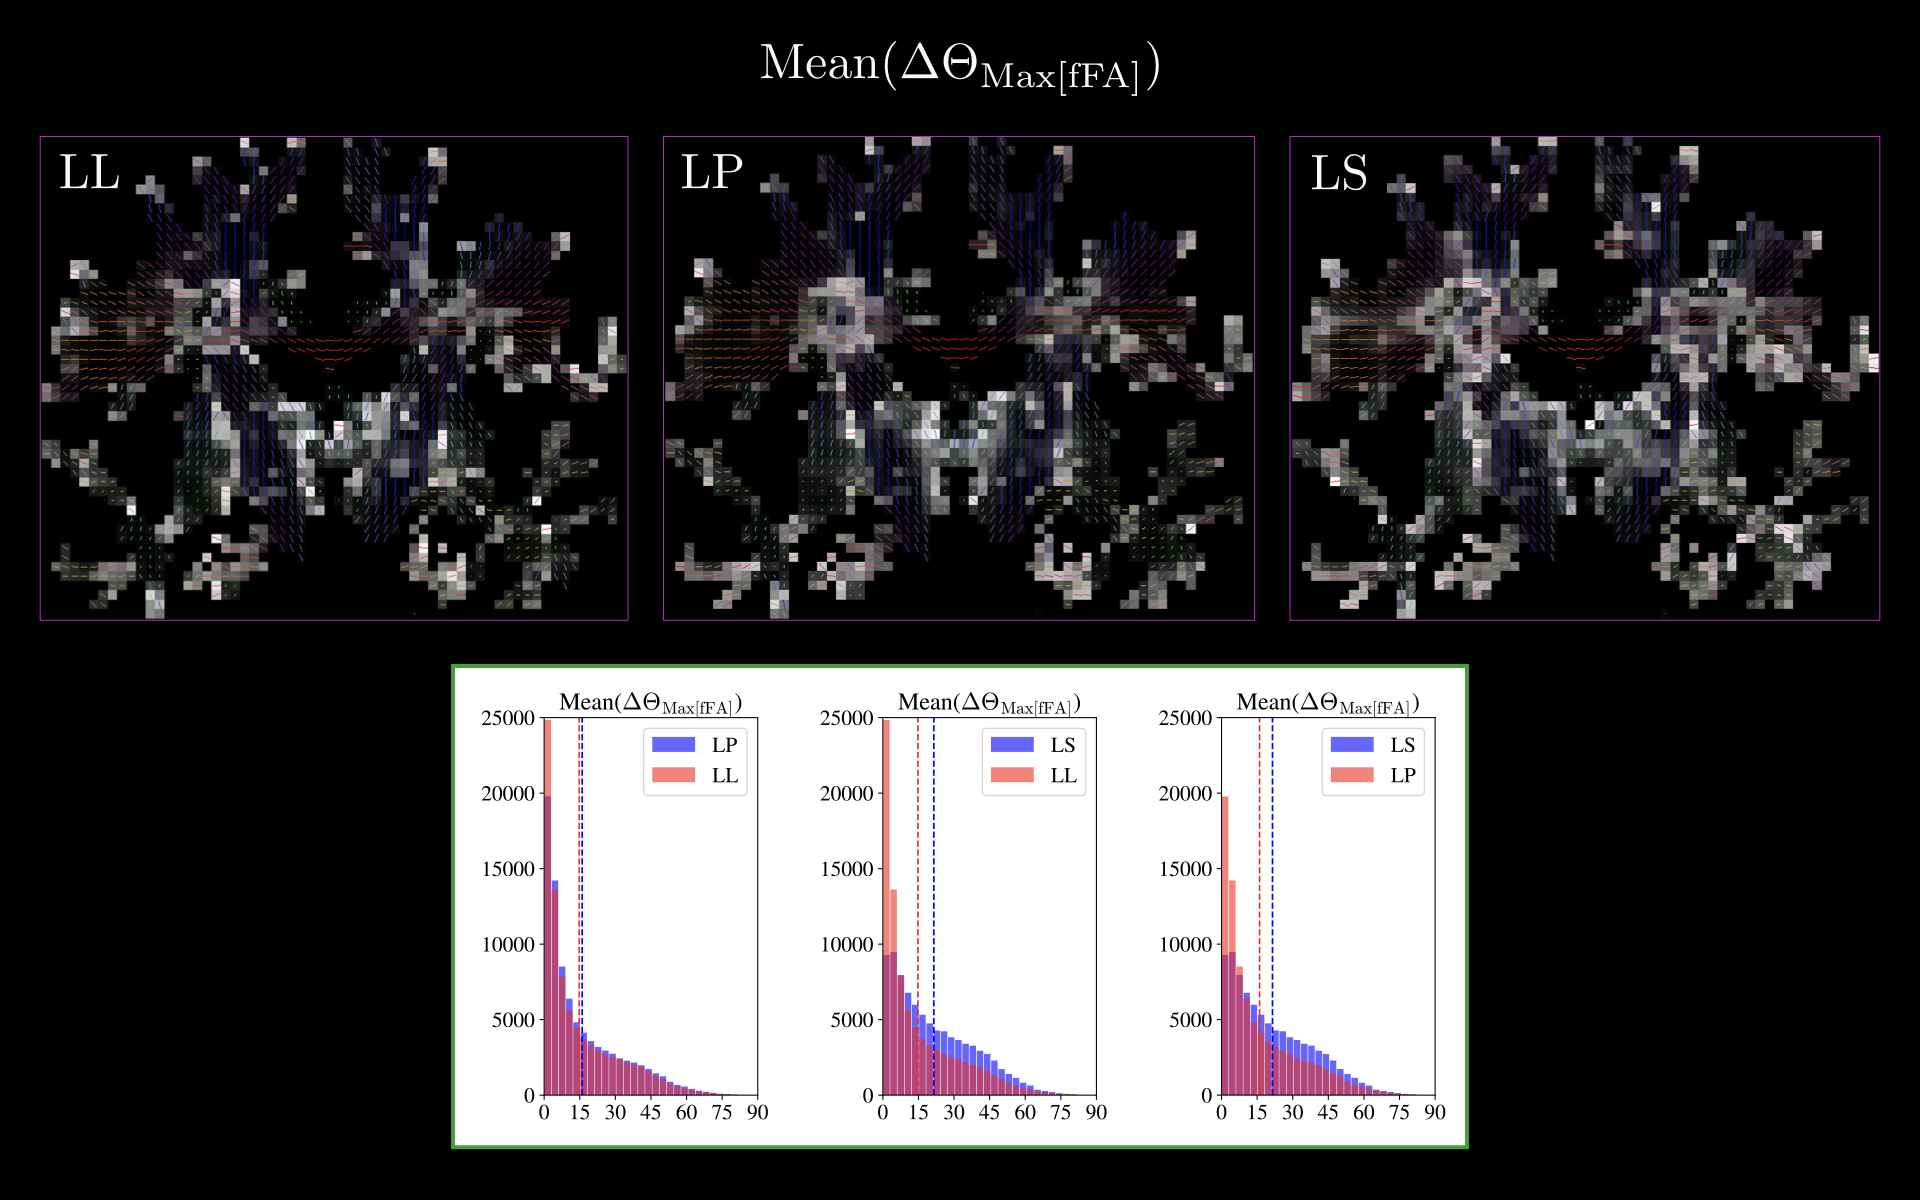
Figures 1, 2 and 3 present the mean value and interquartile range (IQR) of the FW signal fraction ($$$f$$$FW), maximal fascicle axial diffusivity (Max[fAD]) and maximal fascicle radial diffusivity (Max[fRD]) over the stratified bootstrap runs. Even though LP and LS both reduce $$$f$$$FW and increase Max[fAD] and Max[fRD] in the white matter, LP does so with comparable IQR to LL and LS does so with increased IQR. The same observation holds in figure 4 showing the angular precision of the orientation of fascicles with maximal fractional anisotropy (Max[fFA]) over the stratified bootstrap runs. This is likely explained by the inherently low signal-to-noise ratio (SNR) of spherical encoding and by its lack of constraints linking a fascicle's orientation to its diffusional features.Conclusion
While LP does not seem to affect parameter estimation compared to LL, LS worsens it by increasing its variance. Regarding any hope of improvement for LP over LL, the key might lie in higher SNR, higher b-values or better directional coverage during data acquisition, or in phase correction during data preprocessing. These ideas will be further studied in future in silico and in vivo experiments.Acknowledgements
M. Descoteaux was supported by his NSERC Discovery grant and the NeuroInformatics USherbrooke Institutional Research Chair.
B. Scherrer was supported in part by the National Institutes of Health (NIH) grants R01 NS079788, U01 NS082320 and by Boston Children's Hospital Innovator Award.
We warmly thank Filip Szczepankiewicz and Markus Nilsson for their invaluable help in implementing the q-space trajectories on our clinical scanner.
References
1. E. O. Stejskal and J. E. Tanner, Spin Diffusion Measurements: Spin Echoes in the Presence of a Time-Dependent Field Gradient, The Journal of Chemical Physics 42, 288 (1965).
2. D. G. Cory et al., Applications of spin transport as a probe of local geometry, Polym Prepr, 31, 149 (1990).
3. E. C. Wong et al., Optimized isotropic diffusion weighting, Magnetic Resonance in Medicine 34, 139 (1995).
4. E. Özarslan et al., A general framework to quantify the effect of restricted diffusion on the NMR signal with applications to double pulsed field gradient NMR experiments, The Journal of Chemical Physics 130, 104702 (2009).
5. N. Shemesh et al., From single-pulsed field gradient to double-pulsed field gradient MR: gleaning new microstructural information and developing new forms of contrast in MRI, NMR Biomed, 23: 757–780 (2010).
6. M. Lawrenz et al., A tensor model and measures of microscopic anisotropy for double-wave-vector diffusion-weighting experiments with long mixing times, Journal of Magnetic Resonance 202 43–56 (2010).
7. S. N. Jespersen et al., Orientationally invariant metrics of apparent compartment eccentricity from double pulsed field gradient diffusion experiments, NMR Biomed, 26: 1647–1662 (2013).
8. A. Ianus et al., Model-based estimation of microscopic anisotropy using diffusion MRI: a simulation study, NMR Biomed, 29: 672–685 (2016).
9. A. Ianus et al., Accurate estimation of microscopic diffusion anisotropy and its time dependence in the mouse brain, NeuroImage 183 934–949 (2018).
10. M Lawrenz and J. Finsterbusch, Detection of microscopic diffusion anisotropy in human cortical gray matter in vivo with double diffusion encoding, Magn Reson Med. 1, 11 (2018).
11. S. Eriksson et al., Isotropic diffusion weighting in PGSE NMR by magic-angle spinning of the q-vector, Journal of Magnetic Resonance 226, 13 (2013).
12. S. Lasič et al., Microanisotropy imaging: quantification of microscopic diffusion anisotropy and orientational order parameter by diffusion MRI with magic-angle spinning of the q-vector, Frontiers in Physics 2, 11 (2014).
13. S. Eriksson et al., NMR diffusion-encoding with axial symmetry and variable anisotropy: Distinguishing between prolate and oblate microscopic diffusion tensors with unknown orientation distribution, The Journal of Chemical Physics 142, 104201 (2015).
14. C. F. Westin et al., Q-space trajectory imaging for multidimensional diffusion MRI of the human brain, NeuroImage 135, 345 (2016).
15. D. Topgaard, Multidimensional diffusion MRI, Journal of Magnetic Resonance 275, 98 (2017).
16. D. S. Novikov et al., Quantifying brain microstructure with diffusion MRI: Theory and parameter estimation. NMR in Biomedicine, e3998 (2018).
17. H. Zhang et al., NODDI: Practical in vivo neurite orientation dispersion and density imaging of the human brain, NeuroImage 61, 1000 (2012).
18. B. Lampinen et al., Neurite density imaging versus imaging of microscopic anisotropy in diffusion MRI: A model comparison using spherical tensor encoding, NeuroImage 147, 517 (2017).
19. E. Fieremans et al., Effect of combining linear with spherical tensor encoding on estimating brain microstructural parameters, In: Proc. ISMRM, Paris, (2018).
20. M. Reisert et al., A Unique Analytical Solution of the White Matter Standard Model using Linear and Planar Encodings, arXiv:1808.04389, (2018).
21. S. Coelho et al., Double Diffusion Encoding Prevents Degeneracy in Parameter Estimation of Biophysical Models in Diffusion MRI, arXiv:1809.05059 (2018).
22. A. Reymbaut et al., The "Magic DIAMOND" method: probing brain microstructure by combining b-tensor encoding and advanced diffusion compartment imaging, In: Proc. ISMRM, Paris, (2018).
23. B. Scherrer et al., Characterizing brain tissue by assessment of the distribution of anisotropic microstructural environments in diffusion-compartment imaging (DIAMOND), Magnetic Resonance in Medicine 76, 963 (2016).
24. B. Scherrer et al., Decoupling Axial and Radial Tissue Heterogeneity in Diffusion Compartment Imaging, in Information Processing in Medical Imaging (IPMI), pp. 440-452 (2017).
25. R. J. Muirhead, Aspects of Multivariate Statistical Theory, John Wiley and Sons Ltd., Hoboken, New Jersey (1982).
26. A. K. Guptar and D. K. Nagar, Matrix Variate Distributions, Chapman and Hall/CRC, Boca Raton, Florida (2000).
27. T. H. Anderson, An Introduction to Multivariate Statistical Analysis, Third Edition, John Wiley and Sons Ltd., Hoboken, New Jersey (2003).
28. J. Sjölund et al., Constrained optimization of gradient waveforms for generalized diffusion encoding, Journal of Magnetic Resonance 261, 157-168 (2015).
29. H. Lundell et al., Microscopic anisotropy with spectrally modulated q-space trajectory encoding. In: Proc. ISMRM Honolulu, Hawaii, (2017).
30. F. Szczepankiewicz et al., Whole-brain diffusional variance decomposition (DIVIDE) in 8 minutes: Technical feasibility at 1.5, 3, and 7 T. In: Proc. ISMRM 25, 2017 Honolulu, USA. 3503, (2017).
Figures