3561
Permeable Barrier Modeling of Age Induced Changes in the Time Dependent Diffusion Eigenvalues1Physics, UC San Diego, San Diego, CA, United States, 2Radiology, UC San Diego, San Diego, CA, United States, 3Physics, San Diego State University, San Diego, CA, United States
Synopsis
The time dependence of the diffusion eigenvalues derived from diffusion tensor imaging allows one to probe tissue microstructure. A diffusion model is required to derive inferences about the microstructure from the time dependent eigenvalue data. We applied the Random Permeable Barrier Model1 to the time dependent diffusion data to infer age related changes in skeletal muscle microarchitecture. The tertiary eigenvalue at the largest diffusion time was significantly different between young and senior cohorts. Model derived myofiber size decreased and free diffusion coefficient increased with age, though neither parameter reached significance.
INTRODUCTION
Skeletal muscle time dependent diffusion tensor imaging allows the computation of indices that reflect underlying muscle tissue microarchitecture. Muscle mass loss has been reported in the aging muscle and this is in part, responsible for functional loss. However, non-invasive monitoring of microstructural changes such as muscle fiber diameter with age has not been reported. We measure the time dependence of skeletal muscle diffusion eigenvalues (λ1, λ2, λ3) using a STEAM-EPI DTI sequence to extract tissue microstructure in young and senior subjects using the Random Permeable Barrier Model.METHODS
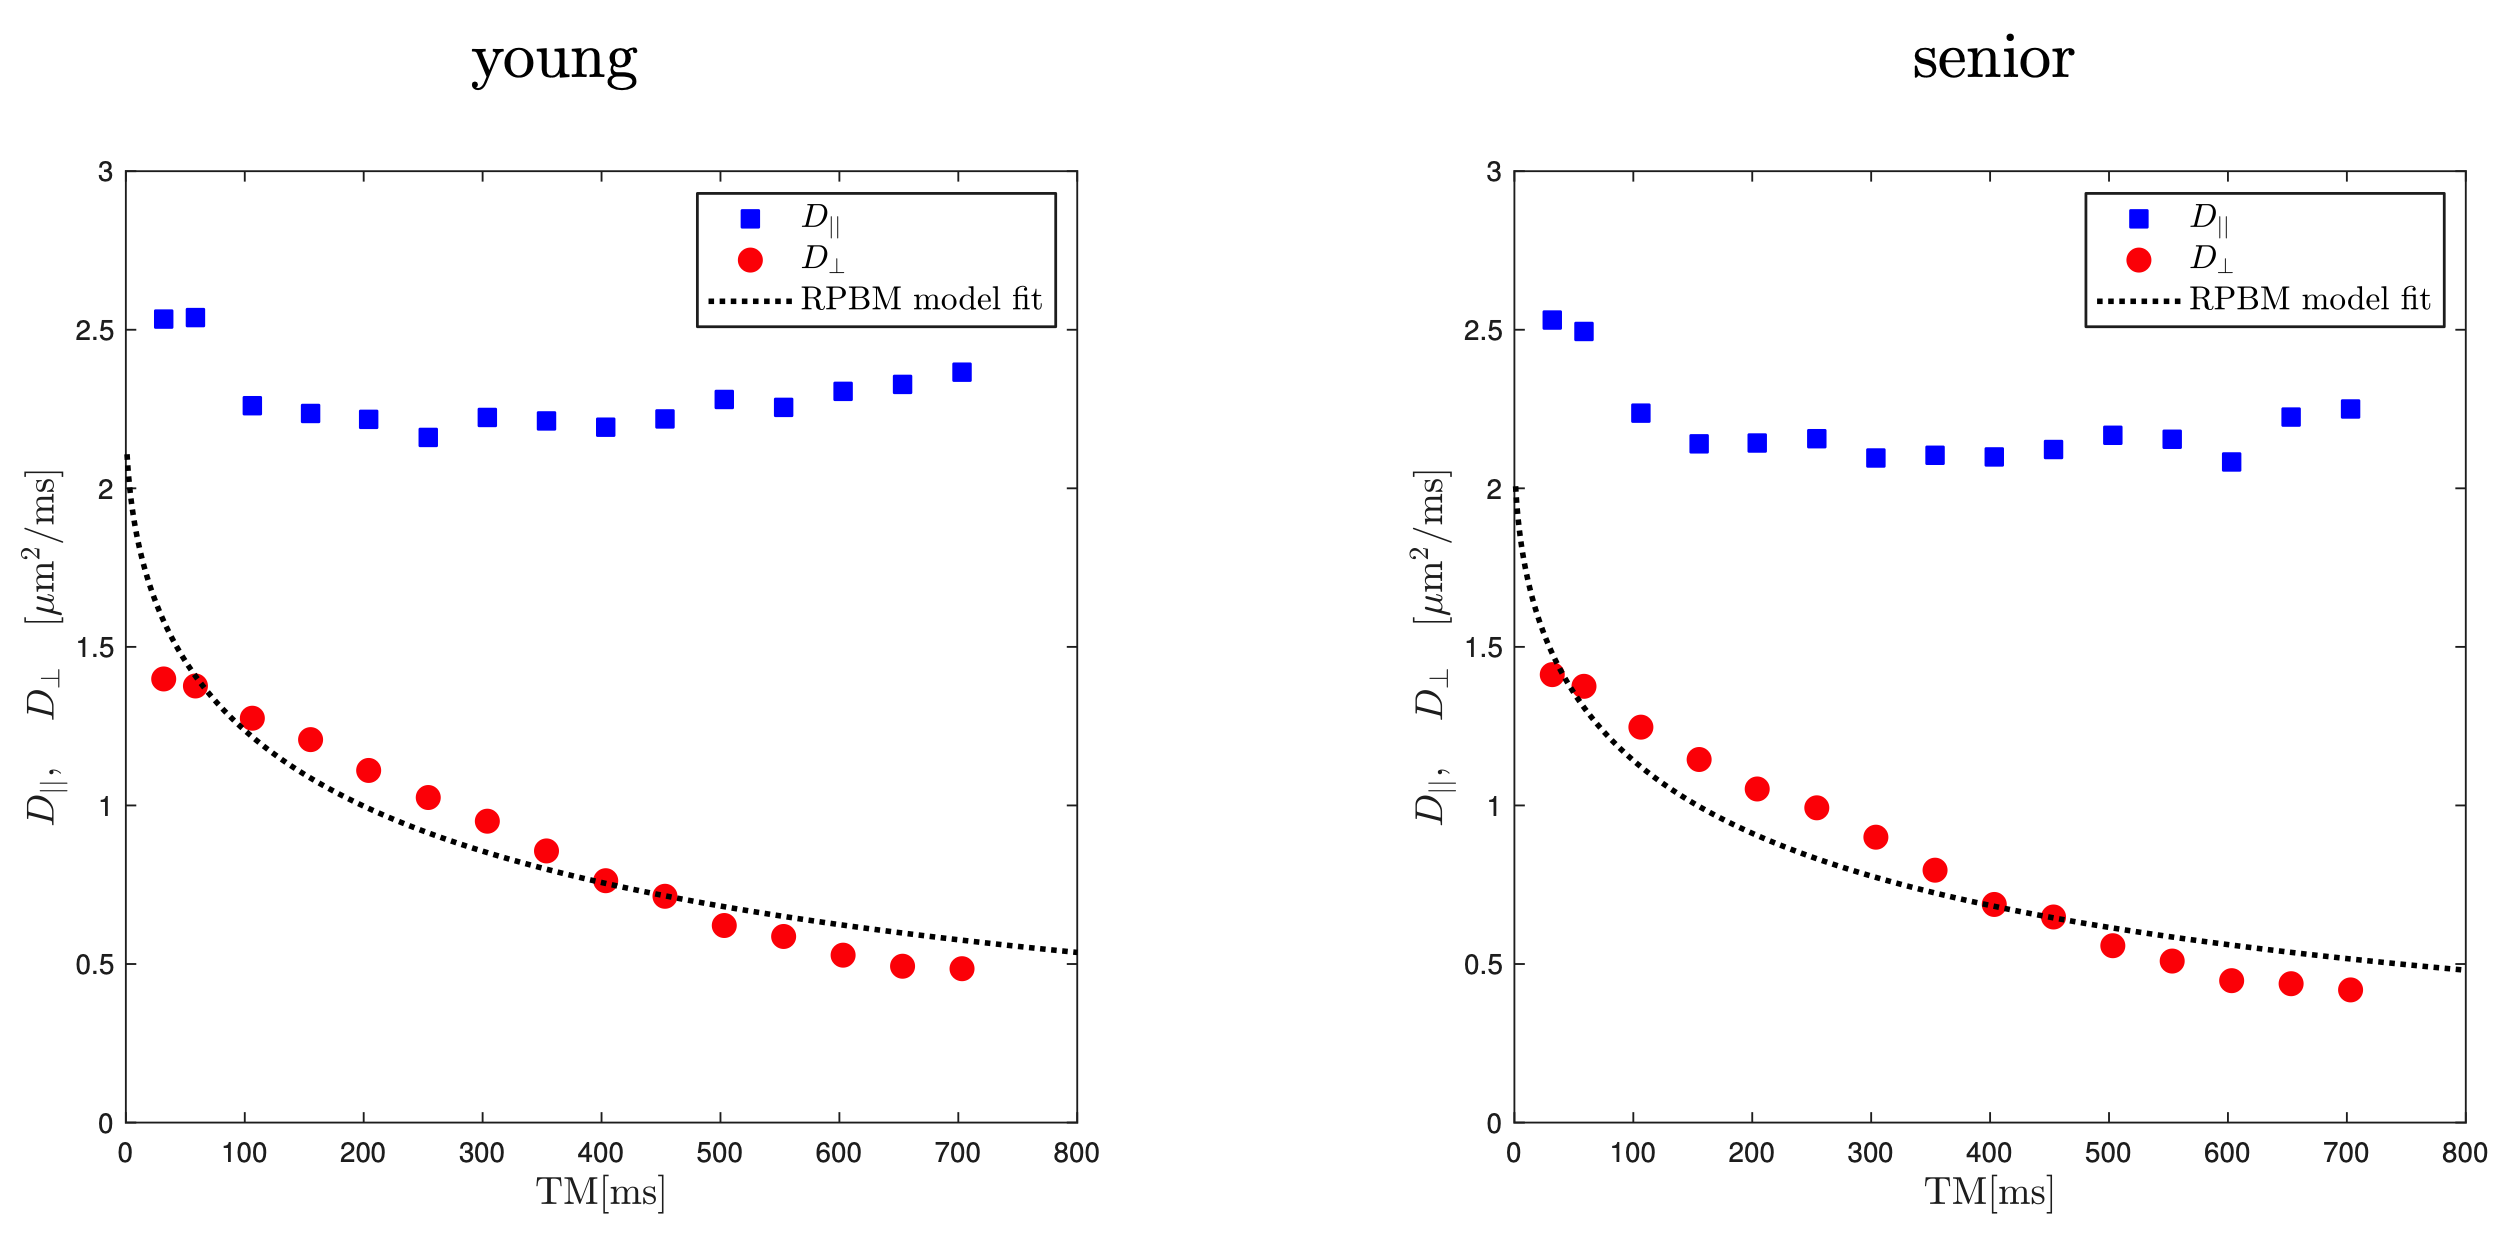
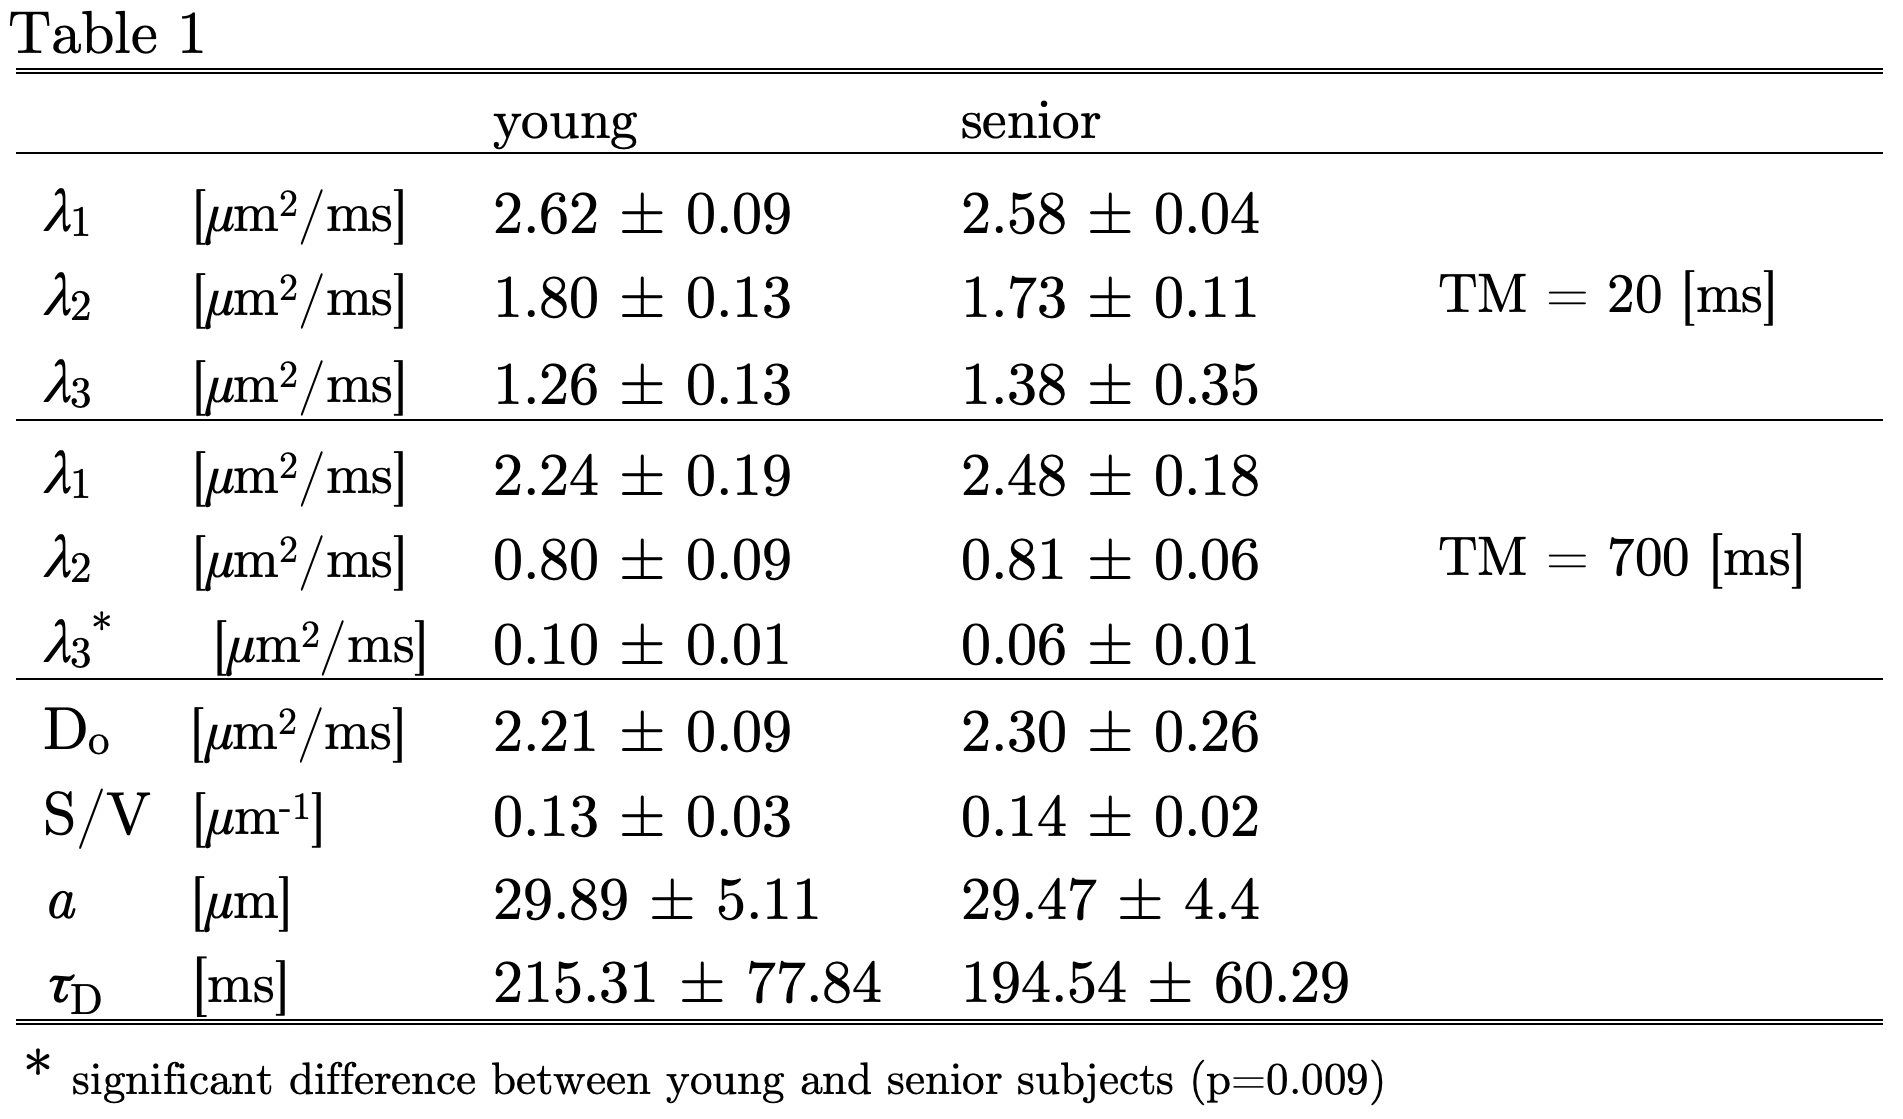
All imaging studies were performed after IRB approval on a GE 1.5 Tesla scanner on five young (27 ± 3 years) and five senior (70 ± 4 years) subjects. The DTI protocol used a custom-built STEAM-EPI DTI sequence. Fat suppression was accomplished with a water selective RF pulse and a SPAIR pulse. Six non-collinear gradient directions with a nominal b-factor of 400 s/mm2 were used to map the direction dependent diffusion at fifteen values of the mixing time, TM (20 ms to 700 ms). Imaging parameters were echo time (TE)/repetition time (TR): 32 ms/4000 ms with 8 signal averages. Diffusion data were pre-processed for eddy current and for susceptibility induced artifacts, and denoised prior to computing the diffusion tensor and the diffusion eigenvalues. The corrected full b matrix that accounted for the diffusion and imaging gradients was calculated as outlined in (Ref. 2). For the nominal b=0 images, the b-value varied from 2.6 s/mm2 at TM= 20 ms to 71 s/mm2at TM= 700 ms and for the nominal b=400 s/mm2 images, the b-value varied from 351 s/mm2 at TM=20 ms to 505 s/mm2 at TM= 700ms. The RPBM model is characterized by three parameters: the free diffusion coefficient, Do, the membrane permeability, k, and the membrane surface to volume ratio, S/V. The myofiber size is derived from the surface to volume ratio as: 4·V/S. The RPBM fits were made to the time dependence of the average of λ2, and λ3 (D⊥); the values of D⊥ were the average over the MG segmented from all three slices.RESULTS
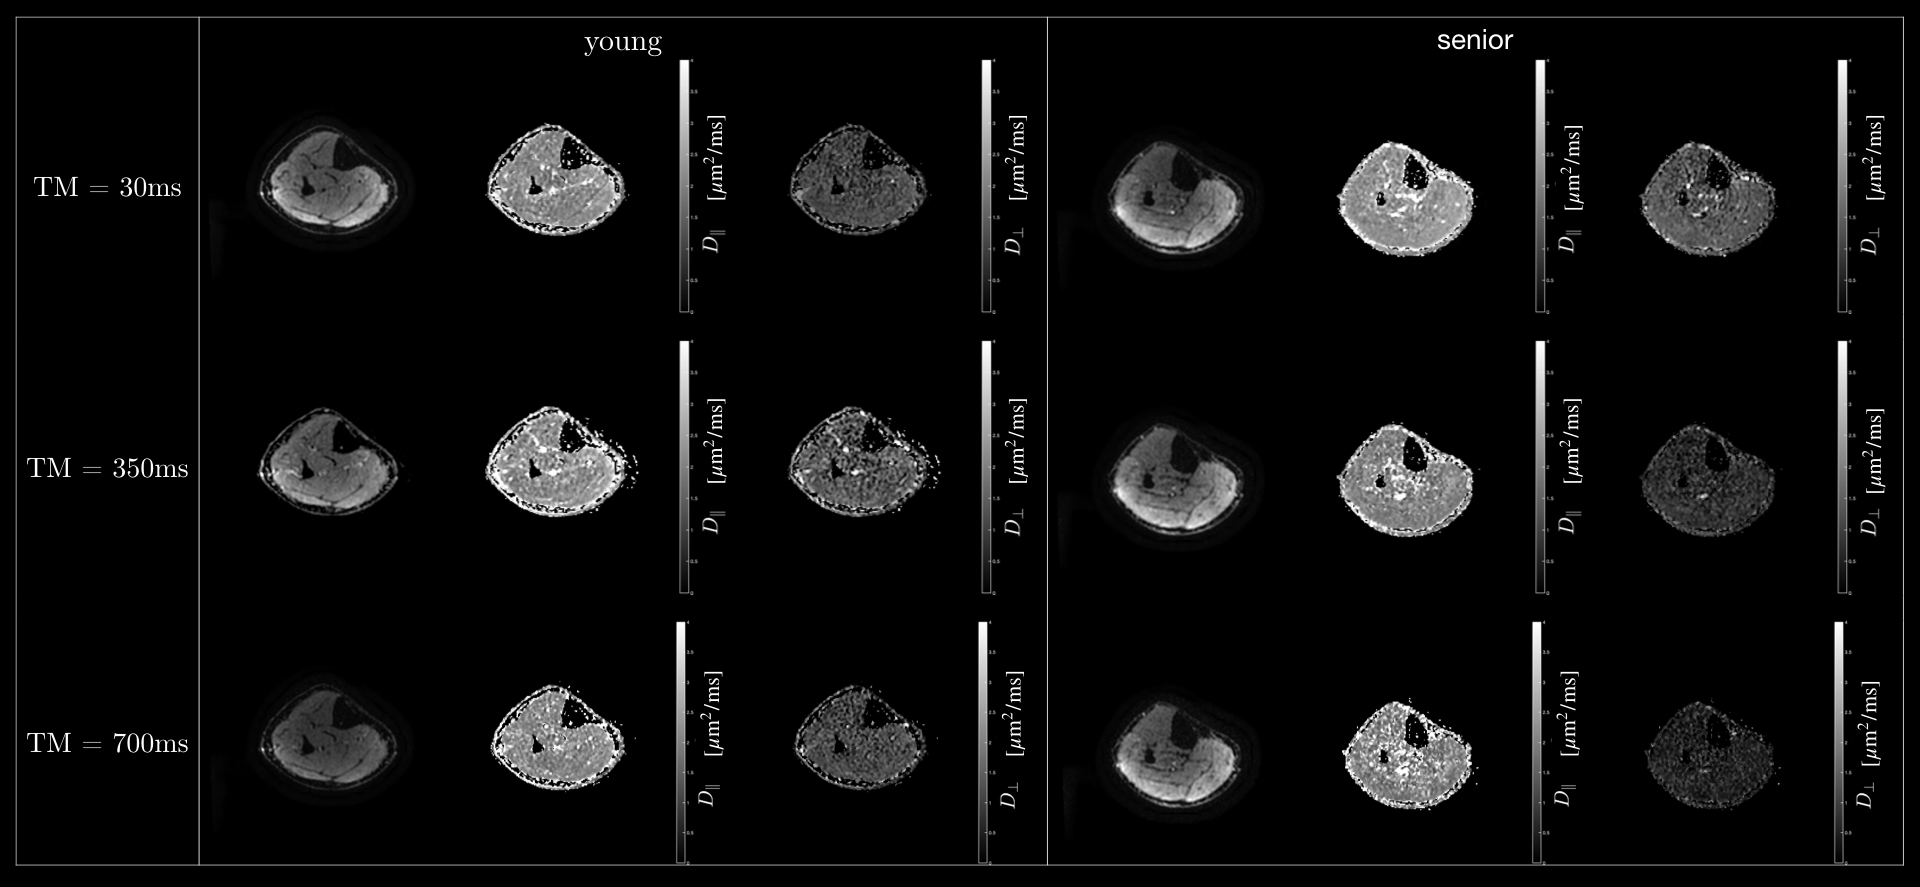
Figure 1 shows images at the nominal b=0 at three TMs and the corresponding D|| and D⊥maps for a young and for a senior subject. Table 1 summarizes the eigenvalues for the medial gastrocnemius in the young and old cohort at the lowest and longest mixing times, TM. Significant differences were seen in the third eigenvalue at the longest mixing times only. The RPBM fits for a subject from the young cohort and from a senior cohort are shown for the time dependence of D⊥(Figure 2). The membrane surface to volume ratio S/V, myofiber size, a, the free diffusion coefficient, Do and the residence time, τD were obtained from the fits of the DTI data to the RPBM model (Table 1).DISCUSSION
DTI indices extracted from longer mixing time DTI sequences are more sensitive to aging than those extracted at low TM values. This is a reflection of the fact that, at long diffusion times, the perpendicular eigenvalues are more restricted by the muscle fiber. These results show that D⊥ at long diffusion times can be clinically useful in monitoring age related changes in skeletal muscle. The values of the muscle fiber size, Do and τD are in general agreement with that reported for the MG in an earlier study1. This is the first report on modeling with DTI data acquired at 1.5T and despite the lower SNR at 1.5T, it is important to note that the model derived parameters at 1.5T are in agreement with those from 3T DTI data1. The RPBM model yields a lower myofiber size in the older cohort, though this did not reach significance (Table 1). A decrease in myofiber size is anticipated as decrease in muscle fiber size is a known age-related muscle remodeling effect. However, even though structural MRI can monitor reductions in muscle cross sectional areas (CSAs) with age, this is the first study to extract muscle fiber size and to show that it decreases with age. The RPBM model also yielded an increase in free diffusion coefficient with age. This may potentially arise from an increase in extracellular matrix (ECM) with age; age related increase in endomysial width has been shown from histological evaluation of muscle biopsy samples3.CONCLUSIONS
We have demonstrated the potential of modeling to extract muscle tissue parameters from time dependent D⊥ derived from DTI data acquired at 1.5 T and applied it to study age related skeletal muscle remodeling.Acknowledgements
This work was supported by the National Institute of Arthritis and Musculoskeletal and Skin Diseases Grant R01AG056999-01References
[1] Fieremans E, et al. NMR Biomed. 2017;30(3):Epub.
[2] Mattiello J, et al. MRM 1997; 37:292-300.
[3]Alnaqeeb MA, et al. J. Anat. 1984; 139: 677-689.
Figures