3558
Precision of microscopic fractional anisotropy estimation using double diffusion encoding1UCL Great Ormond Street Institute of Child Health, University College London, London, United Kingdom, 2Champalimaud Neuroscience Programme, Lisbon, Portugal
Synopsis
Microscopic fractional anisotropy (μFA) estimation using diffusion MRI is a promising new method for quantifying microstructure, diagnosing pathologies, and measuring brain development. In order for μFA to be a useful metric in clinical and neuroscientific research, its robustness to noise has to be properly understood. In this study, precision of μFA estimation was quantified for different noise levels using propagation of error calculations, simulations, and imaging experiments. We show that μFA is non-linearly sensitive to noise, being the most instable at low values of mean diffusivity (MD) and μFA, and that increasing accuracy by correcting for higher order effects results in decreased precision.
Introduction
The difference in signal decay between single-dimensional diffusion encoding (SDE) and multi-dimensional diffusion encoding (MDE) experiments depends on the anisotropy of microscopic compartments 1. By measuring this difference, it is possible to disentangle microscopic compartments’ anisotropy and orientation coherence, which can aid diagnosis of pathologies and measurements of changes in microstructure 2,3. Accuracy issues originating from higher order effects have been recently pointed out 4, but to our knowledge, the error propagation governing the precision of µFA has not yet been thoroughly studied. Here, we quantify the precision of μFA estimate using analytical calculations, simulations, and experiments. Although we focus on double diffusion encoding (DDE), most results apply for q-space trajectory encoding (QTE) as well.
Theory
In the long mixing time regime, signal deviation between powder averaged data acquired with parallel and orthogonal gradient pulse pairs depends on microscopic anisotropy μA, which is a measure of compartment anisotropy and size 5.
$$\varepsilon=\mu A^2=\text{ln}\left(\frac{S_{||}}{S_{\perp}}\right )b ^{-2}\,\,\,\,\,\,\,\,\,\,\,(1)$$
μFA is a normalized measure of microscopic anisotropy, that only depends on compartment anisotropy 5.
$$\mu FA=\sqrt{\frac{3}{2}} \sqrt{\frac{\varepsilon}{\varepsilon+\frac{3}{5}\text{MD}^2}}\,\,\,\,\,\,\,\,\,\,\,(2)$$
If data is acquired with multiple b-values, a more accurate estimate of μFA can be calculated by including a third order polynomial in the fit to correct for higher order terms 4.
$$\text{ln}\left(\frac{S_{||}^{PA}}{S_{\perp}^{PA}}\right )=\mu A^2b^{2}+P_3 b^3\,\,\,\,\,\,\,\,\,\,\,(3)$$
In
this study, data is powder averaged according to the 5-design, which is a rotationally invariant directional scheme for measuring ε, that holds up to the fifth order of the signal cumulant expansion 5. We compare the third order fit (equation 3) to the second order fit, which only includes the first term in equation 3.
Methods
Error propagation calculations: The error in μFA and ε was approximated using:
$$\sigma^2_{f(\textbf{x})}=\sum^N_{i=1}\sigma_i^2\left(\frac{\partial f}{\partial x_i}\right )^2\,\,\,\,\,\,\,\,\,\,\,(4)$$
Simulations:
Diffusion
in individual compartments was modelled with
diffusion tensors. Measurements
were calculated for eight
b-values evenly distributed between 500
and 4000
s/mm2.
The noise
properties were studied by adding
Rician
noise to
data. μFA is calculated with equations (2) and (3), and the values of μFA are constrained to be in the interval [0,1].
MRI experiments: All experiments were approved by the local competent authority. A rat brain (N=1) was extracted through standard transcardial perfusion and scanned in a 9.4 T Bruker Biospec scanner harnessing an 86 mm volume coil for transmission and 4-element array cryocoil for reception. We used an in-house DDE-EPI sequence with four b-values evenly distributed between 1000 and 4000 s/mm2. Diffusion-weighting directions were given by the 5-design 4. TE = 69 ms, TR = 1 s, δ = 5 ms, ∆ = 15 ms, tm = 15 ms, voxel size = 0.2 x 0.2 x 0.8 mm, and FOV = 20 x 20 mm. Data was denoised using a Marchenko-Pastur-PCA denoising procedure 6. Gibbs ringing artefacts were reduced using a sub-voxel shift algorithm 7. Mean diffusivity was estimated by fitting a diffusion tensor to the parallel data at b = 1000 s/mm2. Every acquisition was averaged 60 times to maximize SNR. SNR was quantified as the average of per-voxel standard deviations divided by the corresponding mean signals over 52 pre-processed b0-images.
Results and discussion
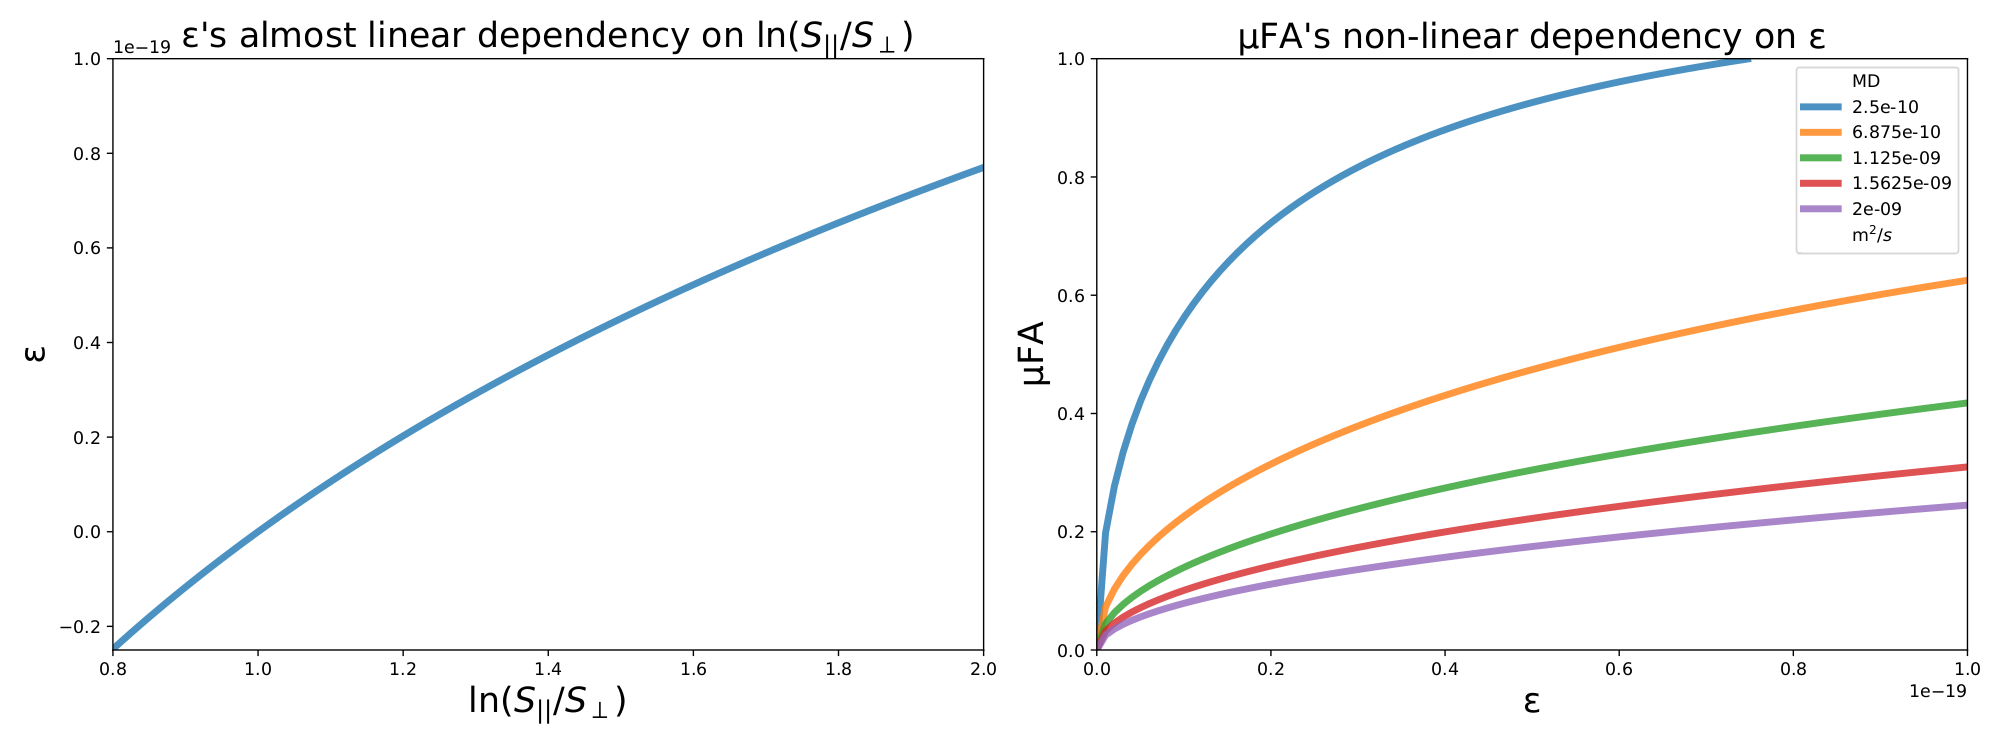
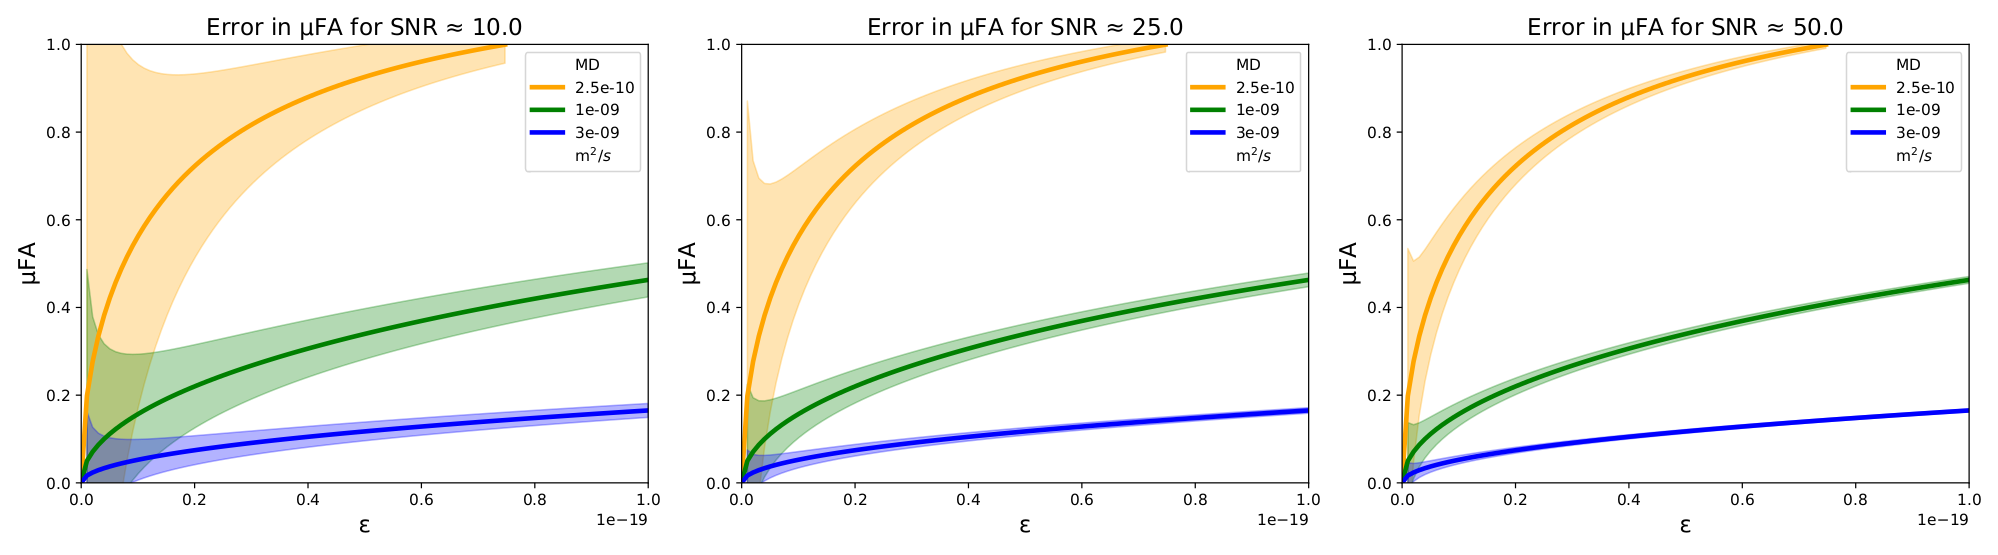
Both simulations and imaging experiments show that μFA’s robustness to noise is highly sensitive to the sizes and shapes of compartments (Figures 3, 4), which is due to μFA’s non-linear dependency on ε (Figure 1). ε is much less sensitive to noise than μFA, and may be the preferred metric in some situations. The error in ε and μFA due to noise can be approximated as
$$\sigma_{\varepsilon}\approx\sqrt{\frac{\sigma^2}{12 S^2_{||}}+\frac{\sigma^2}{60S^2_{\perp}}}b^{-2},\,\,\,\,\,\,\,\,\,\,\,(5)$$
$$ \sigma_{\mu FA}\approx\sigma_{\varepsilon}\sqrt{\frac{27}{200}}\frac{\text{MD}^2}{\varepsilon^{\frac{1}{2}}(\varepsilon+\frac{3}{5}\text{MD}^2)^{\frac{3}{2}}},\,\,\,\,\,\,\,\,\,\,\,(6)$$
where σ is the error in an individual acquisition. Figure 2 illustrates the magnitude of σμFA.
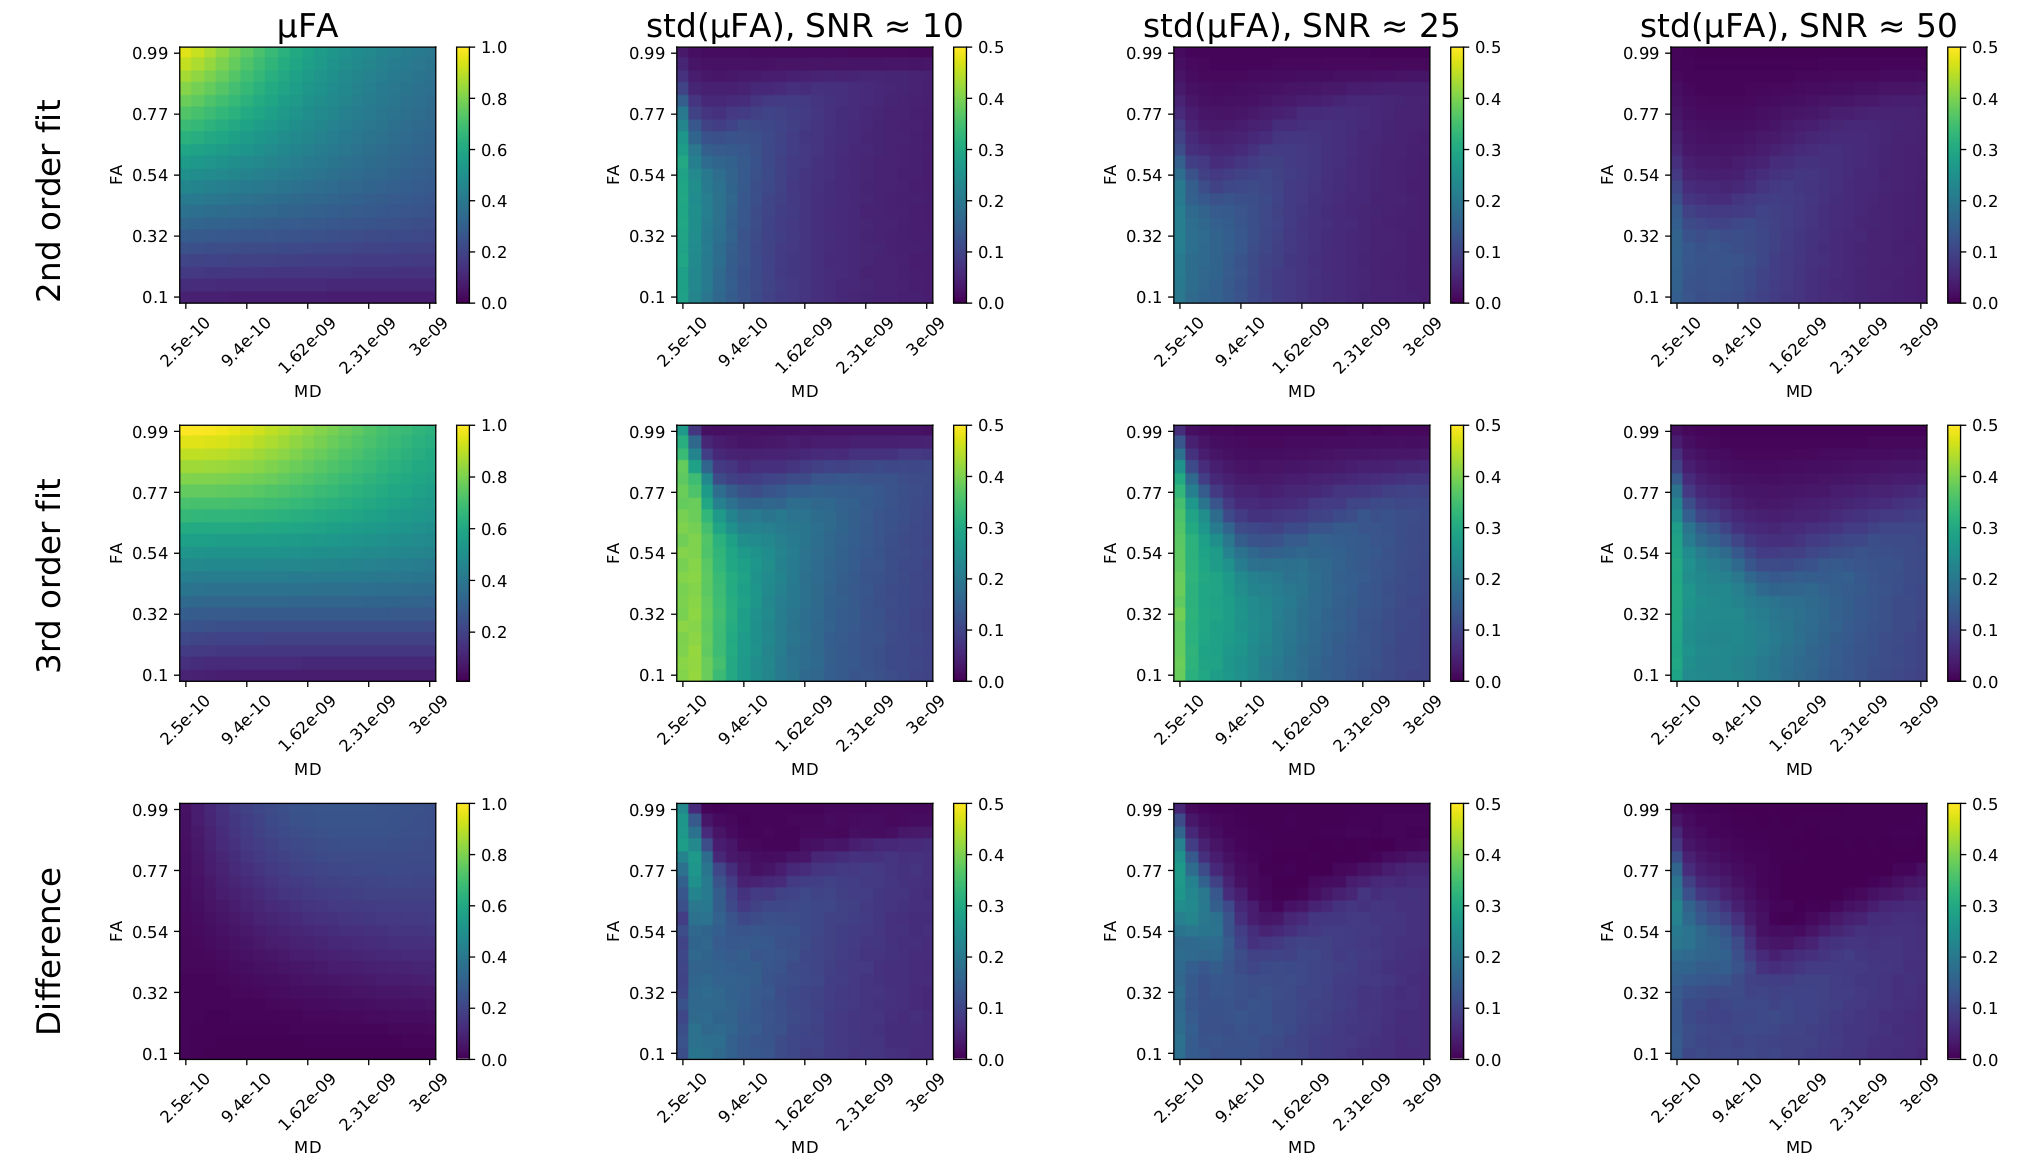
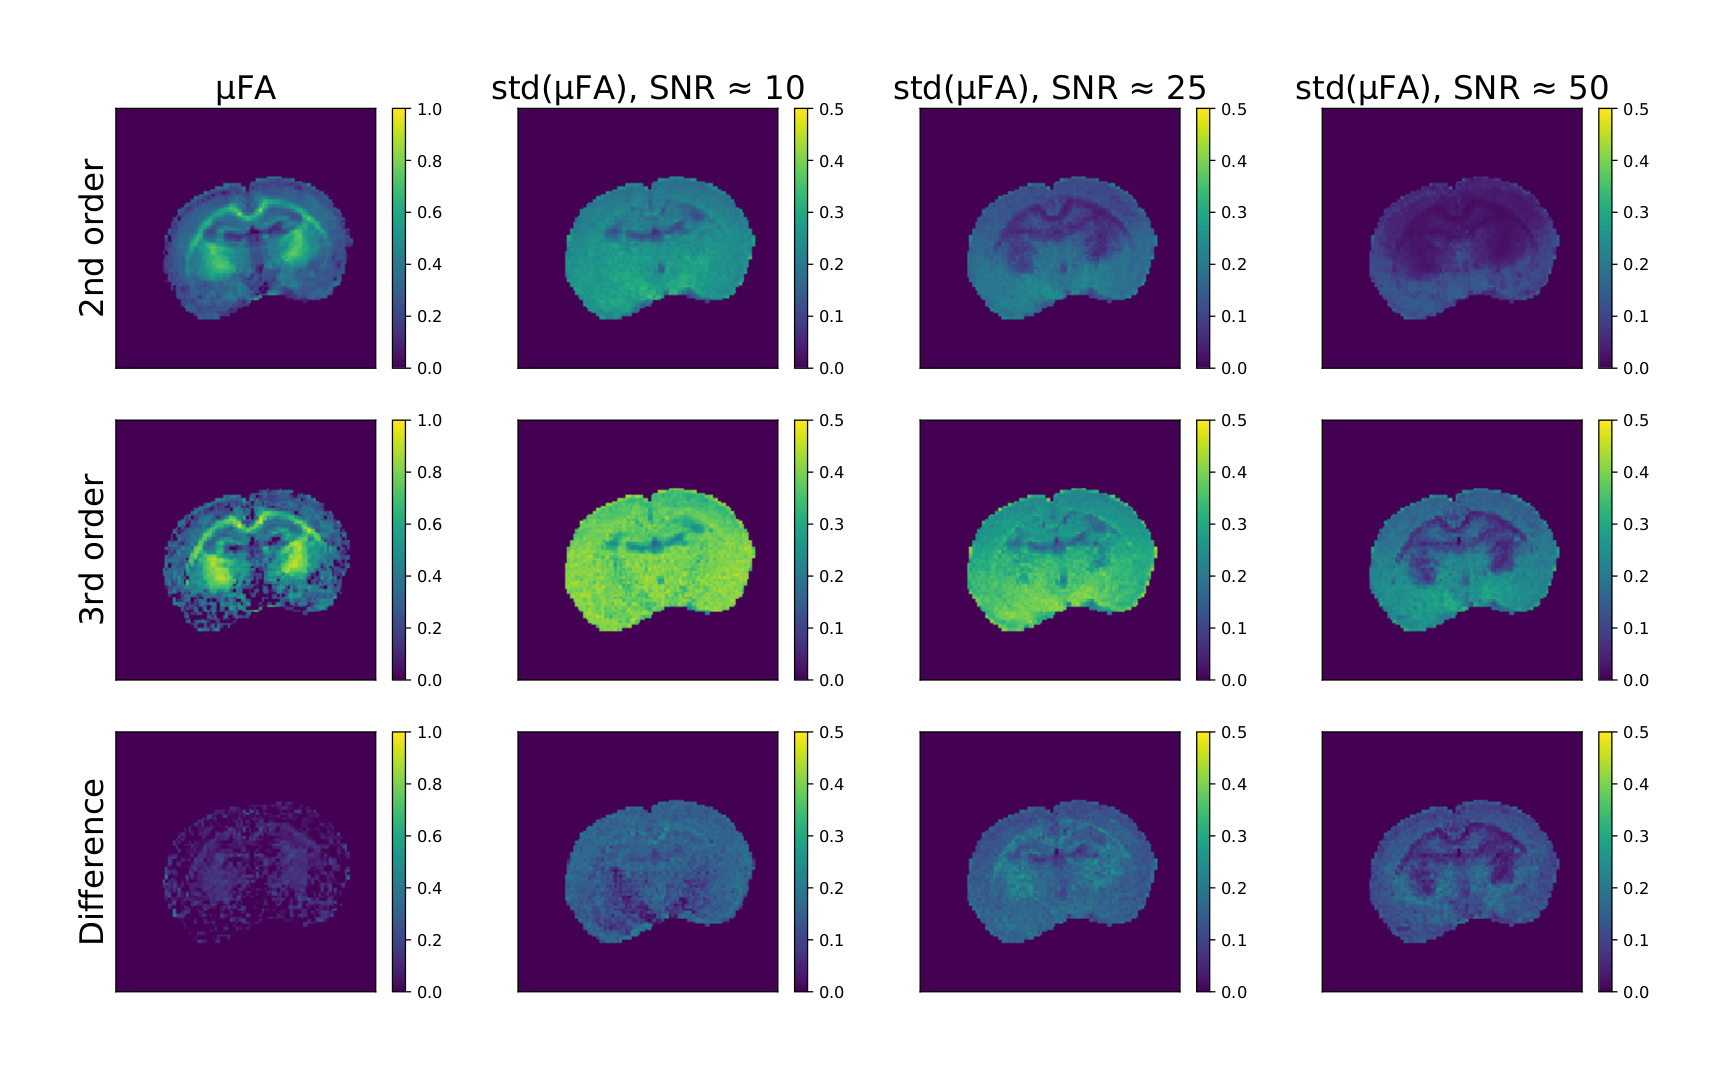
The precision of the second order and third order fits were compared in simulations (Figure 3) and imaging experiments (Figure 4). The third order fit is more unstable than the second order fit, and the instability quickly increases as MD and μFA decrease. Even in the case of no added noise, the third order fit results in multiple negative values of μA2 which leads to false zero values in the μFA map (Figure 4).
Conclusion
Our
study shows that in tissues
composing of highly
anisotropic compartments
such as white matter, μFA
is a
precise metric of a well-defined microstructural property. However, in order to use μFA for exploring microstructural changes in voxels with low μFA and/or MD, noise-sensitivity should be taken into account. Second order fit maximizes specificity.
Acknowledgements
This study was funded by Child Health Research CIO. We also thank Champalimaud Foundation for seed funding.References
1. Topgaard, Daniel. "Multidimensional diffusion MRI." Journal of Magnetic Resonance 275 (2017): 98-113.
2. Szczepankiewicz, Filip, et al. "The link between diffusion MRI and tumor heterogeneity: Mapping cell eccentricity and density by diffusional variance decomposition (DIVIDE)." NeuroImage 142 (2016): 522-532.
3. Yang, Grant, et al. "Double diffusion encoding MRI for the clinic." Magnetic resonance in medicine 80.2 (2018): 507-520.
4.
Ianuş, Andrada, et al. "Accurate estimation of microscopic
diffusion anisotropy and its time dependence in the mouse brain."
NeuroImage 183 (2018): 934-949.
5. Jespersen, Sune Nørhøj, et al. "Orientationally invariant metrics of apparent compartment eccentricity from double pulsed field gradient diffusion experiments." NMR in Biomedicine 26.12 (2013): 1647-1662. 5.
6. Veraart, Jelle, et al. "Denoising of diffusion MRI using random matrix theory." NeuroImage 142 (2016): 394-406.
7. Kellner, Elias, et al. "Gibbs‐ringing artifact removal based on local subvoxel‐shifts." Magnetic resonance in medicine 76.5 (2016): 1574-1581.
Figures