3557
Experimental validation and SNR analysis of a clinical double diffusion encoding sequence1UCL Great Ormond Street Institute of Child Health, University College London, London, United Kingdom, 2Champalimaud Neuroscience Programme, Lisbon, Portugal
Synopsis
Double diffusion encoding (DDE) allows the estimation of microscopic fractional anisotropy (μFA), which is a promising metric for studying microstructural properties of brain tissue independent of orientation dispersion. However, a large number of acquisitions is needed to obtain a rotationally invariant measurement of μFA, which poses a problem in clinical settings. A DDE protocol with a reduced number of acquisitions has recently been proposed as a solution. In this study, we assessed the accuracy of this approach and its potential for reporting μFA accurately. Our results show that a reduced number of acquisitions is sufficient for characterizing μFA.
Introduction
Microscopic
fractional
anisotropy
(μFA)
can be quantified with double diffusion encoding (DDE) experiments in
the long mixing time regime without modelling restrictions or
assumptions about Gaussian diffusion 1,2.
The DDE 5-design 2
is
a theoretically justified rotationally-invariant powder-averaging scheme
requiring 72 measurements, which may be too time consuming to
be used in the clinic. Recently, Yang et al. proposed that as few as 12
measurements could suffice to quantify μFA if diffusion appears
Gaussian 3.
However, this method has not been compared to the theoretically
robust 5-design. Validating this method is important, because it is
known that new methods may produce consistent yet incorrect
results 4.
Here, we validated the proposed minimal directional scheme by
directly comparing it to the 5-design.
Theory
μFA can be calculated as
$$\mu FA=\sqrt{\frac{3}{2}} \sqrt{\frac{\varepsilon}{\varepsilon+\frac{3}{5}\text{MD}^2}},\,\,\,\,\,\,\,\,\,\,(1)$$
where
$$$\varepsilon=\text{ln}(S^{PA}_{||}/S^{PA}_{\perp})b^{-2}$$$ is
quantified from the powder averaged data acquired with parallel and
orthogonal gradient pulse pairs, and
MD stands for mean diffusivity 2.
The
DDE 5-design holds up to the fifth order of the cumulant expansion and requires 12
parallel and 60 orthogonal gradient pulse pairs for powder-averaging the data (Figure 1A) 2. In case of
Gaussian diffusion, some of the orthogonal gradient pulse pairs measure the same in-plane diffusion tensor trace, and
are thus redundant. We sought to test Yang’s hypothesis that 6
parallel and 6
orthogonal gradient pulse pair directions
can closely approximate $$$\varepsilon$$$ 3 (Figure 1B).
Methods
All experiments were approved by the local competent authority.
Specimen
preparation. A
rat brain (N=1) was extracted through standard transcardial
perfusion.
The
rat brain was inserted into a fluorinert filled tubed and placed in
the scanner at 23 °
C.
Data acquisition.
All experiments were performed on a 9.4 T Bruker BioSpec
scanner harnessing an 86 mm volume coil for transmission and
4-element array cryocoil for reception.
An in-house DDE-EPI pulse sequence was used with
b = 0, 1000, 2000, 3000 s/mm2,
δ = 5 ms, ∆ = tm
= 15 ms, TE =
69 ms, TR = 1 s,
voxel
size = 0.2 x 0.2 x 0.8
mm,
FOV
= 20 mm x 20 mm, partial
Fourier =
1.25, and
double sampling.Three slices were acquired with a slice gap of 0.5 mm.
We
compared the
five-design
(A) and the clinical directional scheme
(B), which are shown in figure 1. To maximize SNR and to match
acquisition number in both, acquisitions in A were averaged 30 times and acquisitions in B were averaged 90 times. We
used 12 symmetric acquisitions in B instead of 6 to eliminate possible artifacts arising from cross-terms between the imaging and diffusion gradients.
Image analysis. Data was denoised using a Marchenko-Pastur-PCA denoising procedure 5, and Gibbs ringing artifacts were reduced using a sub-voxel shift algorithm 6. Voxel-specific SNR was quantified as the standard deviation divided by the mean signal over 39 b0-images. Registration was done with single-step DFT algorithm 7. Mean diffusivity was estimated by fitting a diffusion tensor to the parallel data at b = 1000 s/mm2. $$$\varepsilon$$$ was fit to multi-shell data. μFA was calculated using equation 1. Synthetic Rician noise was added to the data to artificially lower SNR.
Results and discussion
The high quality of pre-processed data is highlighted in figure 2.
When
comparing the two sets of directions using
multi-shell data, we
find similar µFA values for the studied
b-values (Figure 3). Voxel-wise comparison of the two µFA maps reveals excellent agreement between the two methods: Pearson’s correlation coefficient = 0.91, mean difference = 0.015, std = 0.07 (Figure 4). Similar variance (Pearson's correlation coefficient = 0.92, mean difference = 0.002, std = 0.06) was observed when the
5-design experiment was
repeated. The cost of reducing the number of orthogonal gradient pulse pairs is small.
After confirming that the reduced directions are sufficient for accurately quantifying μFA using multi-shell data, we studied the minimum SNR for obtaining acceptable μFA maps with just 24 acquisitions. Clinically
acceptable protocol duration is
less than ten minutes, which limits SNR. The effect of noise on the
minimal acquisition protocol’s single-shell
μFA
estimates at b = 3000 s/mm2 are shown in figure 5. An SNR of 40 in non-diffusion-weighted images appears to be the very minimum for measuring μFA at b = 3000 s/mm2.
Conclusion
We have shown that the accuracy of the clinical directional scheme is comparable to that of the 5-design, and that, given sufficient SNR, μFA can be precisely estimated with just 24 acquisitions rather than the 72 required for using the 5-design. This study thus encourages the use of DDE in the clinic for microstructural imaging.
Acknowledgements
This study was funded by Child Health Research CIO. We also thank Champalimaud Foundation for seed funding.References
1. Özarslan, Evren. "Compartment shape anisotropy (CSA) revealed by double pulsed field gradient MR." Journal of Magnetic Resonance 199.1 (2009): 56-67.
2. Jespersen, Sune Nørhøj, et al. "Orientationally invariant metrics of apparent compartment eccentricity from double pulsed field gradient diffusion experiments." NMR in Biomedicine 26.12 (2013): 1647-1662.
3. Yang, Grant, et al. "Double diffusion encoding MRI for the clinic." Magnetic resonance in medicine 80.2 (2018): 507-520.
4.. Lampinen, Björn, et al. "Neurite density imaging versus imaging of microscopic anisotropy in diffusion MRI: a model comparison using spherical tensor encoding." Neuroimage 147 (2017): 517-531.
5. Veraart, Jelle, et al. "Denoising of diffusion MRI using random matrix theory." NeuroImage 142 (2016): 394-406.
6. Kellner, Elias, et al. "Gibbs‐ringing artifact removal based on local subvoxel‐shifts." Magnetic resonance in medicine 76.5 (2016): 1574-1581.
7. Guizar-Sicairos, Manuel, Samuel T. Thurman, and James R. Fienup. "Efficient subpixel image registration algorithms." Optics letters 33.2 (2008): 156-158.
Figures
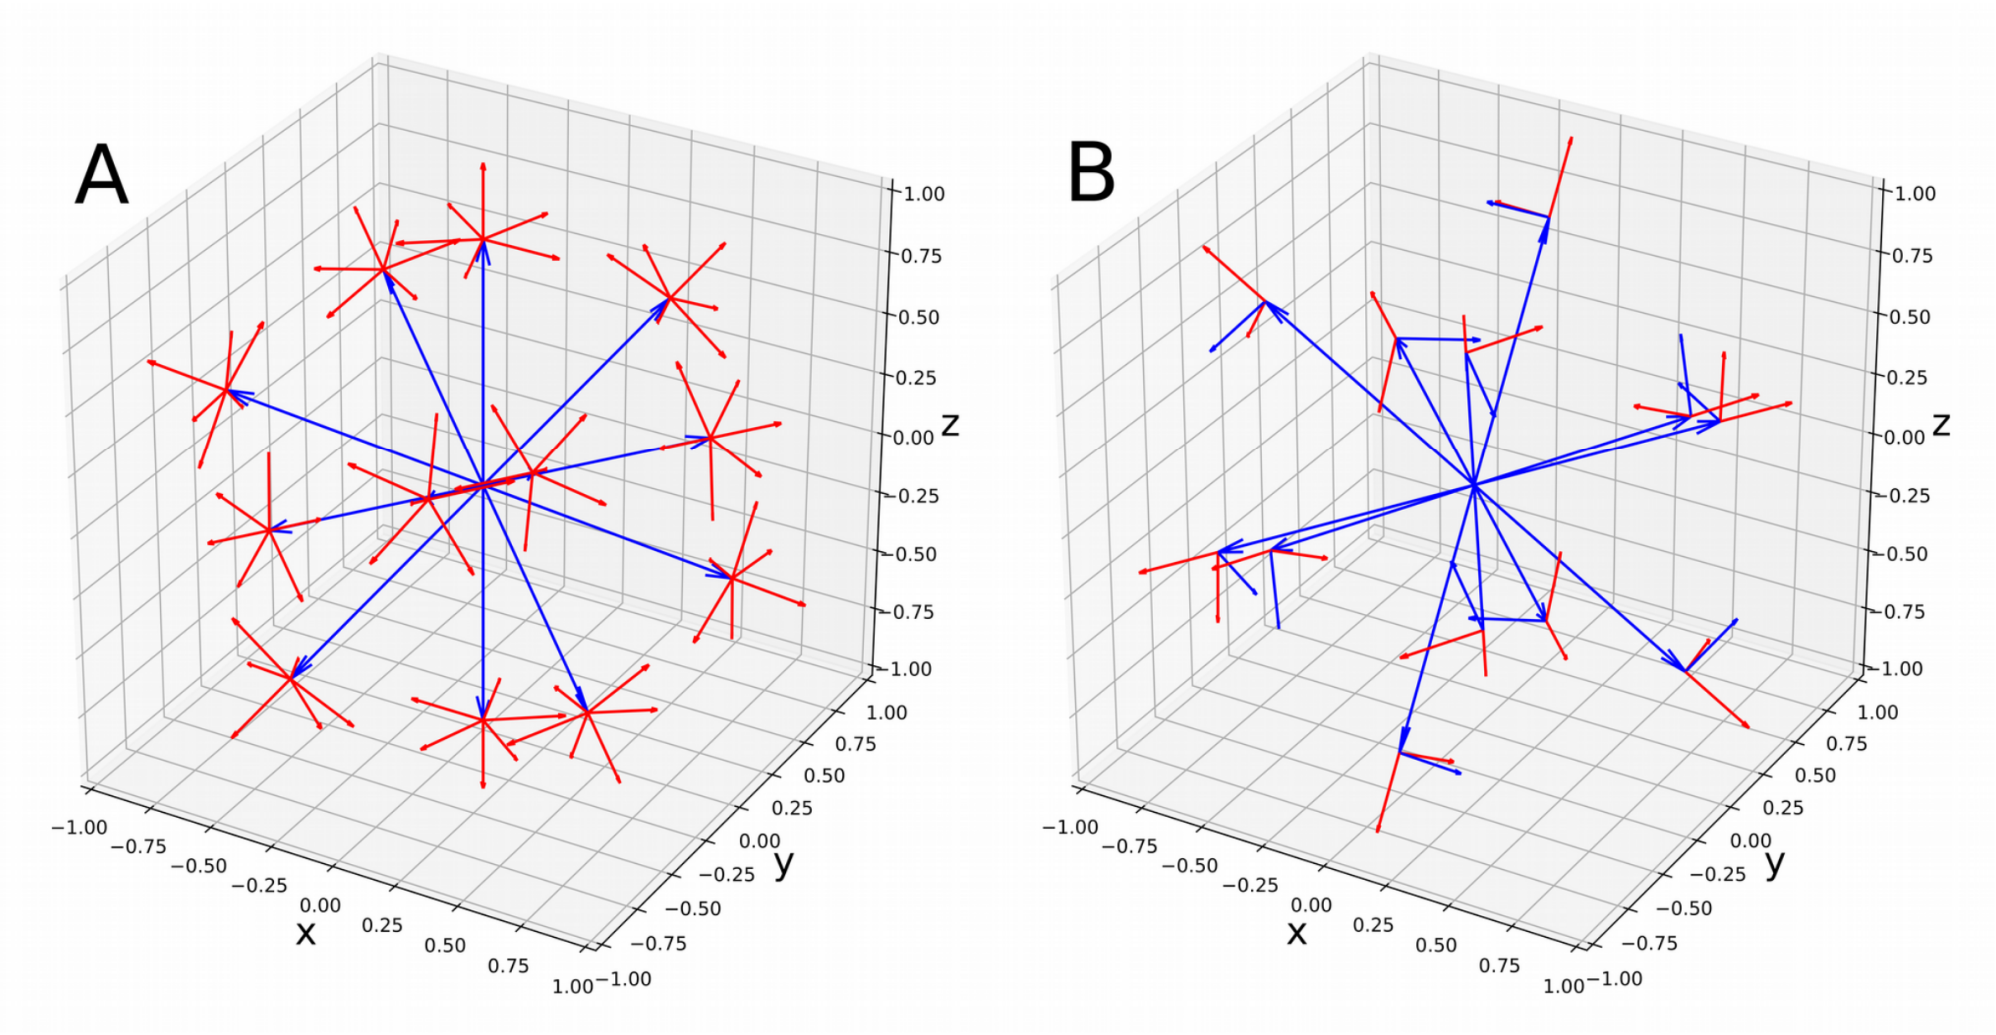
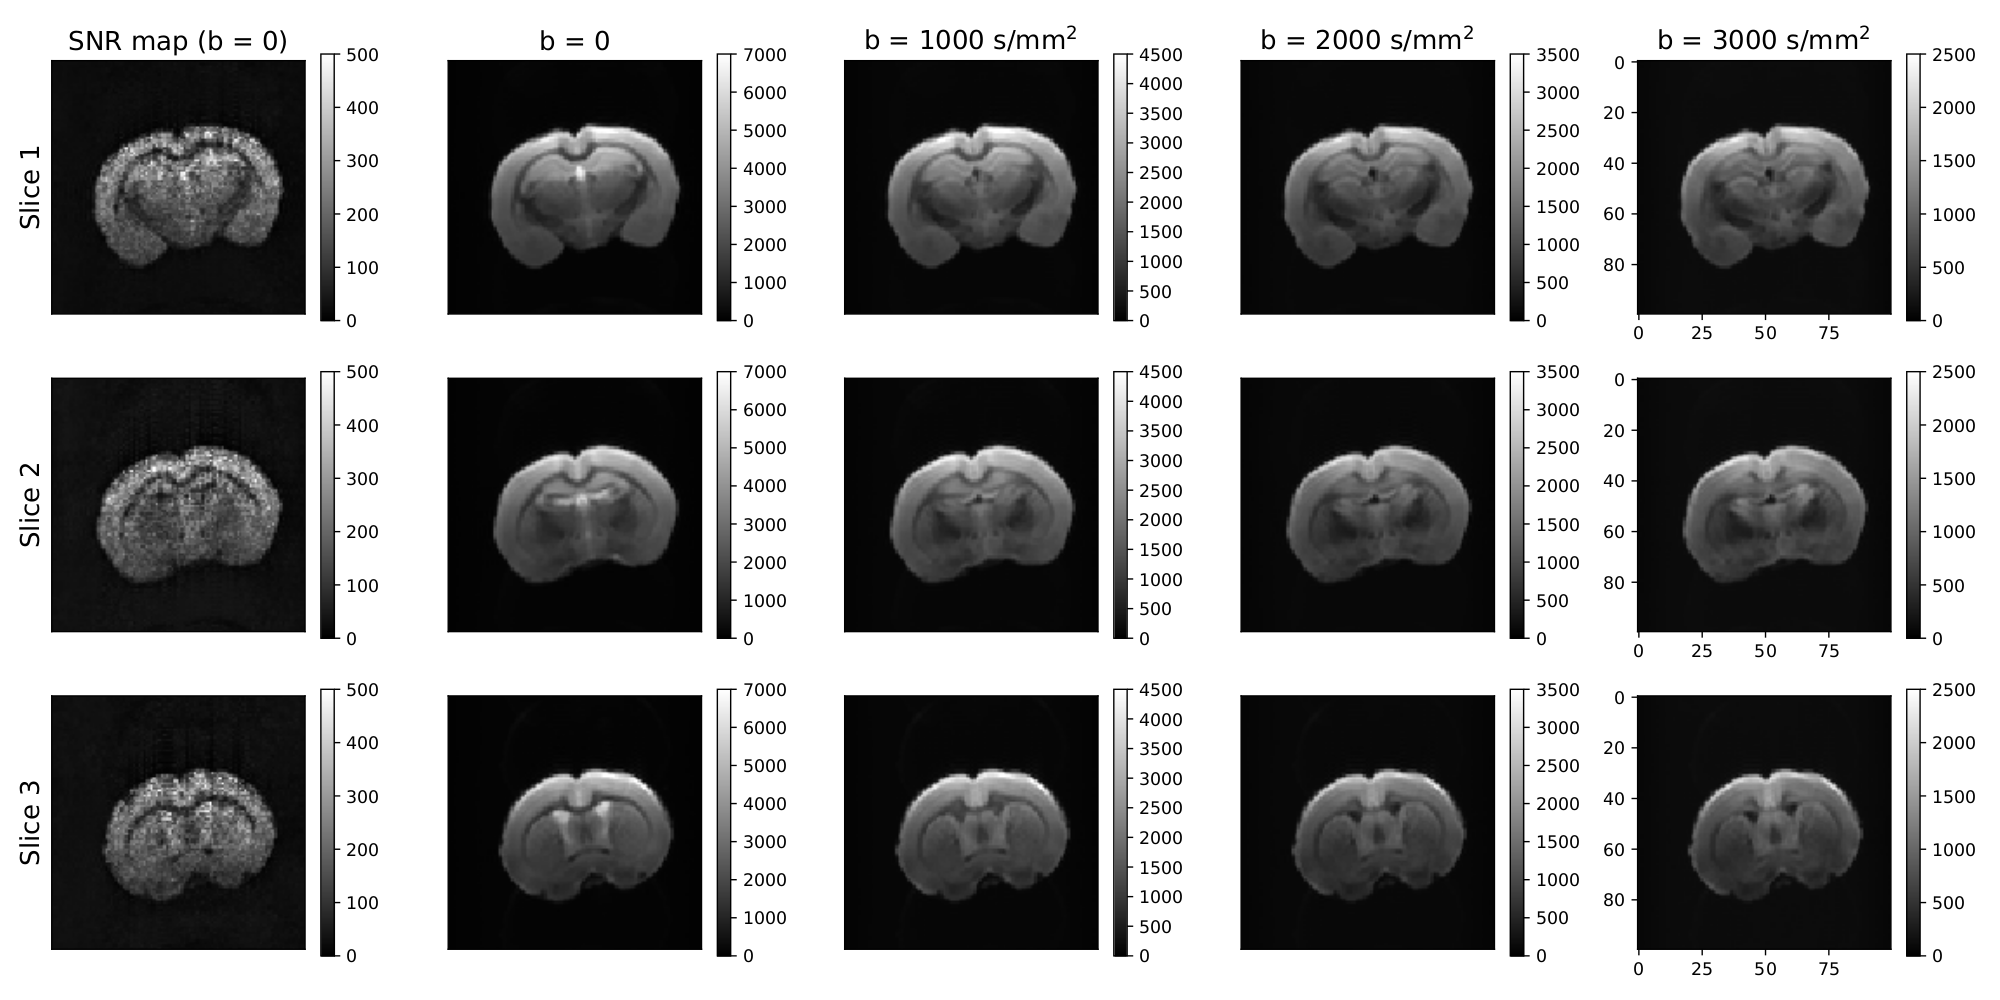
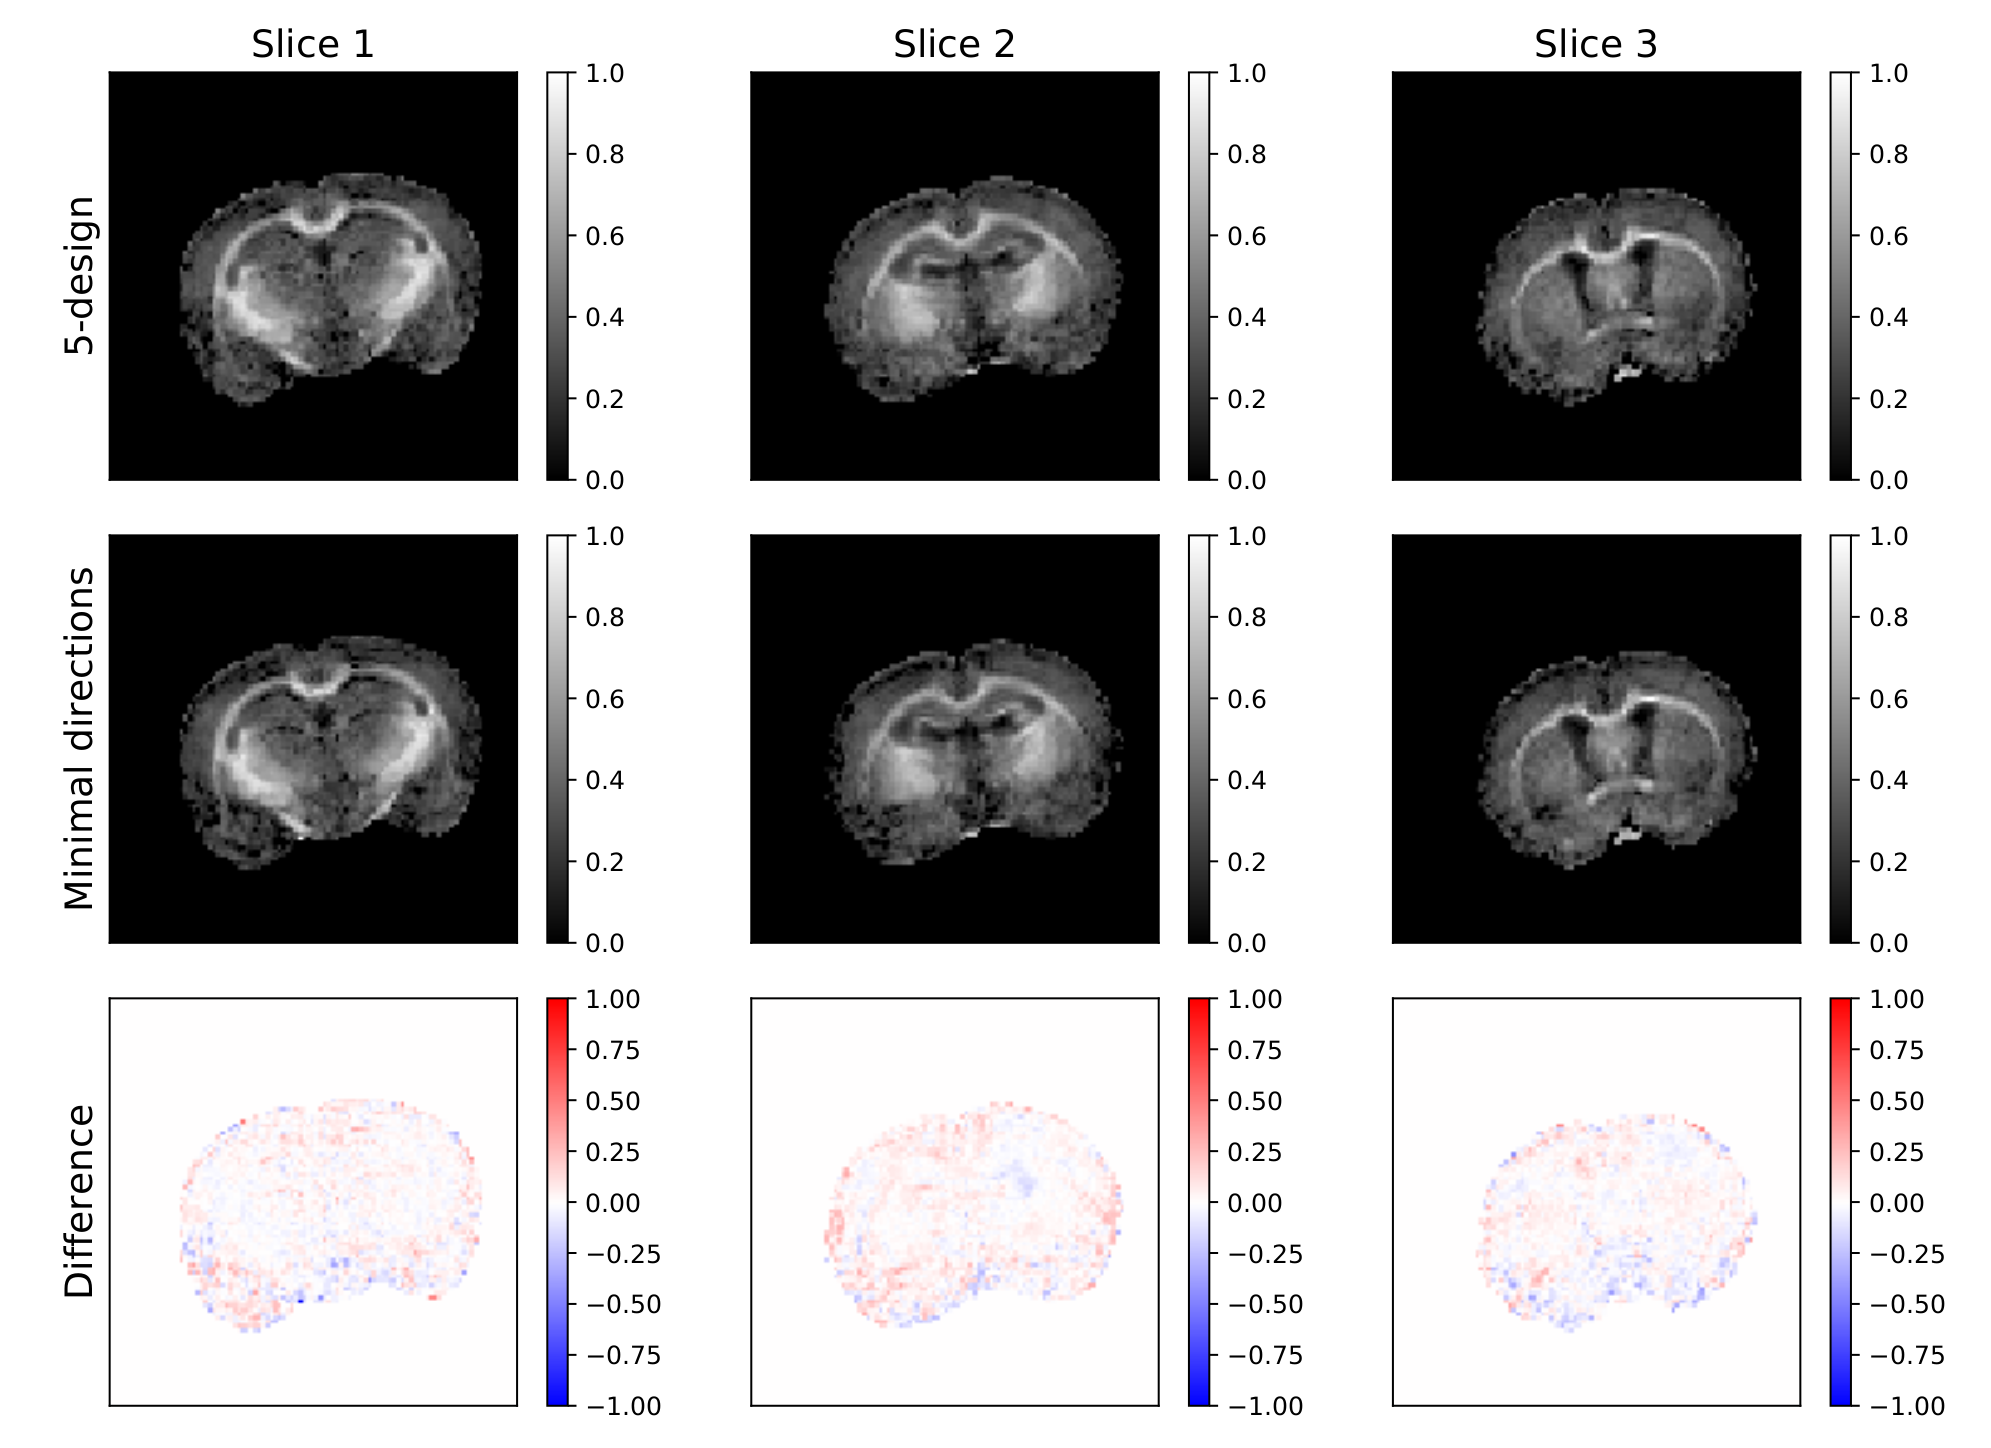
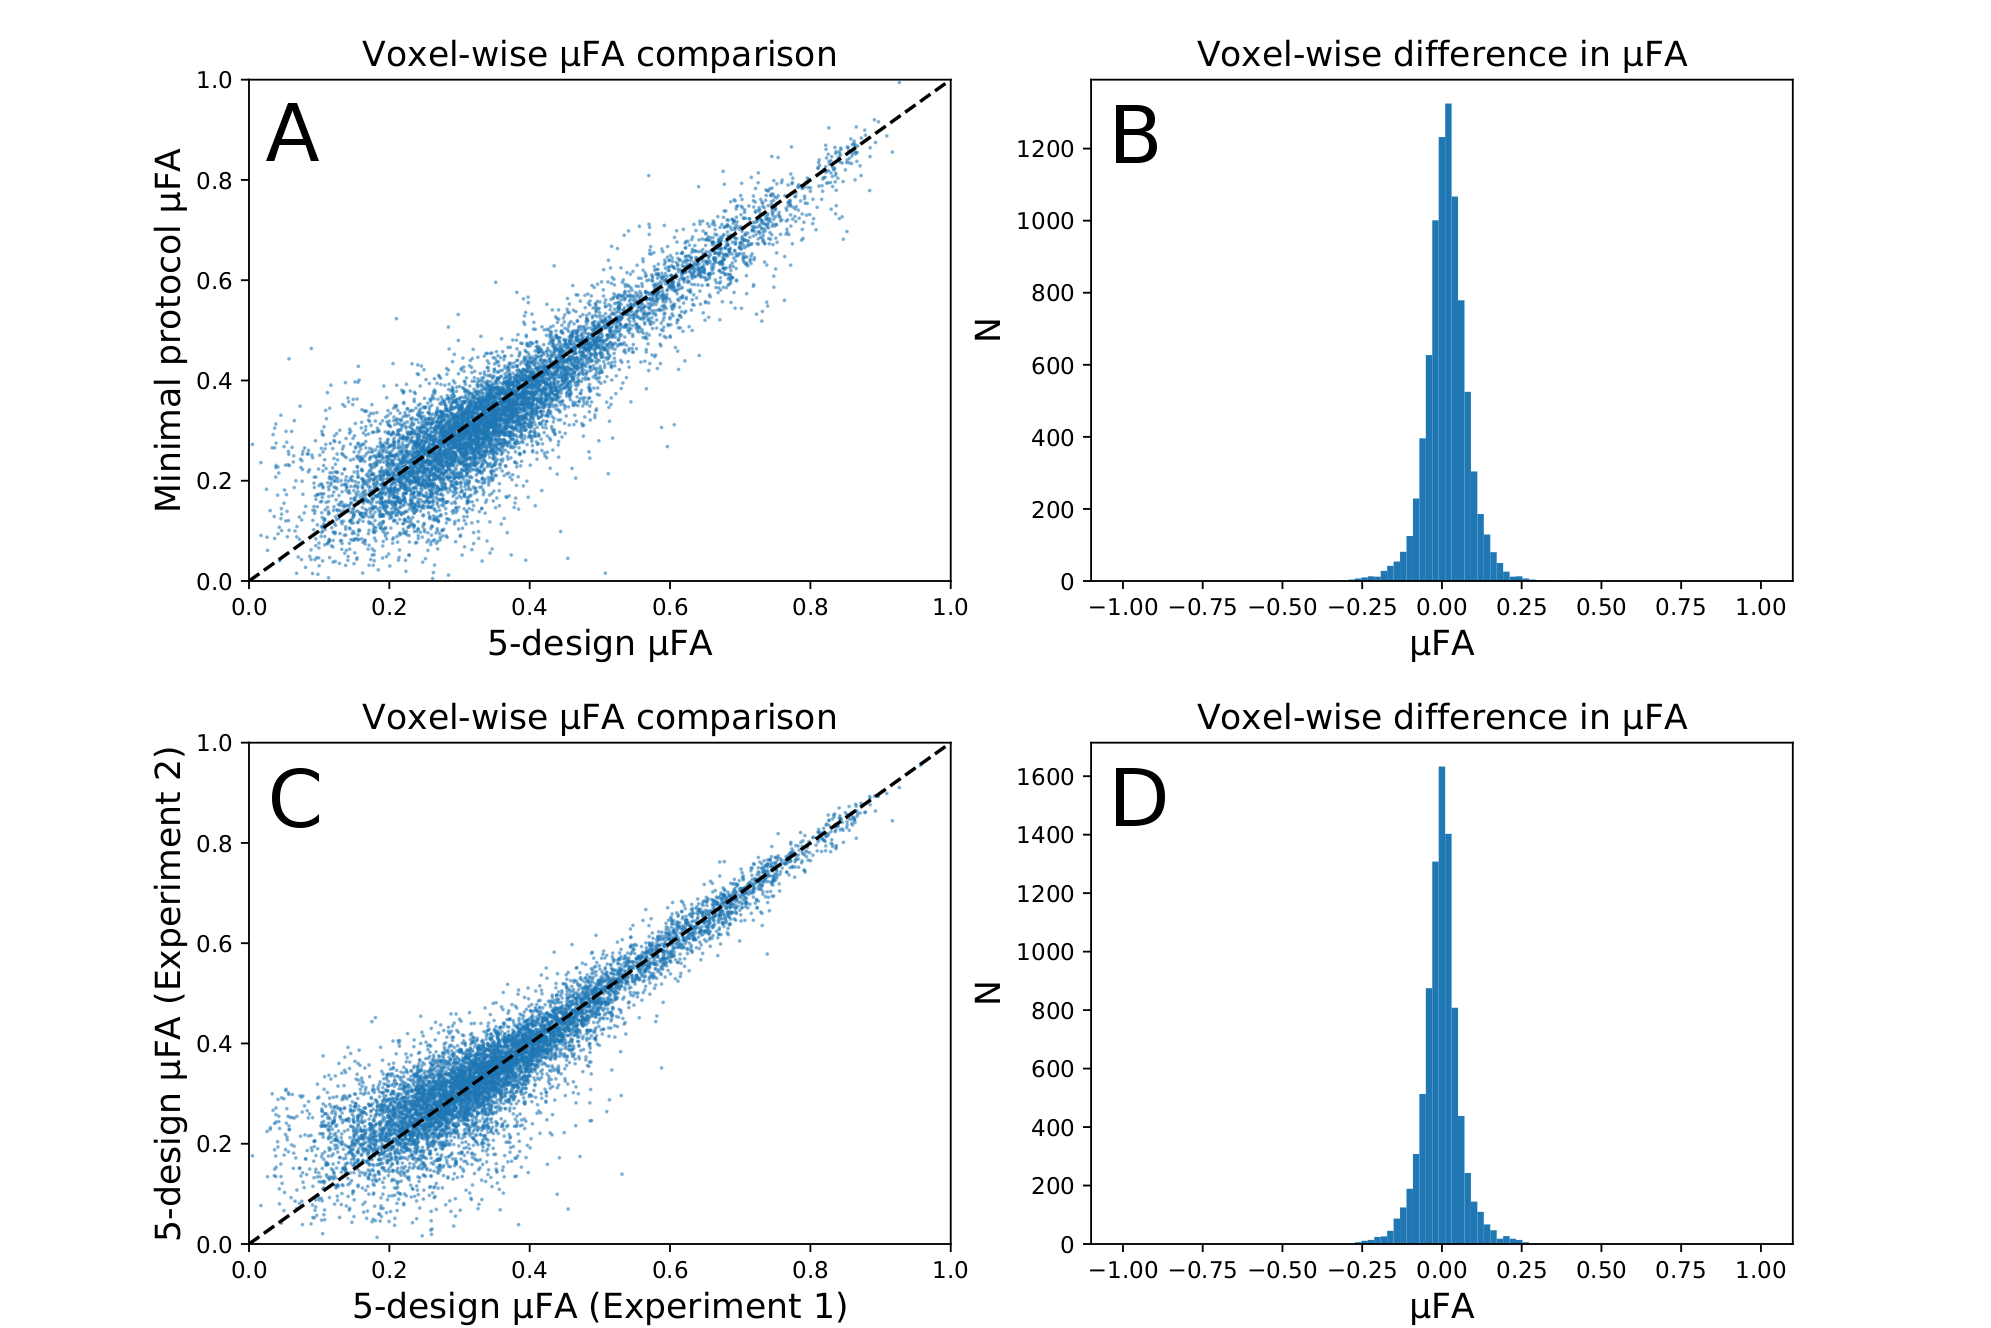
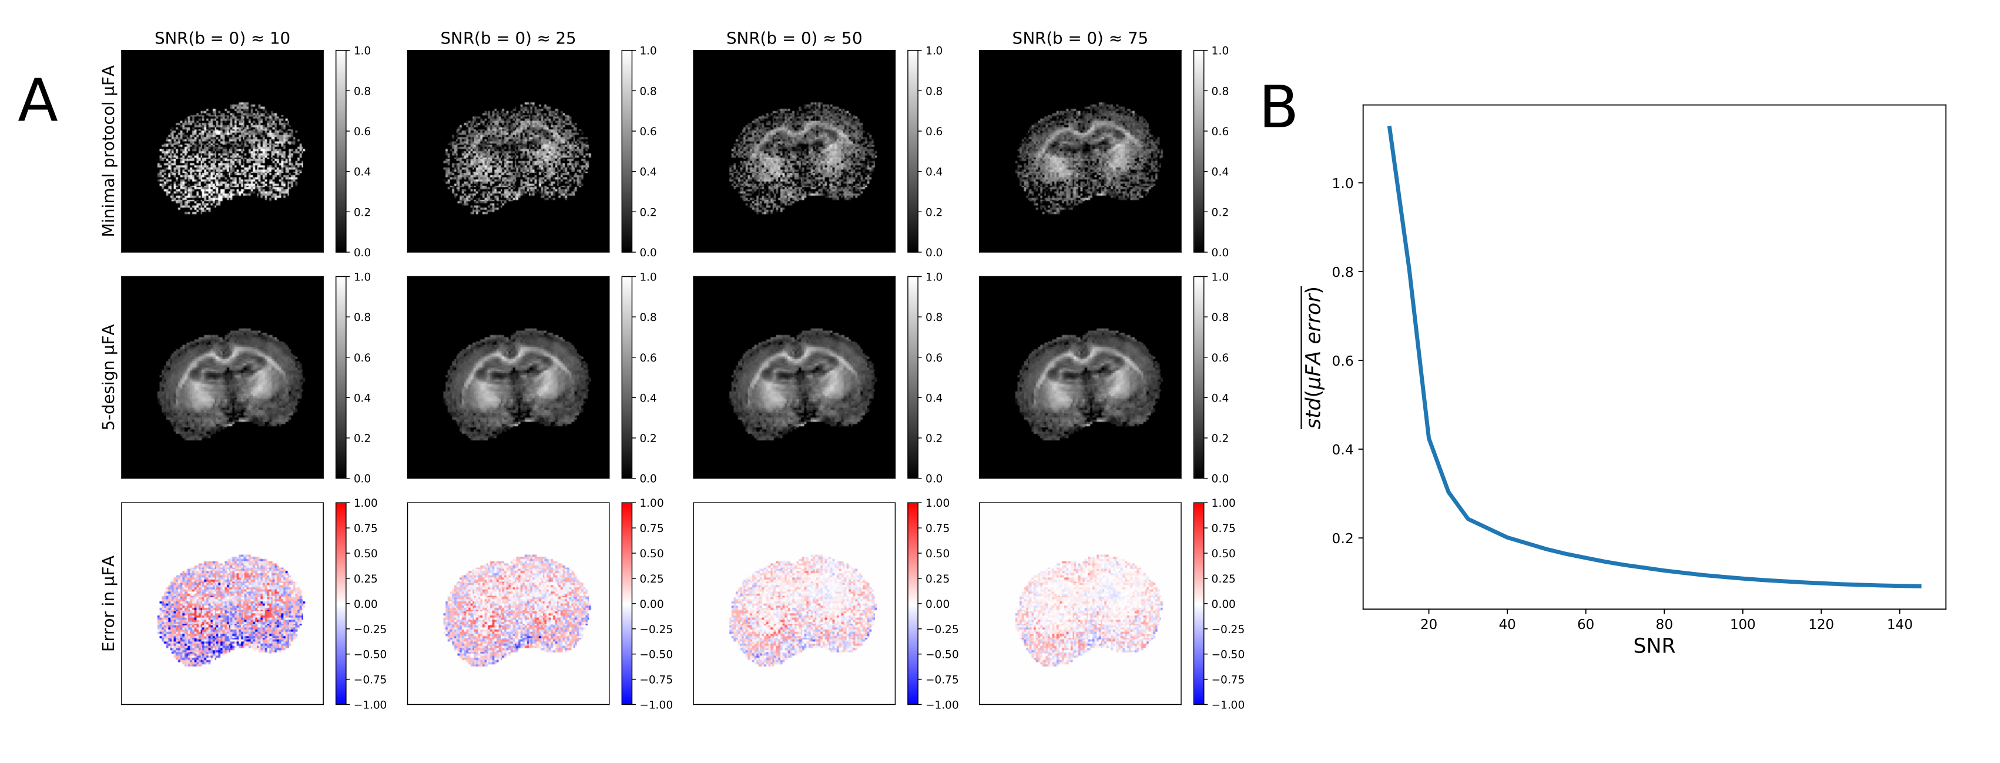
Figure 5. A) 1st row:
Examples
of μFA
maps
calculated with single-shell
data acquired with the minimal
protocol at
b = 3000 s/mm2
with synthetic noise added to data to lower SNR. 2nd row: μFA map calculated with multi-shell 5-design data with no additional noise. 3rd row: The
difference between the two (5-design - minimal scheme). B)
The average standard deviation of the voxel-wise μFA difference between single-shell minimal protocol with 24 acquisitions and multi-shell 5-design with 216 acquisitions. 100 repetitions of added noise for each SNR.