3553
Diffusion Kurtosis Imaging (DKI) Biomarkers correlate with dysfunction in the EAE model of MS1CFIN, Aarhus University, Aarhus, Denmark, 2Department of Neurobiology Research, Institute for Molecular Medicine,University of South Denmark, Odense, Denmark, 3Champalimaud Center for Unknown, Lisbon, Portugal, 4Dept. of Physics and Astronomy, Aarhus University, Aarhus, Denmark
Synopsis
To study the relationship between microstructure and disability, 18 ex-vivo spinal cords from a mouse model of MS (EAE) were investigated using DKI and a biophysical model of diffusion. Diffusion data were acquired together with T2* images to delineate lesions. Kurtosis tensors and microstructural parameters were used for statistical analysis using a LME model. The results show a strong relation between disability and kurtosis tensor parameters similar to observations in other hypomyelinating MS models and in patients. Conversely, changes in model parameters, such as extra-axonal axial diffusivity, are clearly different from previous studies using other animal models of MS.
Introduction
Due to its noninvasiveness and ability to contrast soft tissues, MRI is among the most prominent multiple sclerosis (MS) diagnosis techniques1,2. Conventional T1-or T2-weighted images can reveal brain atrophy and lesions, which are areas harboring demyelination, inflammation, gliosis and axonal injury3,4. Recent studies5–7 show that diffuse damage in normal appearing white matter (NAWM) and gray matter (GM) contributes to disability accumulation and chronic disease progression while lesions are mainly responsible for reversible impairment. Diffusion kurtosis imaging, DKI8,9 is a technique, which utilizes deviations from Gaussian diffusion to yield biomarkers and provide access to microstructural parameters when combined with tissue modeling. DKI biomarkers have been associated with cognitive impairment in MS10, chronic injury in MS animal models11–13 and neurite myelin content14. Experimental autoimmune encephalomyelitis (EAE) is one of the most compelling MS animal models. However, neither DKI metrics nor white matter models have been used to investigate EAE-induced disability. In this study, the ability of DKI to inform diagnostics for MS was tested by exploring the relationship between said metrics and EAE-disability.Methods
18 (MOG)p35–55-treated mice (experiment ethically approved) were monitored daily and EAE-severity was graded on a 6-point scale, prior to spinal cord extraction.
Imaging of spinal cords (SC, segments T8-L6) was performed with a 16.4T Bruker Aeon Ascend scanner using a diffusion weighted fast spin echo sequence(credit to Dr.KD Harkins and Prof.MD Does, NIH-EB019980)14–16 ETL=8,TE/ESP=15/4.23ms,TR=2000ms,$$$\delta/\Delta=$$$1.5/10ms and b=0.2,0.3,0.5,0.6,0.9,1,1.2,1.5,1.8,2.1,2.5ms/µm2, voxel size 0.5x0.035x0.035mm3.
T2*-weighted images for manual WM, GM and lesion delineation17, were acquired using FLASH pulse sequence with TE=5ms.
Images were denoised18 and corrected for Gibbs ringing19. In WM, shells up to $$$b_\mathrm{max}=2.5$$$msµm-2 and GM up to $$$b_\mathrm{max}=1.2$$$msµm-2 were fit20 with Weighted Linear Least Squares21, to yield diffusion and kurtosis tensors8. Tensor parameters were calculated according to8,9, which yielded parameters of Watson Standard Model(WSM), assuming Watson distribution of neurites22,23. Only the ‘plus’ branch22,24,25($$$D_\mathrm{a}>D_{\mathrm{e},\parallel}$$$) was considered.
10 WM parameters (DKI:$$$D_\parallel$$$, FA,$$$K_\parallel$$$,$$$K_\perp$$$, and WSM:$$$D_{\mathrm{e},\perp}$$$,$$$D_{\mathrm{e},\parallel}$$$,$$$D_\mathrm{a}$$$,$$$f$$$,$$$\kappa$$$) and 2 GM parameters $$$\bar{D}$$$ and $$$\bar{W}=\frac{\mathrm{Tr}\left(\mathbf{W}\right)}{5}$$$ 9,26,27 were estimated.
The voxels from all spinal cords were analyzed with linear mixed effects model28,29(Wilkinson notation30: $$$p_i \sim g\cdot s +l +\left(s\cdot g | a\right)+\left(l|a\right)$$$, where diffusion parameters are $$$p_i$$$, grade $$$g$$$, segment $$$s$$$, lesion $$$l$$$, animal $$$a$$$). For each of the ‘fixed’ effects, ANOVA p-values were calculated post-hoc.
Results
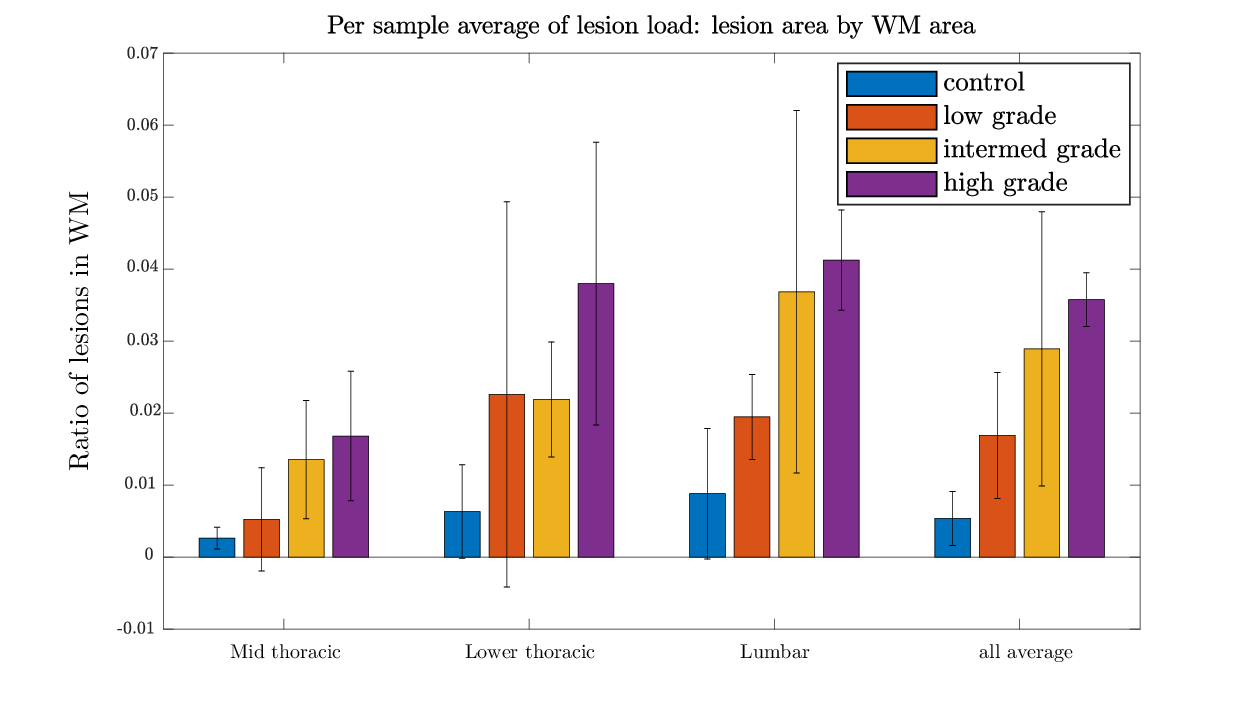
Lesion
load was not significantly different between
EAE-disabilities
groups(Figure
1).
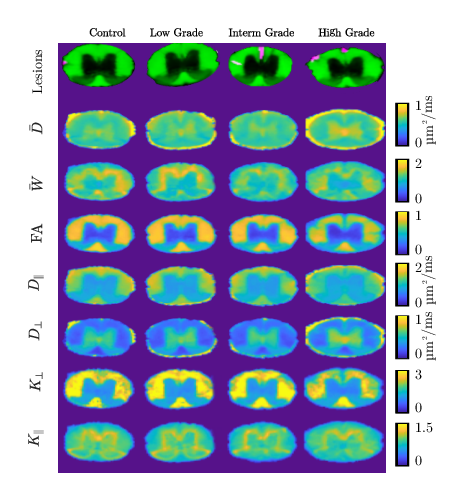
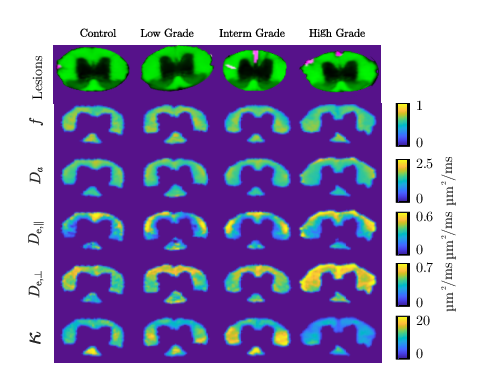
In
the parameter maps
we
observed
an
increased
asymmetry in animals with a
higher
disability grade(Figures
2,3).
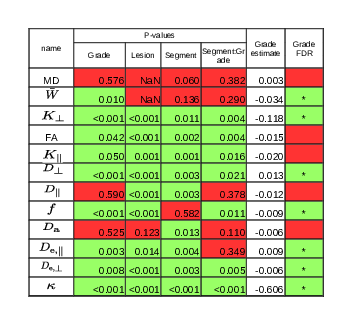
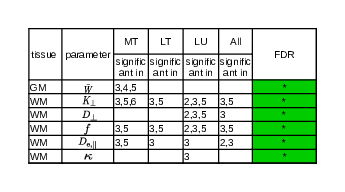
Grade had a significant effect on 7 out of 12 parameters after FDR:
$$$\bar{W}$$$ in GM, $$$K_\perp$$$,$$$D_\perp$$$,$$$D_{\mathrm{e},\parallel}$$$,$$$D_{\mathrm{e},\perp}$$$, $$$\kappa$$$ and $$$f$$$ in WM (Figure
4).
Finally,
post-hoc
analysis
investigated the
group-wise
behavior of the segment-wise means
for GM and NAWM (Figure
5).
In
NAWM, 5 out of the 6 biomarkers surviving FDR demonstrated
significant differences between the grades in the lumbar and
3 ($$$K_\perp$$$,$$$f$$$,$$$D_{\mathrm{e},\parallel}$$$)
in lower thoracic and mid-thoracic SC
segments.
2 DKI ($$$K_{\perp}$$$,$$$D_\perp$$$), and 2 WSM parameters ($$$f$$$,$$$D_{\mathrm{e},\parallel}$$$) depended significantly on EAE
grade. $$$D_\perp$$$,$$$K_\perp$$$,$$$f$$$ and $$$D_{\mathrm{e},\parallel}$$$ were
significant
with no distinction between the segments. The same
type of post-hoc
analysis investigated
the tissue
inside lesions and
did
not show any
significant
differences between EAE-grades.Discussion
In GM, $$$\bar{W}$$$ depended significantly on disability grade, in line with human studies10,31–33 and the cuprizone model12. Changes in $$$\bar{W}$$$ indicate GM pathology, that could be due to neuronal degeneration and myelin loss.
In NAWM, $$$K_\perp$$$ and $$$D_\perp$$$ were most robust parameters distinguishing between disability grades, which has been observed in other MS models11,13,14. An increase in $$$D_\perp$$$ agrees with chronic demyelination studies11,13,14. Human studies associated it with demyelination34 and axonal loss35.
Among WSM parameters, $$$D_{\mathrm{e},\parallel}$$$ and axonal water fraction($$$f$$$, a biomarker of axonal loss36) affected the EAE-grade most. This is in contrast with hypomyelination models11,12,37, where effects on $$$D\mathrm{a}$$$ and $$$D_{\mathrm{e},\perp}$$$ were the strongest. Technical differences (i.e. using SC or particular ‘branch’ of the WSM model22,37,38) aside, the prominent role of $$$D_{\mathrm{e},\parallel}$$$ may result from different mechanisms underlying tissue degeneration in hypomyelination models compared to EAE. The increase in extra-axonal diffusivities can be explained by axonal damage, glial cells structure changes, and myelin loss, that cause lowered tortuosity in the extra-axonal space. This novel observation indicates $$$D_{\mathrm{e},\parallel}$$$ as a key parameter that may prove important for MS and EAE disability characterization
Conclusion
- Inside WM lesions, no biomarker was found to correlate with disability.
- In NAWM and GM, the relationship between disability and DKI/DTI metrics was similar to other hypomyelinating MS models and ex-vivo MS tissue.
- A combination of strong increase in $$$D_{\mathrm{e},\parallel}$$$ and a
potentially-verifiable change in $$$f$$$ is
clearly distinct in comparison to other MS animal models.
Acknowledgements
The authors are grateful for financial support of this project by Lundbeck Foundation Grant R83‐A7548 and Simon Fougner Hartmanns Familiefond. AC and BH acknowledge support from NIH1R01EB012874‐01. The laboratory was made possible by funding from the Infrastructure program of the Danish Research Council, the Velux Foundations, and the Department of Clinical Medicine, AU. The authors thank Dr Kevin D Harkins and Prof. Mark D Does from Vanderbilt University for the REMMI pulse sequence and reconstruction toolbox used in this study, which were supported through grant number NIH EB019980. NS was supported in part by the European Research Council (ERC) under the European Union’s Horizon 2020 research and innovation programme (grant agreement No. 679058 – DIRECT-fMRI). The authors also thank Dina Arengoth and Pia Nyborg Nielsen for expert technical assistance. AW and TO acknowledge financial support from Lundbeck Foundation, Danish Multiple Sclerosis Society, Independent Research Fund Denmark The authors would also like to offer special thanks to Shemesh Lab members in Champalimaud Center for Unknown that provided their extensive help during the acquisition stages and, in particular, to Teresa Serrades Duarte, Daniel Nunes, Rui Simões and Cristina Chavarría.References
1. Bakshi, R. et al. MRI in multiple sclerosis: current status and future prospects. Lancet Neurol. 7, 615–625 (2008).
2. Polman, C. H. et al. Diagnostic criteria for multiple sclerosis: 2010 Revisions to the McDonald criteria. Ann. Neurol. 69, 292–302 (2011).
3. Filippi, M. et al. Association between pathological and MRI findings in multiple sclerosis. Lancet Neurol. 11, 349–360 (2012).
4. Inglese, M. & Bester, M. Diffusion imaging in multiple sclerosis: research and clinical implications. NMR Biomed. 23, 865–872 (2010).
5. Miller, D. H., Thompson, A. J. & Filippi, M. Magnetic resonance studies of abnormalities in the normal appearing white matter and grey matter in multiple sclerosis. J. Neurol. 250, 1407–1419 (2003).
6. De Stefano, N. et al. Brain damage as detected by magnetization transfer imaging is less pronounced in benign than in early relapsing multiple sclerosis. Brain 129, 2008–2016 (2006).
7. Kipp, M., Nyamoya, S., Hochstrasser, T. & Amor, S. Multiple sclerosis animal models: a clinical and histopathological perspective. Brain Pathol. 27, 123–137 (2016).
8. Jensen, J. H., Helpern, J. A., Ramani, A., Lu, H. & Kaczynski, K. Diffusional kurtosis imaging: The quantification of non-gaussian water diffusion by means of magnetic resonance imaging. Magn. Reson. Med. 53, 1432–1440 (2005).
9. Jensen, J. H. & Helpern, J. A. MRI quantification of non-Gaussian water diffusion by kurtosis analysis. NMR Biomed. 23, 698–710 (2010).
10. Bester, M. et al. Non-Gaussian diffusion MRI of gray matter is associated with cognitive impairment in multiple sclerosis. Mult. Scler. J. 21, 935–944 (2015).
11. Falangola, M. F. et al. Histological correlation of diffusional kurtosis and white matter modeling metrics in cuprizone-induced corpus callosum demyelination. NMR Biomed. 27, 948–957 (2014).
12. Guglielmetti, C. et al. Diffusion kurtosis imaging probes cortical alterations and white matter pathology following cuprizone induced demyelination and spontaneous remyelination. NeuroImage 125, 363–377 (2016).
13. Jelescu, I. O. et al. In vivo quantification of demyelination and recovery using compartment-specific diffusion MRI metrics validated by electron microscopy. NeuroImage 132, 104–114 (2016).
14. Kelm, N. D. et al. Evaluation of diffusion kurtosis imaging in ex vivo hypomyelinated mouse brains. NeuroImage 124, Part A, 612–626 (2016).
15. Beaulieu, C. F., Zhou, X., Cofer, G. P. & Johnson, G. A. Diffusion-weighted MR microscopy with fast spin-echo. Magn. Reson. Med. 30, 201–206 (1993).
16. West, K. L. et al. Experimental studies of g-ratio MRI in ex vivo mouse brain. NeuroImage 167, 366–371 (2018).
17. The spinal cord: a Christopher and Dana Reeve Foundation text and atlas. (Academic, 2009).
18. Veraart, J., Fieremans, E. & Novikov, D. S. Diffusion MRI noise mapping using random matrix theory. Magn. Reson. Med. 76, 1582–1593 (2015).
19. Kellner, E., Dhital, B., Kiselev, V. G. & Reisert, M. Gibbs‐ringing artifact removal based on local subvoxel‐shifts. Magn. Reson. Med. 76, 1574–1581 (2015).
20. Chuhutin, A., Hansen, B. & Jespersen, S. N. Precision and accuracy of diffusion kurtosis estimation and the influence of b-value selection. NMR Biomed. 30, e3777 (2017).
21. Veraart, J., Sijbers, J., Sunaert, S., Leemans, A. & Jeurissen, B. Weighted linear least squares estimation of diffusion MRI parameters: Strengths, limitations, and pitfalls. NeuroImage 81, 335–346 (2013).
22. Jespersen, S. N., Olesen, J. L., Hansen, B. & Shemesh, N. Diffusion time dependence of microstructural parameters in fixed spinal cord. NeuroImage (2017). doi:10.1016/j.neuroimage.2017.08.039
23. Novikov, D. S., Veraart, J., Jelescu, I. O. & Fieremans, E. Rotationally-invariant mapping of scalar and orientational metrics of neuronal microstructure with diffusion MRI. NeuroImage 174, 518–538 (2018).
24. Novikov, D. S., Fieremans, E., Jespersen, S. N. & Kiselev, V. G. Quantifying brain microstructure with diffusion MRI: Theory and parameter estimation. NMR Biomed. 0, e3998 (2018).
25. Hansen, B. & Jespersen, S. N. Recent Developments in Fast Kurtosis Imaging. Front. Phys. 5, (2017). 26. Hansen, B., Lund, T. E., Sangill, R. & Jespersen, S. N. Erratum: Hansen, Lund, Sangill, and Jespersen. Experimentally and Computationally Fast Method for Estimation of a Mean Kurtosis. Magnetic Resonance in Medicine 69:1754-1760 (2013). Magn. Reson. Med. 71, 2250–2250 (2014).
27. Hansen, B., Lund, T. E., Sangill, R. & Jespersen, S. N. Experimentally and computationally fast method for estimation of a mean kurtosis. Magn. Reson. Med. 69, 1754–1760 (2013).
28. Gelman, A. & Hill, J. Data analysis using regression and multilevel/hierarchical models. (Cambridge University Press, 2007).
29. Goldstein, H. Multilevel statistical models. (Wiley, 2011).
30. Wilkinson, G. N. & Rogers, C. E. Symbolic Description of Factorial Models for Analysis of Variance. J. R. Stat. Soc. Ser. C Appl. Stat. 22, 392–399 (1973).
31. Zackowski, K. M. et al. Sensorimotor dysfunction in multiple sclerosis and column-specific magnetization transfer-imaging abnormalities in the spinal cord. Brain 132, 1200–1209 (2009).
32. Agosta, F. et al. In vivo assessment of cervical cord damage in MS patients: a longitudinal diffusion tensor MRI study. Brain 130, 2211–2219 (2007).
33. Raz, E. et al. A Better Characterization of Spinal Cord Damage in Multiple Sclerosis: A Diffusional Kurtosis Imaging Study. Am. J. Neuroradiol. 34, 1846–1852 (2013).
34. Klawiter, E. C. et al. Radial diffusivity predicts demyelination in ex vivo multiple sclerosis spinal cords. NeuroImage 55, 1454–1460 (2011).
35. Naismith, R. T. et al. Increased diffusivity in acute multiple sclerosis lesions predicts risk of black hole. Neurology 74, 1694 (2010).
36. Fieremans, E., Jensen, J. H. & Helpern, J. A. White matter characterization with diffusional kurtosis imaging. NeuroImage 58, 177–188 (2011).
37. Jelescu, I. O., Veraart, J., Fieremans, E. & Novikov, D. S. Degeneracy in model parameter estimation for multi‐compartmental diffusion in neuronal tissue. NMR Biomed. 29, 33–47 (2015).
38. Hansen, B. et al. White matter biomarkers from fast protocols using axially symmetric diffusion kurtosis imaging. NMR Biomed. 30, e3741 (2017).
39. Chuhutin, A. et al.
Diffusion Kurtosis Imaging maps
neural damage in
the EAE model
of multiple sclerosis. ArXiv2460999 Q-bio. (2018).
Figures