3548
Probing tissue microstructure using filtered q-trajectory imaging1Harvard Medical School, Boston, MA, United States, 2Brigham and Women's Hospital, Boston, MA, United States, 3Lund University, Lund, Sweden
Synopsis
We introduce an approach to characterize tissue microstructure using an extension of the q-trajectory imaging (QTI) technique in diffusion MRI. Our approach applies multiplicative filters to the diffusion tensor distribution (DTD) functions of the underlying tissue to obtain more specific information of tissue microstructure using the statistical moments of the filtered DTD's.We propose several descriptive statistics to distinguish microstructures that cannot be separated using existing methods.These measures are demonstrated in simulations and in vivo data acquired from a human brain.
Introduction
Recently several advanced diffusion magnetic resonance (dMRI) gradient sequences, such as double diffusion encoding (DDE)1,2 and q-trajectory encoding (QTE)3,4 sequences, have been proposed to measure tissue microstructure. In particular, q-trajectory imaging (QTI) is general technique that uses optimized QTE sequences to probe tissue microstructure3. The corresponding signal model is given by
$$s(B) = s_0 \int e^{-(D,B)} \rho(D) d D,$$
where $$$B$$$ is a $$$3\times 3$$$ matrix determined by the acquisition sequence, $$$D$$$ denotes the diffusion tensor and $$$\rho(D)$$$ represents the diffusion tensor distribution (DTD) function of the underlying tissue. In this work, we introduce an approach to probe tissue microstructure using a family of filtered DTD functions. In particular, we consider a nonnegative scalar function $$$f(D)$$$. The filtered DTD function according to $$$f(D)$$$ is defined by
$$\rho_f(D) = \frac{f(D)}{\langle f(D) \rangle_{\rho}}\rho(D),$$
where $$$\langle f(D) \rangle_{\rho} = \int f(D) \rho(D) d D$$$. The moments of $$$\rho_f(D)$$$ can be computed as
$$\int D^{\otimes k}\rho_f(D) d D = \frac{\int D^{\otimes k}f(D)\rho(D) d D}{\langle f(D) \rangle_{\rho}}.$$
We note that if $$$f(D)$$$ is a polynomial function, then the moments of $$$\rho_f(D)$$$ can be represented in terms of the moments of $$$\rho(D)$$$.
We consider two types of filters to measure different aspects of the DTD. The first filter is $$$f_{\rm fast}(D) = \tfrac13{\rm trace}(D)$$$ which imposes higher weight to diffusion tensors with faster diffusivity. The second filter is given by $$$f_{\rm slow}(D)= D_{\max}-\tfrac13{\rm trace}(D)$$$ where $$$D_{\max}$$$ is set to 5 $$${\rm \mu m^2/ms}$$$ in this work so that $$$f_{\rm slow}(D)$$$ is positive. Since both filters are linear, the n-th order moments of the filtered DTD can be computed using the first (n+1)-th order moments of $$$\rho(D)$$$. In this work, we consider the case when n=2 so that the moments can be estimated using clinically feasible sequences. Moreover, we estimate the moments of DTD by using the following cumulant expansion
$$s(B) \approx s_0\exp(-(\bar D, B)+\tfrac12 ({\mathbb C}, B^{\otimes 2}) -\tfrac16({\mathfrak C}, B^{\otimes 3})),$$
where $$$\bar D = \langle D \rangle_\rho, {\mathbb C} = \langle (D-\bar D)^{\otimes 2} \rangle_\rho, {\mathfrak C}=\langle (D-\bar D)^{\otimes 3} \rangle_\rho$$$, and $$$(\cdot, \cdot)$$$ denotes the inner product between tensors. In this work, we estimate the model parameters by fitting $$$\log(s(B))$$$ to the measurements using the above model based on the least-squares algorithm. We can show that full-rank B matrices are required in order to estimate the model parameters.
The mean and variance of the DTD have been applied to compute the fractional anisotropy (FA), microscopic FA ($$$\mu$$$FA), mean diffusivity (MD) and mean kurtosis (MK) measures in3,6. In this work, we are also able to compute these measures for the two weighted DTD functions. Furthermore, we propose two additional measures. Specifically, let $$$\lambda_1, \ldots, \lambda_3$$$ denote the eigenvalues of a diffusion tensor $$$D$$$ and let $$$\bar \lambda= \tfrac13 \sum_{i=1}^3 \lambda_i$$$. Then, we define
$$\nu = \frac{\tfrac13 \sum_{i=1}^3 (\lambda_i -\bar \lambda)^3}{(\tfrac13 \sum_{i=1}^3 (\lambda_i -\bar \lambda)^2)^{3/2}},$$
which measures the skewness of the distribution of eigenvalues. We further generalize $$$\nu$$$ to $$C_\nu = \frac{\tfrac13 \langle \sum_{i=1}^3 (\lambda_i(D) -\bar \lambda(D))^3 \rangle_\rho }{(\tfrac13 \langle \sum_{i=1}^3 (\lambda_i(D) -\bar \lambda(D))^2 \rangle_\rho)^{3/2}},$$
which measure the microscopic skewness of the DTD. These two measures provide complementary information to existing measures to characterize tissue microstructure.
Experiments
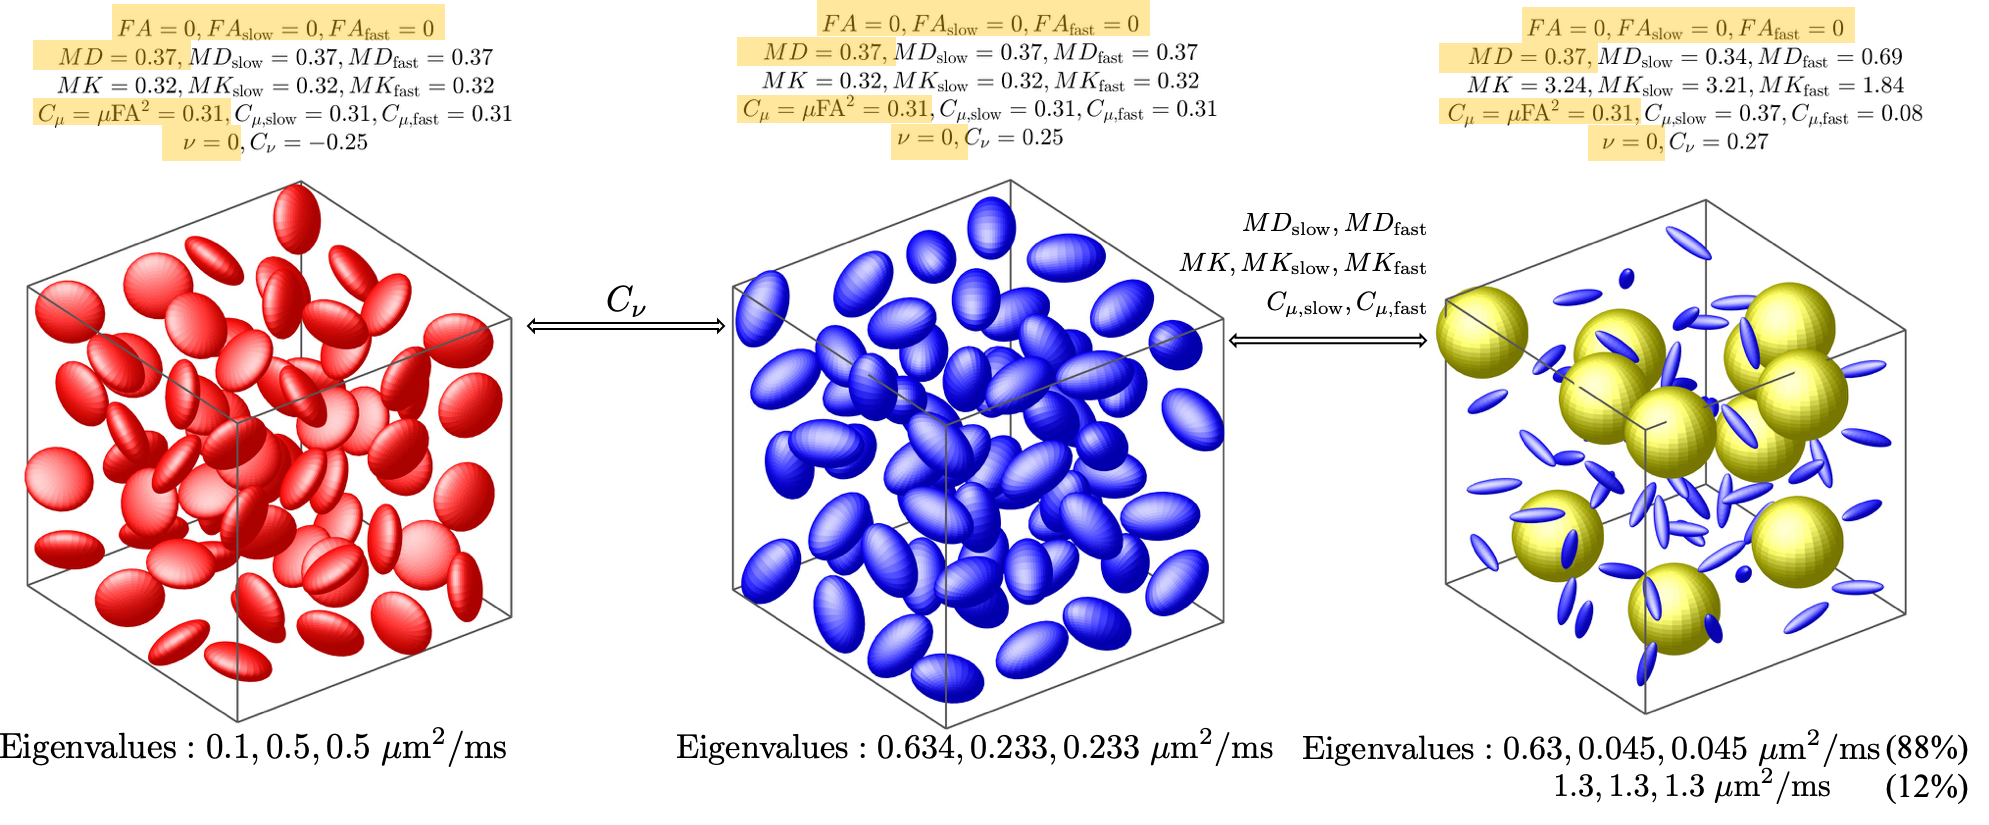
Simulations: We computed the microstructural measures for three simulated DTD functions shown in Fig. 1. The first and second structures consist of randomly oriented tensors with the same eigenvalues whereas the third structure consists of two types of tensors.
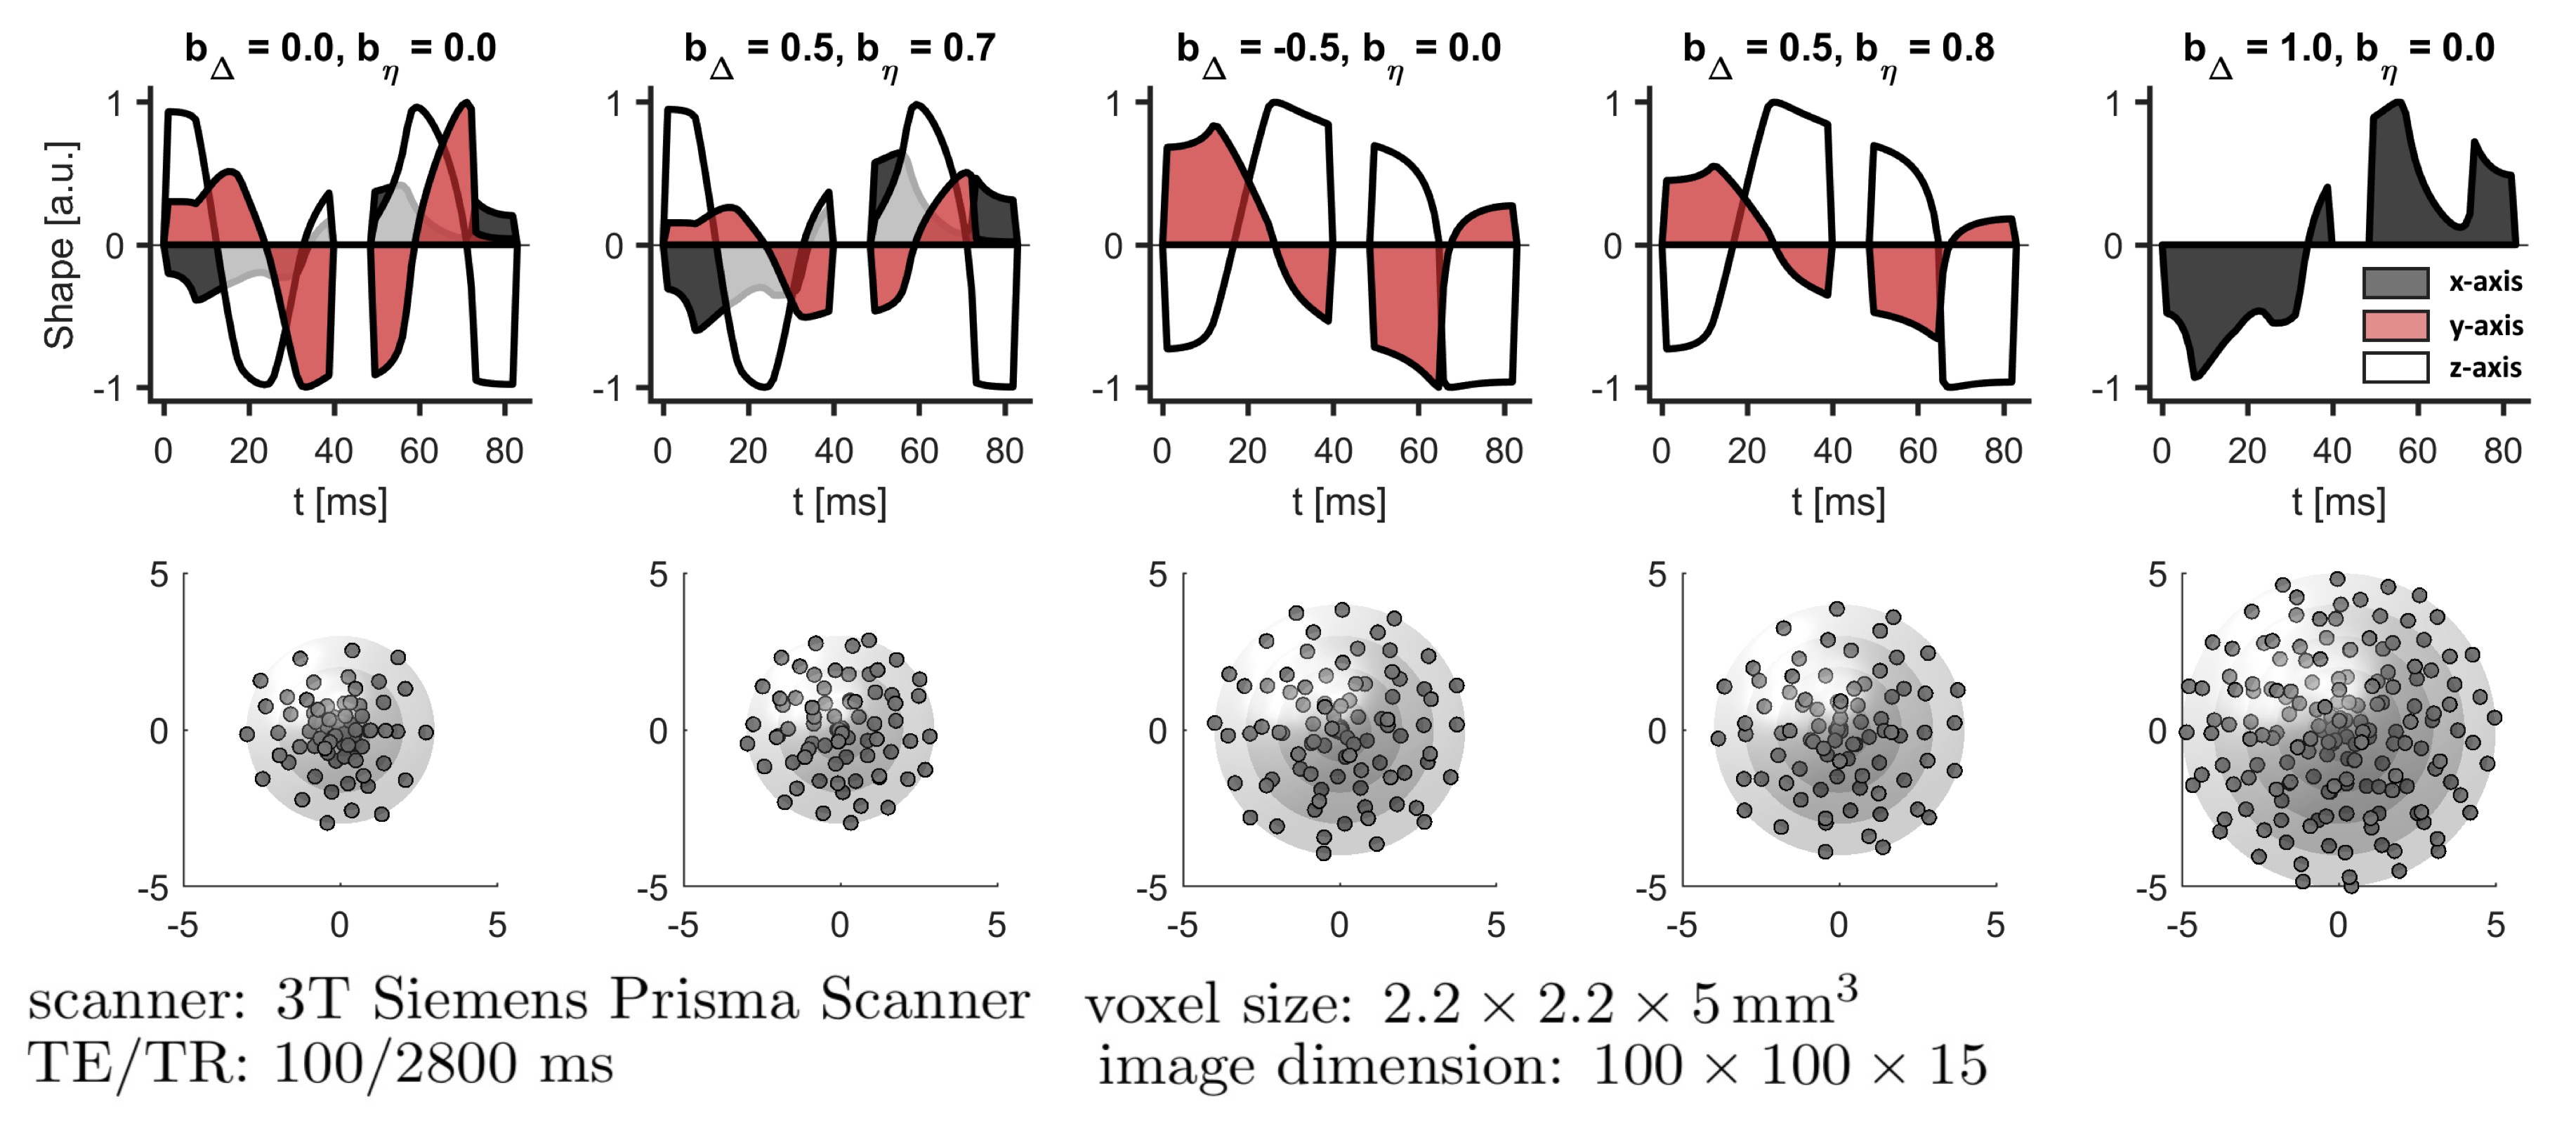
In vivo data: We acquired 513 image volumes using QTE sequences. The sequence parameters $$$B_{\delta}, B_\eta$$$, b-values, rotation directions and other experimental parameters are shown in Fig. 2. The images were corrected for motion and eddy7. We also applied the approach in8 to remove Gibbs ringing effects.
Results
Simulations: As shown in Fig. 1, all three structures have the same FA, MD and $$$\mu$$$FA values. The third structure has different values for slow and fast diffusion weighted measures. Moreover, $$$C_\nu$$$ is able to distinguish the first and second structures.
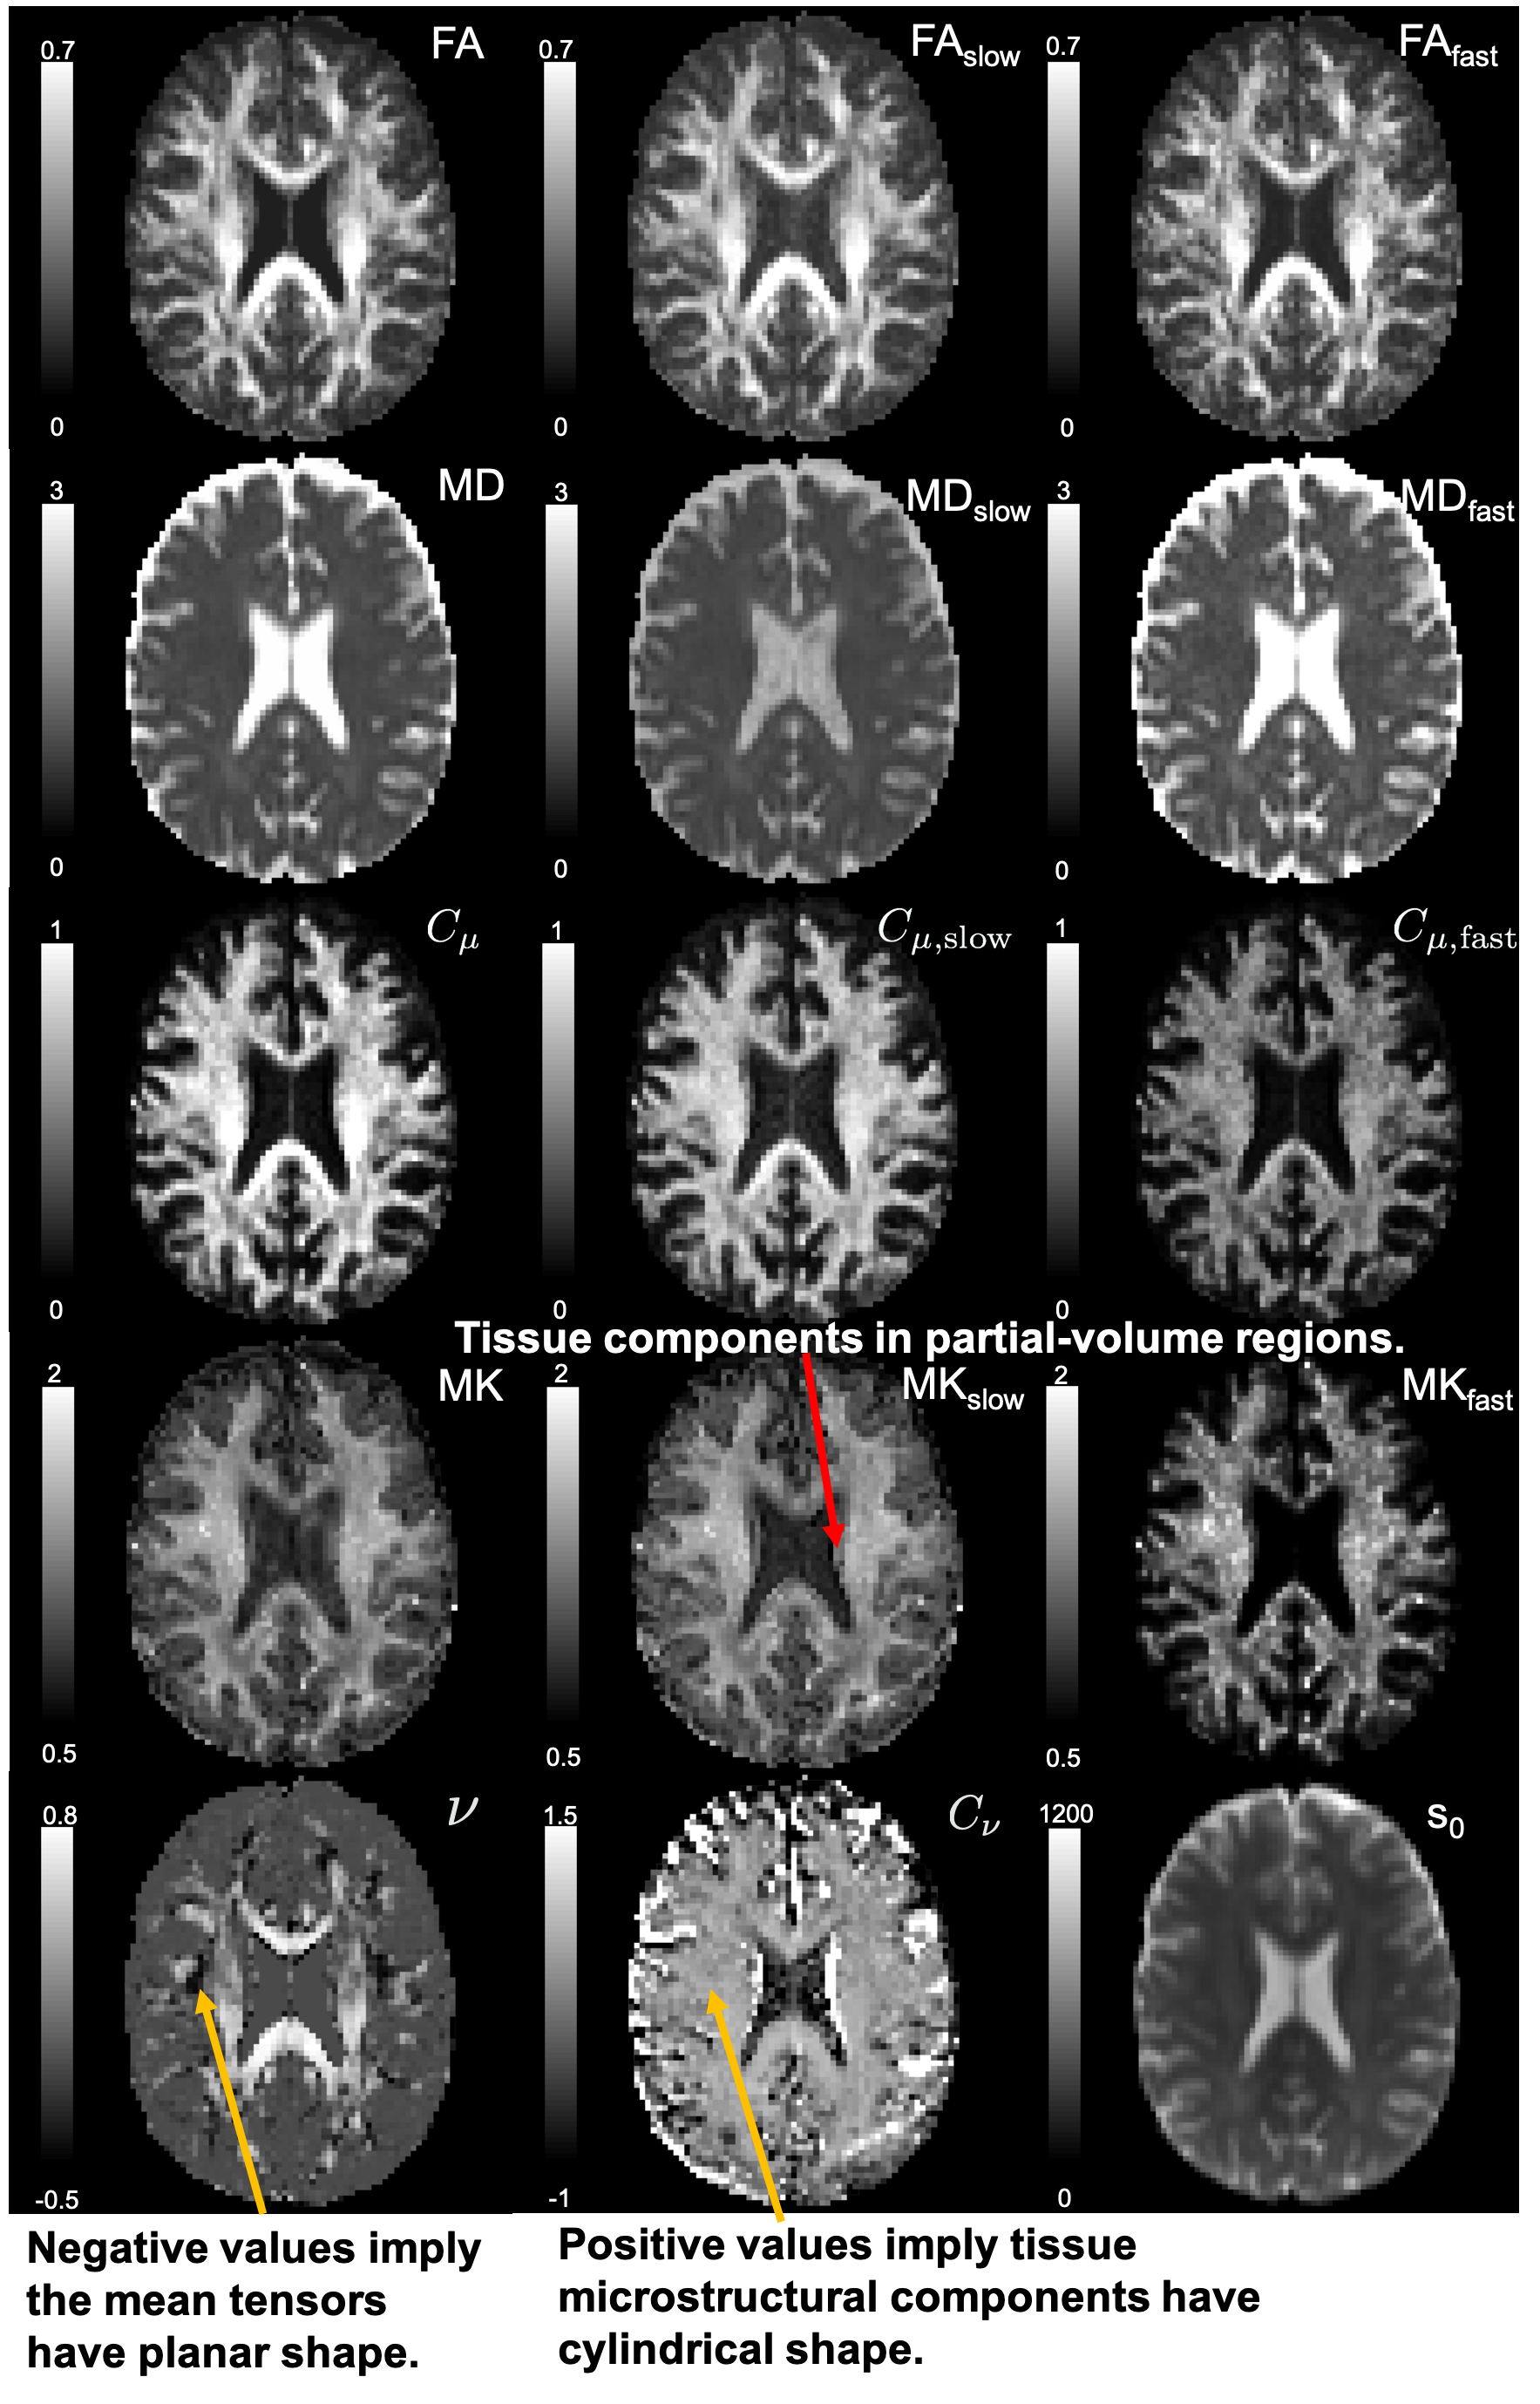
In vivo data: Fig. 3 illustrates the the microstructural measures for an axial slice of the brain. As shown by the red arrow, the MK of slow-diffusion weighted DTD is able to extract information from tissue components in partial-volume regions. The yellow arrows show that the mean tensor in regions with crossing fibers have planar shapes since $$$\nu$$$ is negative but the underlying tissue components have cylindrical shapes as indicated by the positive values of $$$C_\nu$$$.
Discussion and conclusion
We have introduced an approach for investigating filtered diffusion tensor distributions based on their moments. Experiments using simulations and in vivo data show that the proposed measures are able to distinguish different DTD functions and possibly provide more specific information about the underlying tissue microstructure.Acknowledgements
This work is supported in part by NIH grants R21MH116352, R21MH115280 (PI: Ning), R01MH116173, R01MH097979, R01MH111917 (PI: Rathi), R01MH074794 (PI: Westin).References
[1] P. T. Callaghan, I. Furó, Diffusion-diffusion correlation and exchange as a signature for local order and dynamics, The Journal of Chemical Physics 120 (8) (2004) 4032–4038.
[2] P. P. Mitra, Multiple wave-vector extensions of the NMR pulsed-field- gradient spin-echo diffusion measurement, Phys. Rev. B 51 (1995) 15074– 15078.
[3] C.-F. Westin, H. Knutsson, O. Pasternak, F. Szczepankiewicz, E. Özarslan, D. van Westen, C. Mattisson, M. Bogren, L. J. O’Donnell, M. Kubicki, D. Topgaard, M. Nilsson, Q-space trajectory imaging for multidimensional diffusion MRI of the human brain, NeuroImage 135 (2016) 345 – 362.
[4] D. Topgaard, Multidimensional diffusion MRI, Journal of Magnetic Reso- nance 275 (2017) 98 – 113.
[5] J. Sjölund, F. Szczepankiewicz, M. Nilsson, D. Topgaard, C.-F. Westin, H. Knutsson, Constrained optimization of gradient waveforms for generalized diffusion encoding, Journal of Magnetic Resonance 261 (2015) 157 – 168.
[6] J. H. Jensen, J. A. Helpern, A. Ramani, H. Lu, K. Kaczynski, Diffusional kurtosis imaging: The quantification of non-gaussian water diffusion by means of magnetic resonance imaging, Magnetic Resonance in Medicine 53 (6) (2005) 1432–1440.
[7] M. Nilsson, F. Szczepankiewicz, D. van Westen, O. Hansson, Extrapolation- based references improve motion and eddy-current correction of high b-value dwi data: Application in Parkinsons disease dementia, PLOS ONE 10 (11) (2015) 1–22.
[8] E. Kellner, B. Dhital, V. G. Kiselev, M. Reisert, Gibbs-ringing artifact removal based on local subvoxel-shifts, Magnetic Resonance in Medicine 76 (5) (2016) 1574–1581.
Figures