3547
Random walk simulation of diffusion MRI in geometries constructed from two-photon microscopy of cortical gray matter1Department of Cognitive Neuroscience, Maastricht University, Maastricht, Netherlands
Synopsis
Introduction
Diffusion MRI of the cortex has shown to be sensitive to diseases such as Alzheimer's disease 1 and multiple sclerosis 2. Additionally, there is a growing interest in modeling and characterizing the layered structure of cortical gray matter areas using a combination of quantitative MRI and microscopy techniques. A biexponential model of diffusion signal was initially used in 3 to separate white matter, gray matter and cerebrospinal fluids. This approach further evolved in neurite orientation dispersion and density imaging (NODDI) 4. In a recent study, cortical layers were observed in cortex with diffusion MRI ex vivo 5. The purpose of this study was to more quantitatively characterize the cytoarchitecture of cortical tissue from microscopy in order to simulate diffusion signal in the cortex and to better understand its changes with density, size and permeability of cell bodies, axons and dendrites.Methods
1-Geometry based indirect simulation
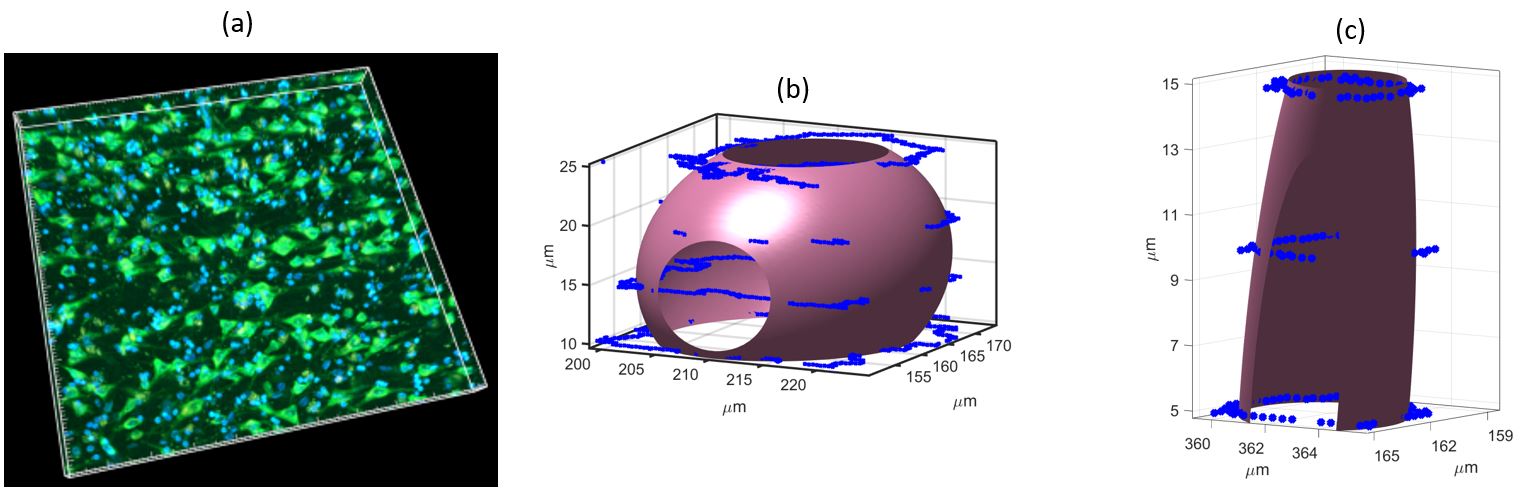
Morphology and density of neurons and glial cells in the cortex were estimated by fitting ellipsoids 6 on cell segmentations created by filtering and Otsu thresholding two-photon microscopy data of a Nissl-like fluorescent cell-body label 7. Figure 1 shows the microscopy, segmented area and ellipsoid fits on neurons and glial cells. Axonal radii and densities were derived from published electron microscopy literature. Using these parameters, geometries corresponding to different cortical layers were mathematically reconstructed. The reconstructed cells were semi-randomly added inside the simulation medium to achieve various layer specific cell densities.
2-Direct simulation from microscopy
Similar to the geometry based simulations, Otsu thresholding was applied to the same samples. However, a geometry number was given to each of cell types instead of fitting ellipsoids on their volumes. Volumes corresponding to glial cells, neurons and extracellular spaces were ascribed with geometry numbers one, two, and three, respectively. These numbered geometries were directly used as the simulation medium. This approach was similar to 8,9, where the aim has been to directly use microscopy as the simulation medium instead of constructing geometries mathematically using spheres, cylinders, or ellipsoids.
Random walk
For both cases, spins were randomly distributed across the geometries and randomly walked. The walks and changes in phases of spins caused by pulsed gradient spin echo diffusion gradients were recorded in order to simulate diffusion MRI at different diffusion times. The permeability of neurons, glial cells, and unmyelinated axons was considered to be 30 µms-1; this value was 10 µms-1 for myelinated axons. After each random walk, it was tested if there has been a jump to another geometry; in this case, the passage probability was simulated similar to 10. Diffusion signals were derived and non-Gaussian diffusion parameters ADC and K of 11 were derived for different mixtures. Diffusion values derived from the simulations were compared with their corresponding in vivo values in the cortex or grey matter.
Results
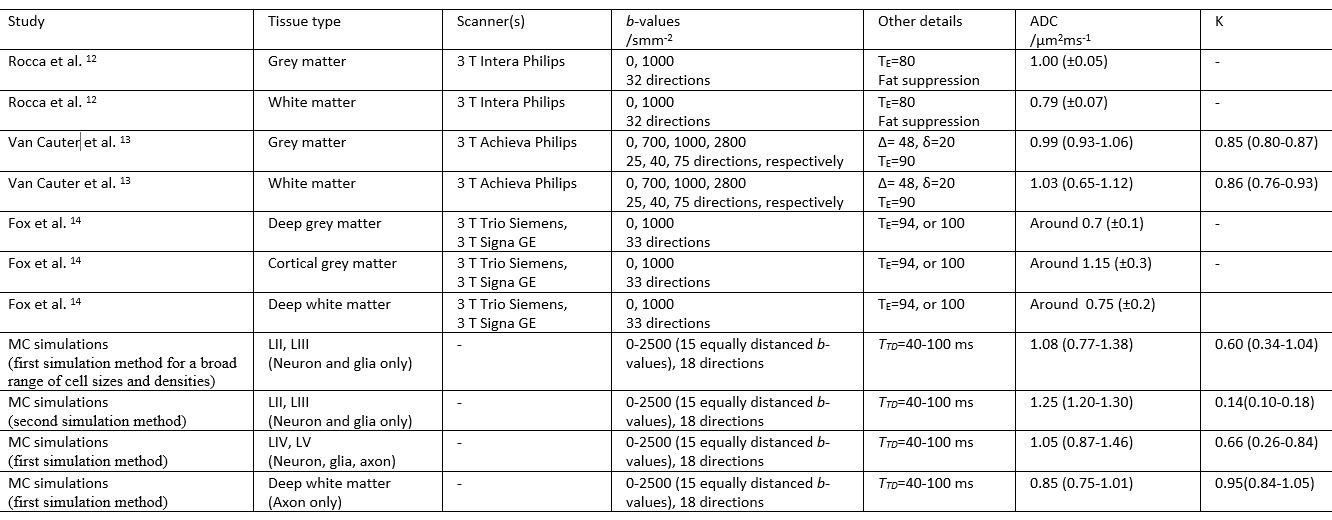
Table 1 is a summary of simulations and the corresponding in vivo reports from the literature.
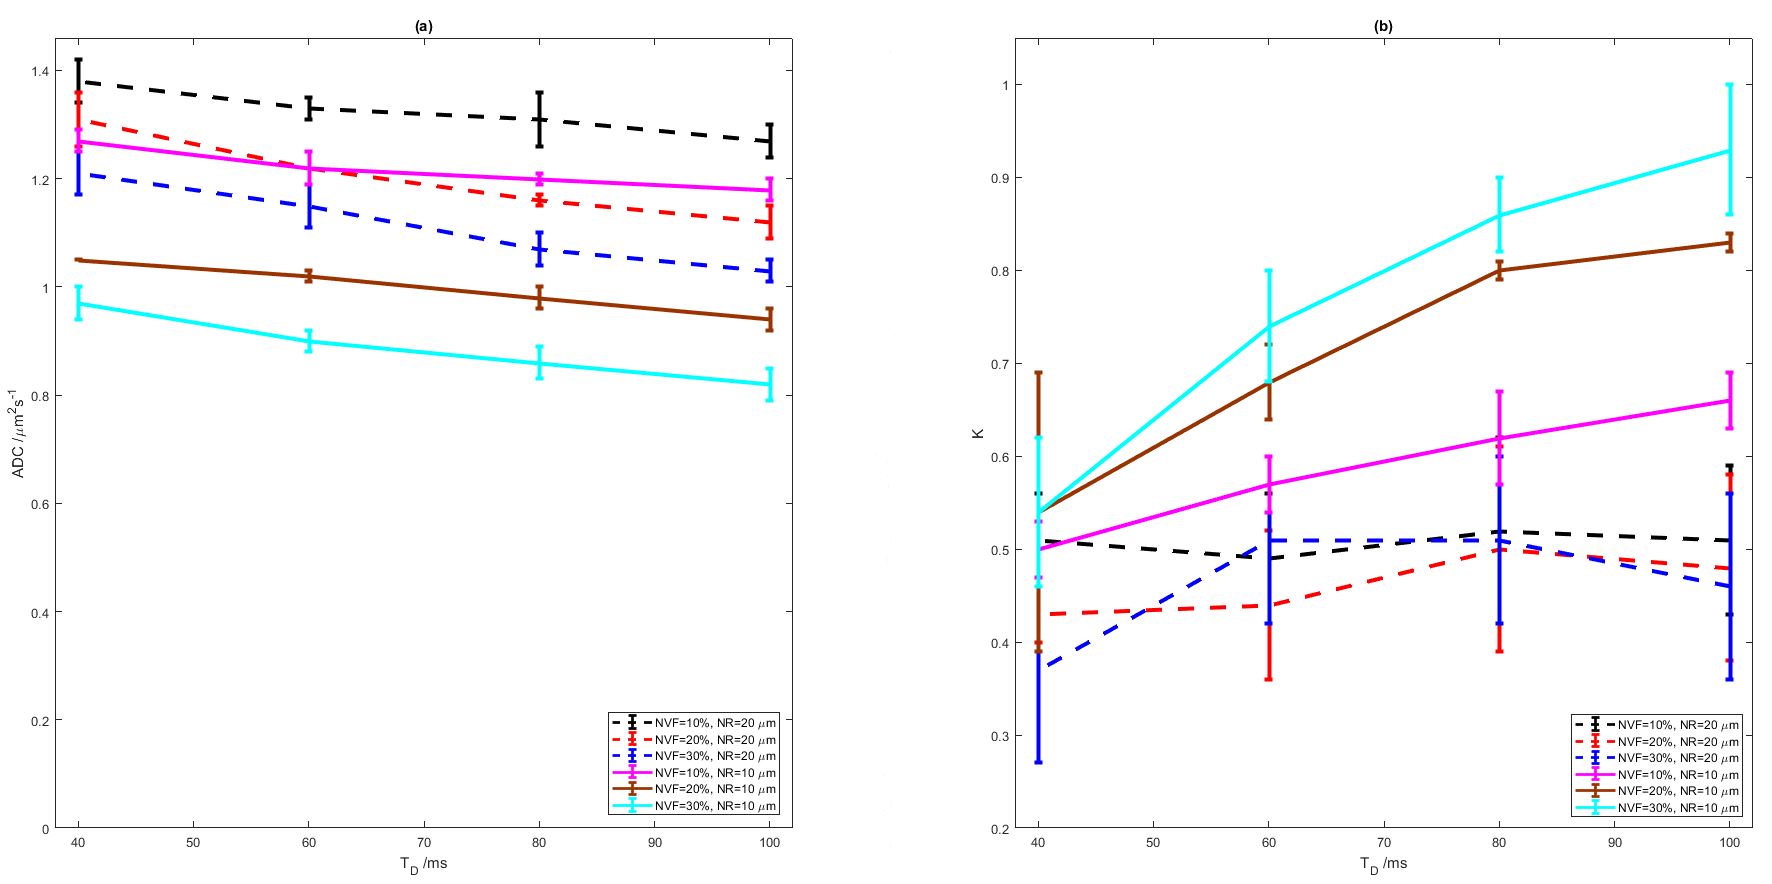
Figure 2 is a plot of D and K derived from simulation of the mixture of neurons, and glial cells mimicking layers II, and III of the visual cortex. The indirect (first) simulation method was used to reconstruct this geometry. For ADC, over diffusion times there is a near uniform ADC decrease for decreasing cell size and for increasing cell density (neuronal volume fraction, NVF). K better distinguishes cell sizes, especially for long diffusion times, where K increases with decreasing cell size.
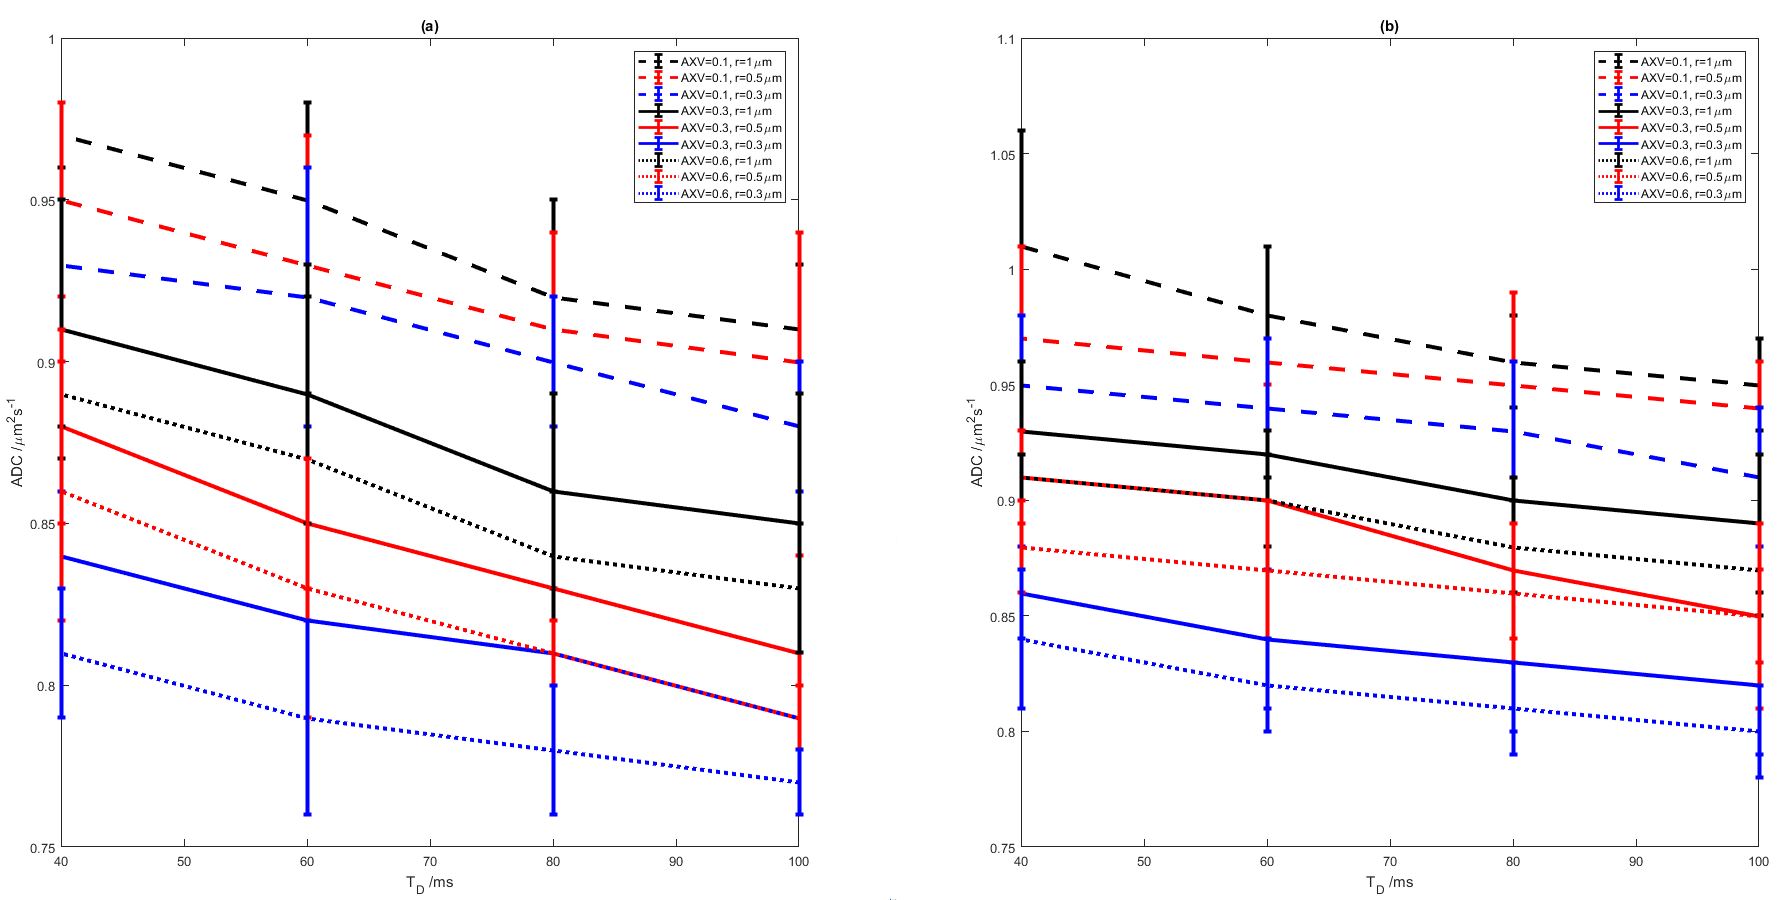
Figure 3 is a plot of ADC of myelinated and unmyelinated axons using the indirect (first) simulation method, with axonal sizes and densities close to the deep layers of the cortex. Variations of diffusion parameters over different diffusion times were small. This is because radii of axons are small and such differentiation could be improved only using ultra-short diffusion times which are generally infeasible for clinical studies.
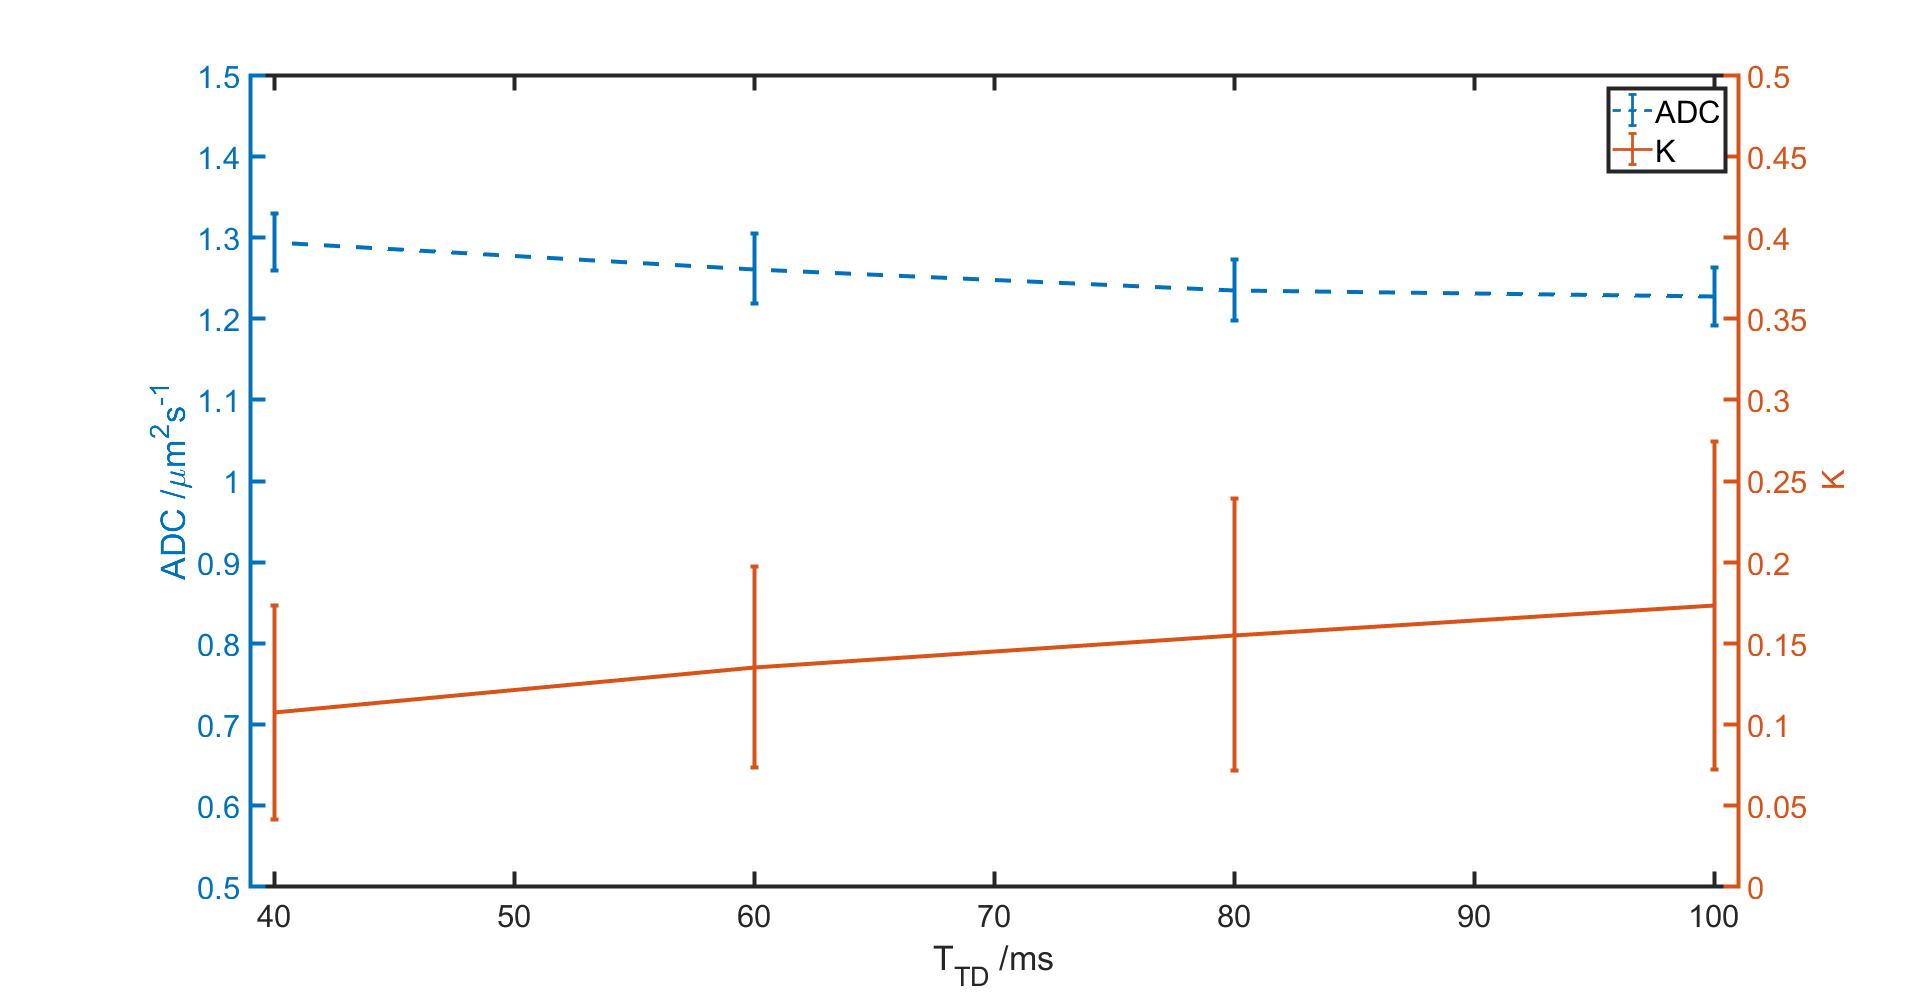
Fig. 4 is the measured ADC and K from the direct (second) diffusion simulation. With average volume fractions and morphology parameters outlined in figures 4 and 1, respectively, both of the direct and indirect simulation methods gave very similar ADC and K values.
Discussion
While the indirect method of reconstructing diffusion geometries is rather simplistic, it gives good estimates of the variations in diffusion derived parameters such as D, K with changes in tissue microstructure. The direct method is more physically realistic while equally fast and therefore the future method of choice. Both methods enable consideration of different cortical areas or layers. In the future libraries of three dimensional light microscopy data corresponding to different areas, layers, diseases, etc. would be available to directly simulate diffusion MRI signal. This could open possibilities of detecting cortical cytoarchitecture, i.e. cell body sizes and densities, with diffusion MRI.Acknowledgements
No acknowledgement found.References
1. De Calignon, A., Polydoro, M., Suárez-Calvet, M., William, C., Adamowicz, D. H., Kopeikina, K. J., Pitstick, R., Sahara, N., Ashe, K. H. & Carlson, G. A. Propagation of tau pathology in a model of early Alzheimer's disease. Neuron 73, 685-697 (2012).
2. Vrenken, H., Pouwels, P. J., Geurts, J. J., Knol, D. L., Polman, C. H., Barkhof, F. & Castelijns, J. A. Altered diffusion tensor in multiple sclerosis normal‐appearing brain tissue: Cortical diffusion changes seem related to clinical deterioration. JMRI 23, 628-636 (2006).
3. Maier, S. E. & Mulkern, R. V. Biexponential analysis of diffusion-related signal decay in normal human cortical and deep gray matter. Magnetic resonance imaging 26, 897-904 (2008).
4. Zhang, H., Schneider, T., Wheeler-Kingshott, C. A. & Alexander, D. C. NODDI: practical in vivo neurite orientation dispersion and density imaging of the human brain. Neuroimage 61, 1000-1016 (2012).
5. Beaujoin, J., Destrieux, C., Poupon, F., Zemmoura, I., Mangin, J. & Poupon, C. in Proc. Intl. Soc. Mag. Reson. Med. 0736.
6. Petrov, Y. Ellipsoid fit. MATLAB Central File Exchange, 24693 (2009).
7. Hildebrand, S., Schueth, A., Herrler, A., Galuske, R. & Roebroeck, A. Scalable cytoarchitectonic characterization of large intact human neocortex samples. bioRxiv, 274985 (2018).
8. Palombo, M., Alexander, D. C. & Zhang, H. A generative model of realistic brain cells with application to numerical simulation of diffusion-weighted MR signal. arXiv preprint arXiv:1806.07125 (2018).
9. Sousa, D., Borlinhas, F. & Ferreira, H. Estimation of breast tumour tissue diffusion parameters from histological images and Monte-Carlo simulations. Soc. Mag. Reson. Med. 24, 2474, doi:10.13140/RG.2.2.32262.06726 (2016).
10. Gilani, N., Malcolm, P. & Johnson, G. An improved model for prostate diffusion incorporating the results of Monte Carlo simulations of diffusion in the cellular compartment. NMR Biomed 30, doi:10.1002/nbm.3782 (2017).
11. Jensen, J. H., Helpern, J. A., Ramani, A., Lu, H. & Kaczynski, K. Diffusional kurtosis imaging: the quantification of non-gaussian water diffusion by means of magnetic resonance imaging. Magn Reson Med 53, 1432-1440 (2005).
12. Rocca, M., Ceccarelli, A., Falini, A., Tortorella, P., Colombo, B., Pagani, E., Comi, G., Scotti, G. & Filippi, M. Diffusion tensor magnetic resonance imaging at 3.0 tesla shows subtle cerebral grey matter abnormalities in patients with migraine. Journal of Neurology, Neurosurgery & Psychiatry 77, 686-689 (2006).
13. Van Cauter, S., Veraart, J., Sijbers, J., Peeters, R. R., Himmelreich, U., De Keyzer, F., Van Gool, S. W., Van Calenbergh, F., De Vleeschouwer, S. & Van Hecke, W. Gliomas: diffusion kurtosis MR imaging in grading. Radiology 263, 492-501 (2012).
14. Fox, R. J., Sakaie, K., Lee, J.-C., Debbins, J., Liu, Y., Arnold, D., Melhem, E., Smith, C., Philips, M. & Lowe, M. A validation study of multicenter diffusion tensor imaging: reliability of fractional anisotropy and diffusivity values. American Journal of Neuroradiology 33, 695-700 (2012).
Figures