3545
Surface-to-Volume ratio mapping using Oscillating Gradient Diffusion (OGSE) Spectroscopy for cancer characterization in the ex-vivo prostate1The University of New South Wales, Sydney, Australia, 2The University of Sydney, Sydney, Australia, 3Royal Prince Alfred Hospital, Sydney, Australia
Synopsis
This study investigates mapping of Surface-to-Volume (S/V) ratios from short diffusion time derived ADC maps to detect and characterize prostate cancer. ADC was mapped using a cos-OGSE DWI (fosc=50-200Hz) in one unfixed prostate (Gleason 4+4). Using a previously established model, S/V and free cytosol diffusivity (D0) maps were estimated by fitting the temporal behaviour of ADC. S/V and D0 were able to clearly and significantly separate the cancer and normal peripheral zone as indicated by a t-test and ROC curves. The geometrical nature of S/V may provide additional information to better characterize prostate cancer independent from diffusion related parameters.
Introduction
Mapping of restricted diffusion at short diffusion times shows promise to improve diagnostic sensitivity of DWI and it has been demonstrated that the selectivity of OGSE methods to this range may facilitate the detection of subtle subcellular changes that occur in the progression or treatment of cancer1,2. OGSE based diffusion spectroscopy also facilitates the extraction of interesting quantities such as surface-to-volume-ratio (S/V)3,4 that separate tissue topology from diffusion related parameters. These methods have a merit to become a powerful tool for tissue microstructure characterization and clinical diagnosis. In this study we investigate the value of mapping S/V ratios using OGSE for the detection of prostate cancer in unfixed radical prostatectomy samples using high resolution, high SNR pre-clinical MR data.Methods
An unfixed specimen from radical prostatectomy, histologically diagnosed with prostate cancer Gleason Score (4+4), was
prepared as described in Bourne et al.5 and imaged on a BioSpec Avance III 94/20 system equipped
with BGA-12S HP gradients (Gmax=660mT/m, dG/dtmax=4570Tm/s)
and 72-mm quad-RF-coil. Multiple DWI experiments were performed using an
in-house developed cos-OGSE sequence2 at 7 different oscillation
frequencies (50Hz-200Hz, Δf=25Hz) with 3 directions, 4 b-values
(200,400,600)+b0. General imaging parameters: TE=90ms, TR=2200ms, FoV:
4.5×4.5 cm, Matrix: 64×64, resolution: 700×700µm. Slice thickness: 2mm+2mm
gap, 7 slices, 2 averages. Tacq=42min. ADC maps were
calculated for each oscillation frequency by mono-exponential fitting S = S0×exp(-ADC×b)
to the geometric mean of the DWIs. The temporal ADC maps were normalized to the
free water diffusion coefficient of a reference
tube that was inserted into the urethra (D0=2.2mm2/ms, at 22°C) and fitted using the following model3:
$$$D_{g}(t)=D_{0}\left(1-\frac{c^{\prime}}{d}\left(\frac{S}{V}\right)\sqrt{D_{0}\Delta_{\mathrm{eff}}}\right)$$$ where $$$c^{\prime}=\frac{4\pi\cdot C\left(2N^{\frac{1}{2}}\right)+3\cdot S\left(2N^{\frac{1}{2}}\right)}{2\sqrt{2}\pi N},\Delta_{\mathrm{eff}}=\frac{9}{64f_{\mathrm{osc}}}$$$
N,f – OGSE number of periods and frequency; C,S – Cosine and Sine Fresnel Functions
In the fits for S/V and D0 quantification only frequencies 50Hz-175Hz were included as a small signal drop in the highest frequency was found, which can likely be attributed to limitations in our gradient system. After imaging and fixation, the prostate sample was sliced in exact alignment to the MRI for histological region determination. Mean values were statistically compared in cancer and peripheral zone ROIs and ROC for cancer detection was calculated
Results
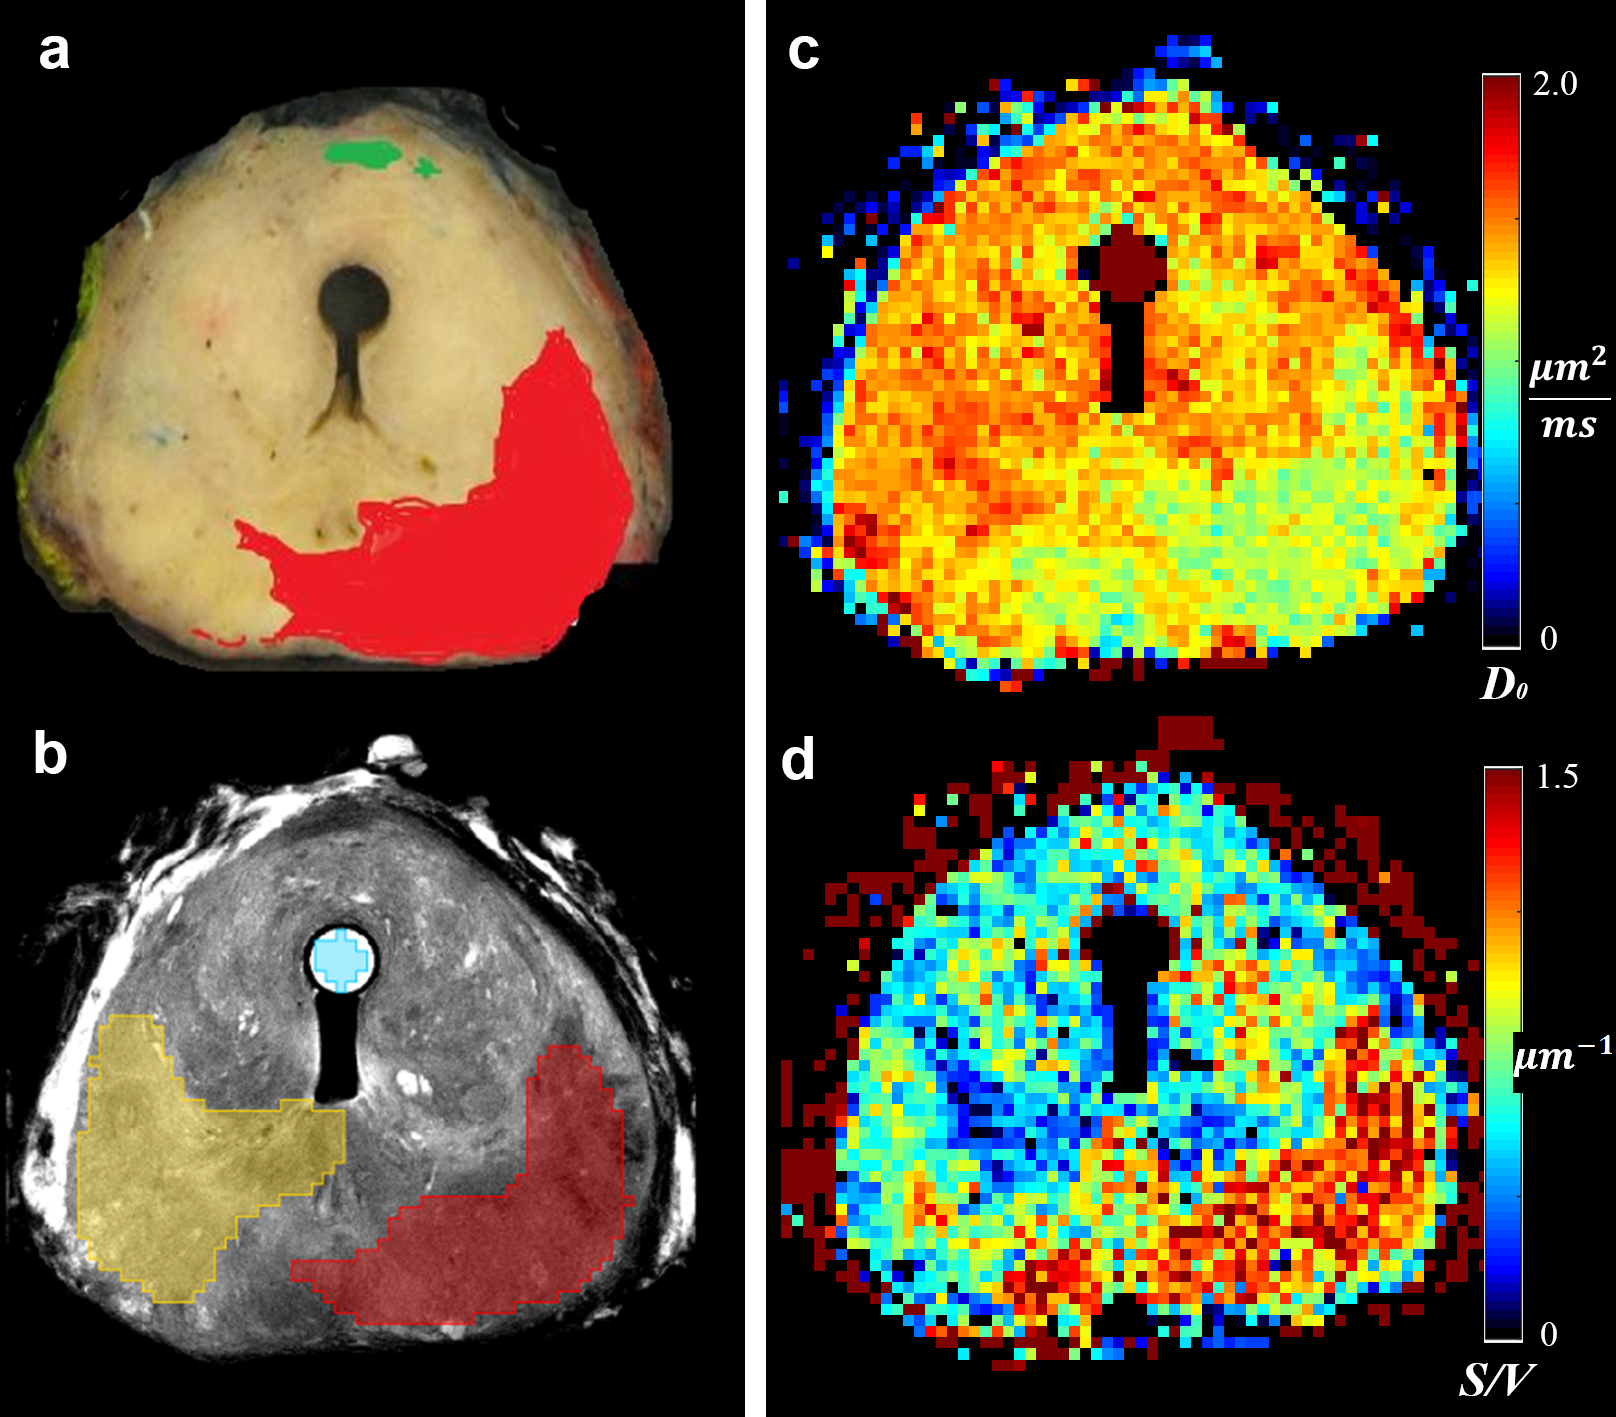
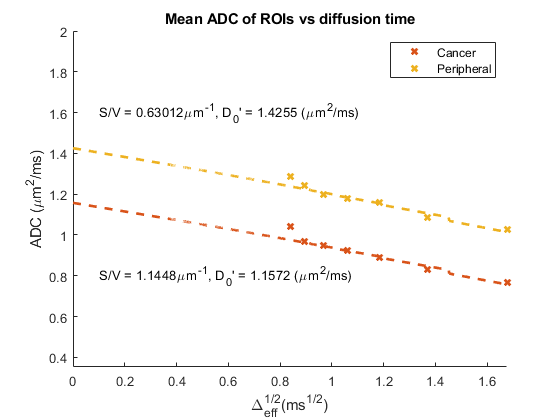
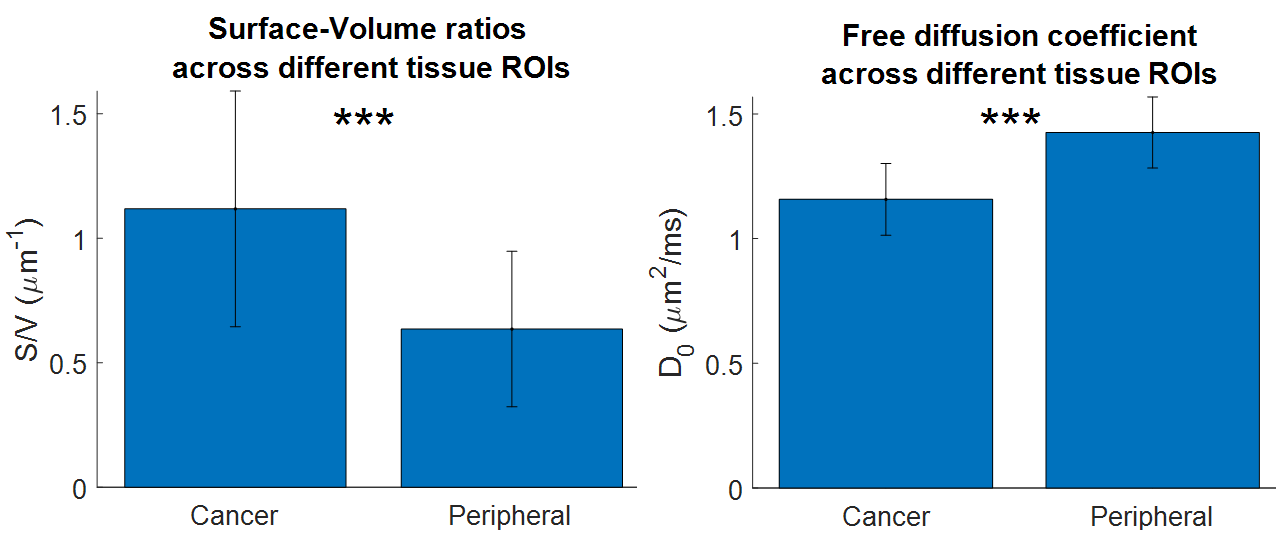
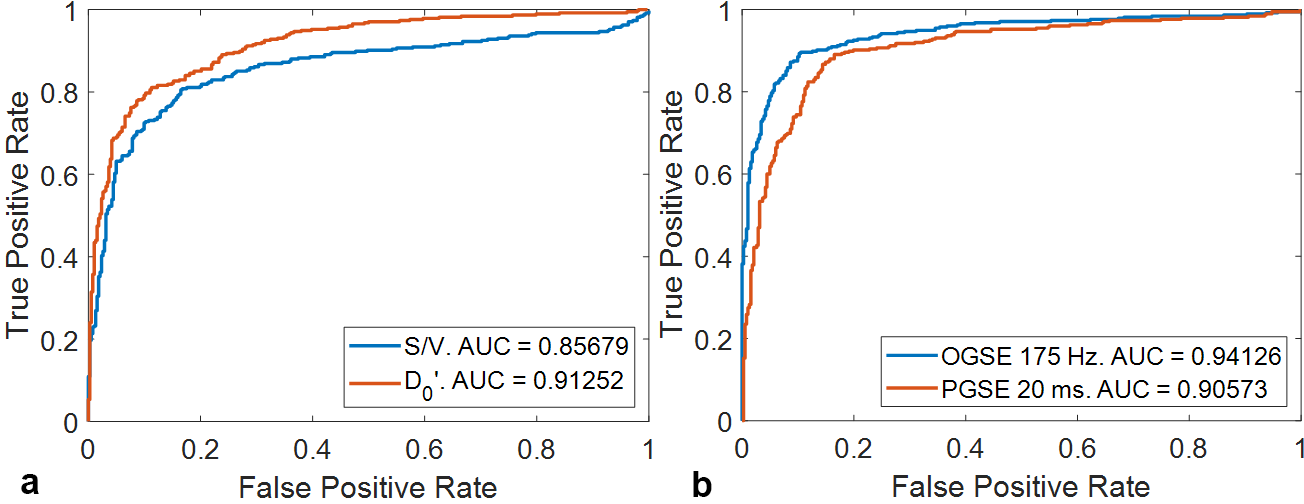
Fig.1 shows the D0 and S/V maps from the central slice of our ex-vivo prostectomy sample (c,d) together with the delineation of the Gleason 4+4 classified cancer region on the pathology section (a) and region definition on the T2w image (b). ADC vs sqrt(Δeff(t)) plots of the normalized ROI means are shown with the fitted model in Fig.2. Average D0 and S/V values were found to be D0,cancer=1.16μm2/ms, D0,peri=1.43μm2/ms and S/Vcancer=1.14μm-1, S/Vperi=0.63μm-1 in cancerous and normal peripheral zone tissue, respectively. Both mean ROI D0 and S/V are significantly (P<0.001) different between cancer and normal peripheral zone tissue (Fig.3). Sensitivity and specificity for cancer detection is shown in the ROC curves in Fig.4. The AUC(S/V)=0.86 and AUC(D0)=0.91 demonstrate a relatively clear separation between cancer and normal tissue in both maps. For comparison Fig.4 also presents corresponding ROC curves for cancer delineation directly from the ADC maps of OGSE at 175Hz (Δeff=1.4ms) and PGSE (Δeff=20ms). AUC values are comparable to those of the more advanced parameters. Due to the small sample size further samples will have to be investigated to establish a firmer statistical basis.Discussion
In our study we found a significant increase of S/V in prostate cancer (Gleason 4+4) relative to the normal peripheral zone. This correlates well with the clinical finding that epithelial cells proliferate and occupy a greater partial volume of tissue when cancer progresses. In our limited dataset it was possible to robustly delineate the cancer region on both, S/V and D0 maps. ROC analysis showed that S/V and D0 yield similar cancer discrimination ability as direct delineation on (OGSE and PGSE) ADC maps. As S/V directly reflects a purely geometric/topographic tissue property independent of any diffusion related parameters we anticipate that this surrogate marker may add valuable information to improve the characterization of microstructural changes during cancer progression and treatmentAcknowledgements
The authors would like to thank the facilities, scientific and technical assistance of the National Imaging Facility (NIF) at the UNSW Mark Wainwright Analytical Centre, Biological Imaging Resources Laboratory MRI facility.References
- Xu J, Does MD, Gore JC. Sensitivity of MR diffusion measurements to variations in intracellular structure: Effects of nuclear size. Magn Reson Med. 2009;61(4):828-833
- Bongers A, Hau E, Shen H. Short diffusion time diffusion-weighted imaging with oscillating gradient preparation as an early magnetic resonance imaging biomarker for radiation therapy response monitoring in glioblastoma: A preclinical feasibility study. Int J Radiation Oncol Biol Phys. 2018;102(4):1014-1023
- Sukstanskii AL. Exact analytical results for ADC with oscillating diffusion sensitizing gradients. J Magn Reson. 2013;234:135-140
- Reynaud O, Winters KV, Hoang DM et al. Surface-to-Volume ratio mapping of tumor microstructure using oscillating gradient diffusion weighted imaging. Magn Reson Med. 2016; 76:237-247
- Bourne RM, Bongers A, Chatterjee A et al. Diffusion anisotropy in fresh and fixed prostate tissue ex vivo. Magn Reson Med. 2016;76(2):626-634
Figures