3543
Estimation of Axon Conduction Delay, Conduction Speed, and Diameter from Information Flow using Diffusion MRI and MEG1Athena Project-Team, Inria, Université Côte d'Azur, Sophia Antipolis - Méditerranée, France
Synopsis
Information transmission delays in the brain are generated by the physical properties of axons, including their length and diameter. These delays have a range of a few milliseconds and can thus be observed in bioelectric recordings such as electroencephalography and magnetoencephalography (MEG). In this work, we present a novel algorithm to estimate axon diameters from diffusion MRI and MEG. This approach identifies information flow between cortical regions using a model where transmission delays are parameters. The delays which maximize information transfer are identified and, using streamline length obtained through tractography, are then converted to axon diameters. We present results obtained on four subjects of the Human Connectome Project.
Introduction
Information transmission delays in the brain are generated by the physical properties of axons, including their length and diameter. These delays, which are believed to be essential to brain dynamics1, have a range of a few milliseconds and can thus be observed in bioelectric recordings such as electroencephalography and magnetoencephalography (MEG). Some local properties of axons can be quantified using diffusion magnetic resonance imaging (MRI). For example, the length of axons, or more precisely the distance between cortical regions along the white matter, can be readily quantified using tractography. On the other hand, while many techniques and models have been developed to estimate axon diameter using diffusion MRI, accurate in vivo estimation of small axon diameters remains challenging.
We propose a new method to estimate axon diameters, conduction delays, and speed from diffusion MRI and MEG. Briefly, our approach attempts to identify information flow between cortical regions where transmission delays are parameters of the model. The delays which maximize information transfer are identified and, using streamline length obtained through tractography, are then converted to axon diameters.
Methods
As stated previously, our estimation of the axon diameter $$$d$$$ relies on its relation with the conduction velocity $$$v$$$, the axon length $$$\ell$$$, and the conduction delay $$$s$$$. We make use of the linear relationship between diameter and velocity identified by Hursh2 where $$$v = 6d$$$. Assuming a constant diameter along axons yields a relation between the information conduction delay $$$s$$$ and the axon diameter which is $$$d = \ell(6s)$$$. To compute the diameter, we propose to estimate the conduction delay using Connectivity Informed Maximum Entropy on the Mean (CIMEM)3,4 and the axon length using diffusion MRI tractography. Results illustrating the ability of CIMEM to estimated delays on simulated data were previous published5. Briefly, CIMEM estimates delays by building a Bayesian network containing the structural connections between cortical regions which are either active or inactive. MEG signals are then used as evidence into this network to compute the posterior probability of a connection being active at a particular time. Let $$$Z(C_{i,n} )$$$ be the posterior probability that the $$$i^\textrm{th}$$$ connection is active at the $$$n^\textrm{th}$$$ time point. We define the connectivity power of the $$$i^\textrm{th}$$$ connection as $$\Gamma_s(C_i) = N^{-1}\sum_{n=0}^{N-1}Z(C_{i,n} )^2$$ for a given delay $$$s$$$. The connectivity power is then computed for a series of delays and the estimated delay for a given connection is the one that maximizes $$$\Gamma_s (C_i)$$$, thereby maximizing information flow.
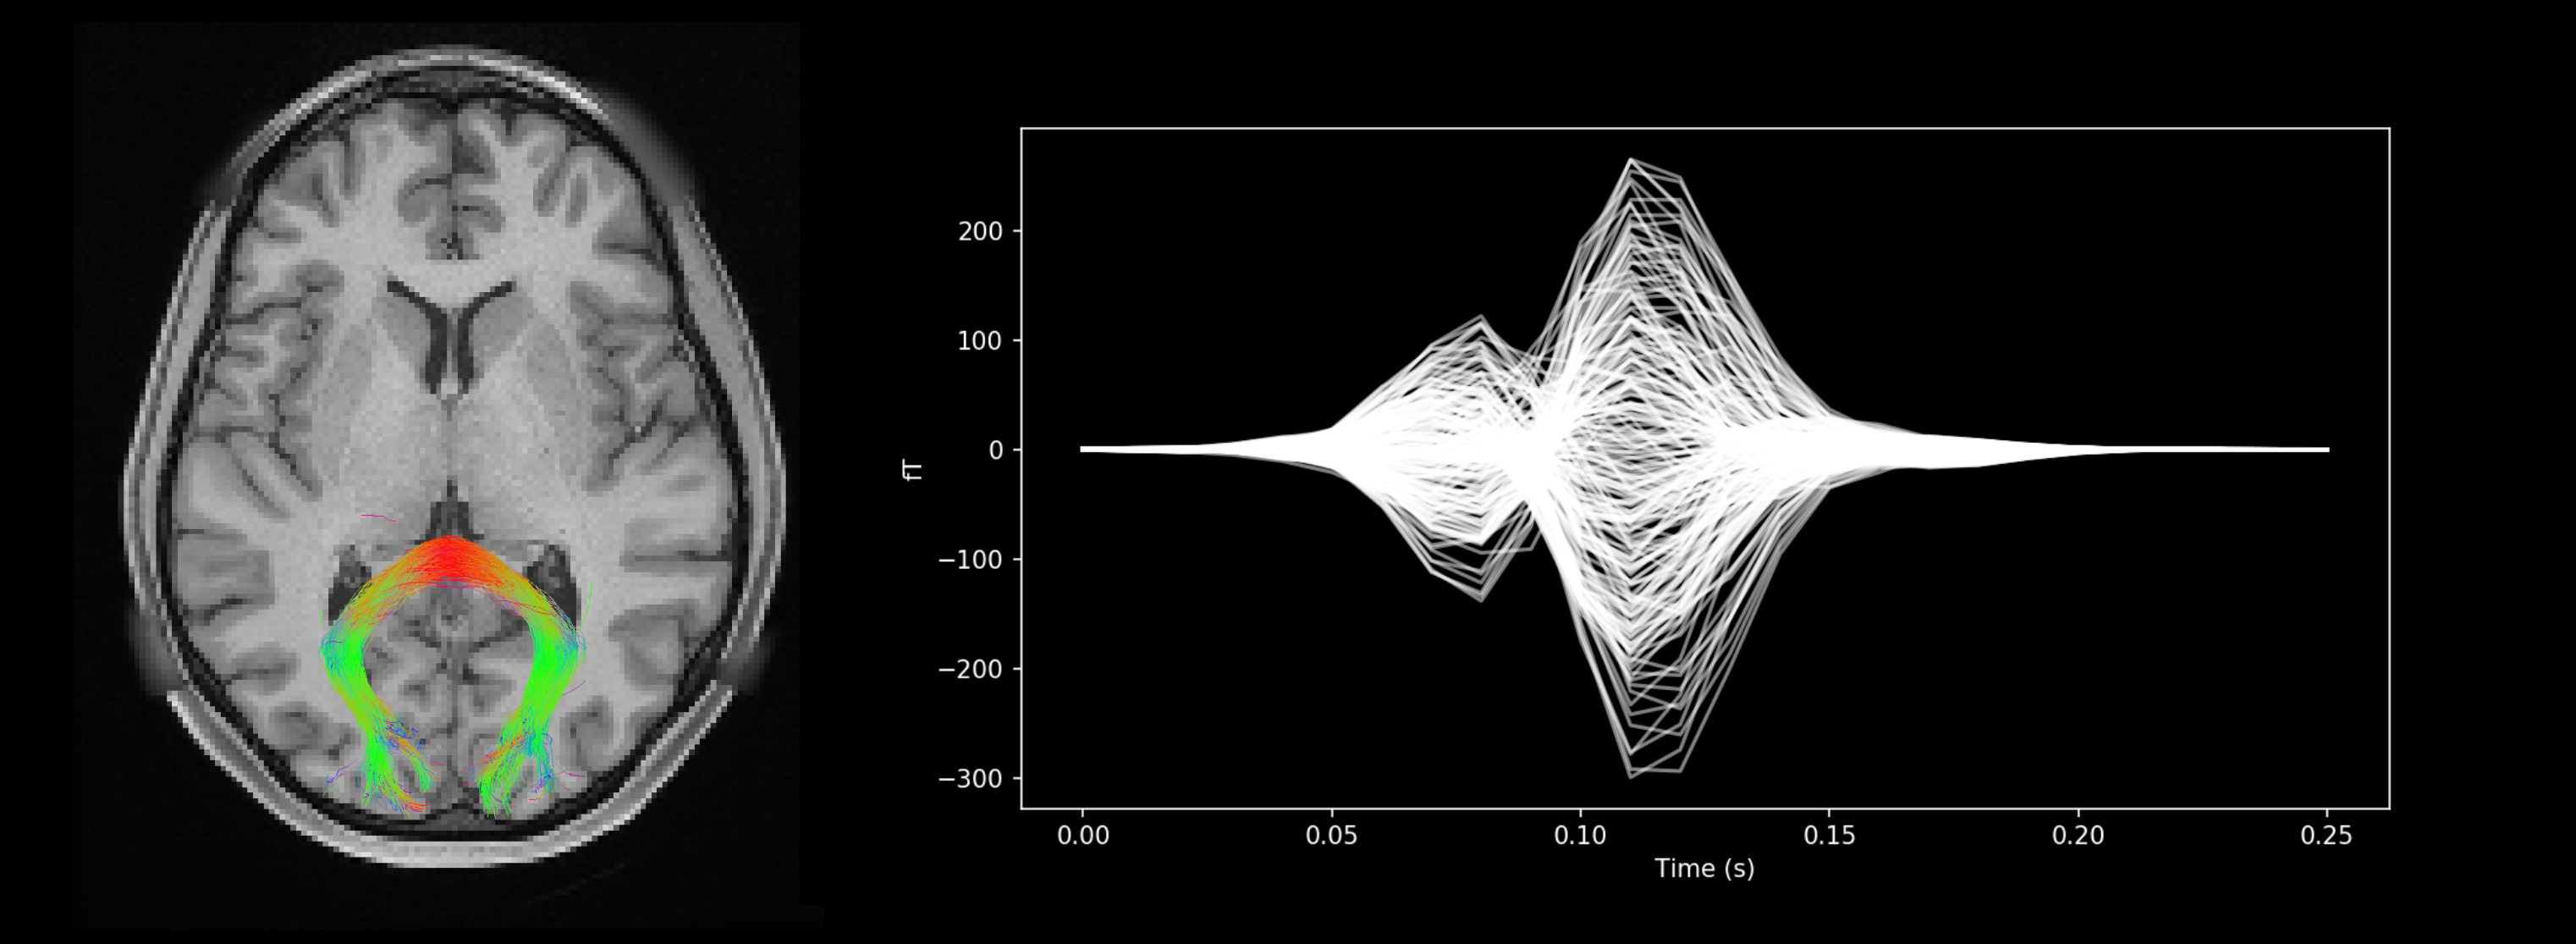
The axon diameter in the splenium of the corpus callosum was estimated for four subjects of the Human Connectome Project (HCP) (109123, 191841, 140117, and 581450). Using the preprocessed diffusion MRI data provided by the HCP, fiber
orientation distribution functions were fitted using constrained spherical deconvolution and a maximum order
spherical harmonic order of 8. Streamlines were generated using
probabilitistic anatomically constrained particle filter tractography6.
The streamlines connecting the lateral occipital regions were
identified and their mean length was used as $$$\ell$$$. Using the motor task MEG data, all data blocks starting with a visual cue were selected, regardless of the following movement. The rationale is that the visual stimulus will generate information transfer between the occipital hemispheres through the splenium of the corpus callosum after a delay of 50 to 200 ms. The MEG data was formatted using MNE-HCP (https://github.com/mne-tools/mne-hcp) and the processing was performed using MNE-python 7,8. The epochs were averaged to produce an evoked potential, which was lowpass filtered at 50 Hz and resampled at 100 Hz. The data was multiplied by a Gaussian with a mean of 0.1 and standard deviation 0.033 to damp signals outside of the window of interest. This data was then used as input to CIMEM while modeling a a single connection between the lateral occipital regions. The delay associated with this connection was varied to probe axon diameters from 0.1 to 2.5 $$$\mu m$$$.
Results
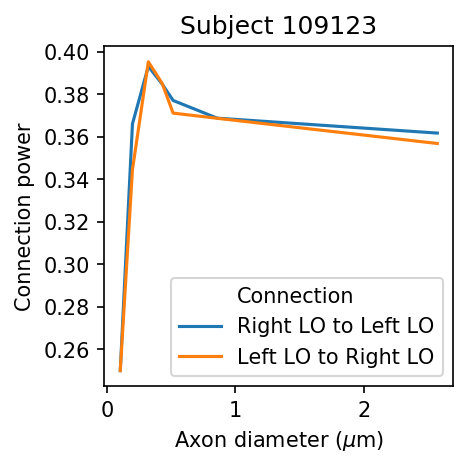
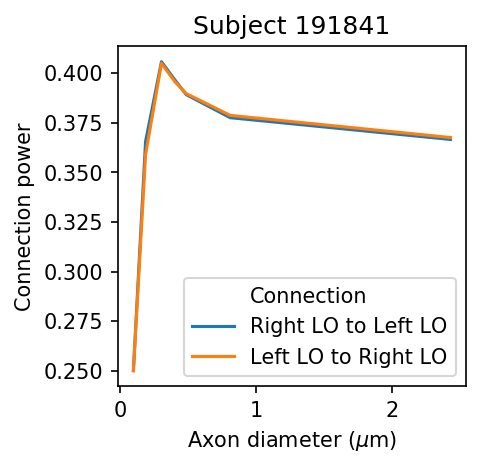
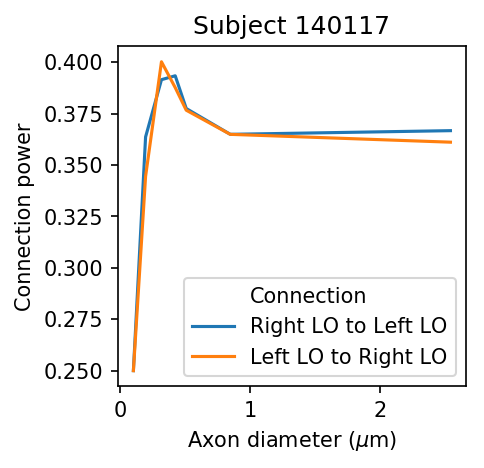
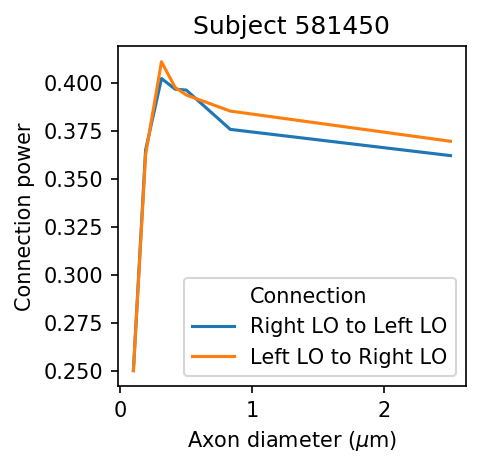
The mean streamline length obtained for the 4 subjects was 154.3, 146.0, 152.3, and 151.2 mm. The connection power $$$\Gamma_s$$$ as a function of the axon diameter is illustrated in Figures 1 to 4. For all subjects, the curve shows a consistent and clear peak which occurs in between 0.3 and 0.42 $$$\mu m$$$. This peak corresponds to the estimated mean axon diameter used to transfer information between the lateral occipital regions.Discussion
We have presented a new method to estimate axon diameters, conduction delays, and conduction speeds using diffusion MRI and MEG. In comparison to other work9 relating diameter to conduction delays, our approach is the first to actively model information flow to estimate delays.Acknowledgements
This work has received funding from the European Research Council (ERC)under the European Union’s Horizon 2020 research and innovation program(ERC Advanced Grant agreement No 694665 : CoBCoM - Computational BrainConnectivity Mapping).
Data were provided by the Human Connectome Project (HCP), WU-Minn Consortium (Principal Investigators: David Van Essen and Kamil Ugurbil; 1U54MH091657) funded by the 16 NIH Institutes and Centers that support the NIH Blueprint for Neuroscience Research; and by the McDonnell Center for Systems Neuroscience at Washington University.
References
1. R. Caminiti, F. Carducci, C. Piervincenzi, A. Battaglia-Mayer, G. Confalone,F. Visco-Comandini, P. Pantano, and Innocenti G. M. Diameter, length, speed, and conduction delay of callosal axons in macaque monkeys and humans: Comparing data from histology and magnetic resonance imaging diffusion tractography. The Journal of Neuroscience, 33(36):14501-14511, 2013.
2. J. B. Hursh. Conduction velocity and diameter of nerve fibers. American Journal of Physiology, 127(1):131–139, 1939.
3. S. Deslauriers-Gauthier, J. M. Lina, R. Butler, P. M. Bernier, K. Whittingstall, R. Deriche, and M. Descoteaux. Inference and Visualization of Information Flow in the Visual Pathway using dMRI and EEG. In MICCAI 2017 Medical Image Computing and Computer Assisted Intervention, 2017.
4. S. Deslauriers-Gauthier, J. M. Lina, R. Butler, P. M. Bernier, K. Whittingstall, R. Deriche, and M. Descoteaux. White Matter Information Flow Mapping from Di usion MRI and EEG. Submitted.
5. S. Deslauriers-Gauthier and R. Deriche. Estimation of Axonal Conduction Speed and the Inter Hemispheric Transfer Time using Connectivity Informed Maximum Entropy on the Mean. SPIE Medical Imaging, 2019.
6. G. Girard, K. Whittingstall, M. Deriche, R. Descoteaux, Towards quantitative connectivity analysis: reducing tractography biases, NeuroImage 98 (2014) 266-278.
7. A. Gramfort, M. Luessi, E. Larson, D. Engemann, D. Strohmeier, C. Brodbeck,R. Goj, M. Jas, T. Brooks, L. Parkkonen, and M. Hämäläinen. MEG andEEG data analysis with MNE-Python. Frontiers in Neuroscience, 7, 2013.
8. A. Gramfort, M. Luessi, E. Larson, D. Engemann, D. Strohmeier, C. Brodbeck,L. Parkkonen, and M. Hämäläinen. MNE software for processing MEG andEEG data. NeuroImage, 86:446-460, 2014.
9. A. Horowitz, D. Barazany, I. Tavor, M. Bernstein, G. Yovel, and Y. Assaf. In vivo correlation between axon diameter and conduction velocity in the human brain. Brain Struct Funct, 220:1777-1788, 2015.
Figures