3538
An observational study on the diffusion time and field strength dependency of the diffusion coefficient in human white matter1Institute of Radiology, University Hospital Erlangen, Friedrich-Alexander-Universität Erlangen-Nürnberg (FAU), Erlangen, Germany, 2Department of Psychiatry, Brigham and Women's Hospital, Harvard Medical School, Boston, MA, United States, 3Department Medical Physics in Radiology, German Cancer Research Center (DKFZ), Heidelberg, Germany, 4CUBRIC, School of Psychology, Cardiff University, Cardiff, United Kingdom, 5Joint Department of Physics, The Institute of Cancer Research and The Royal Marsden NHS Foundation Trust, London, United Kingdom, 6Center for Medical Physics and Engineering, Friedrich-Alexander-Universität Erlangen-Nürnberg (FAU), Erlangen, Germany
Synopsis
Signal dependence on diffusion time has been reported in various tissues and has been connected to cellular restrictions. It is conceivable, however, that it partly originates from relaxation weightings of different compartments. In this study, we investigate the diffusion time dependence of the diffusion tensor in brain tissue at 1.5 T, 3 T and 7 T using a stimulated echo sequence. The results show clear time dependencies of axial and radial diffusivity. 7 T data show a reduction of both diffusivities, indicating a non-negligible role of compartmental relaxation weighting effects.
Introduction
Diffusion time-dependence has been measured in many studies and is commonly interpreted as a consequence of cellular restrictions 1. Oftentimes used STimulated Echo Acquisition Mode (STEAM) sequences could potentially introduce a T1 weighting effect due to varying mixing times TM, associated with diffusion time Δ. As shown in recent studies, TE variation can cause measurement of decreased diffusivities due to compartmental T2 differences 2,3. It may be assumed that a similar effect with respect to T1 is present in STEAM sequences. It is well known that T1 relaxation times depend on the field strength B0 4. Given that the T1-B0 dependency of organs is quite different, it appears reasonable to assume that sub-compartments in a tissue experience a different T1-B0 dependency, which would give rise to a dependency of measured D(Δ) curves on B0. Measuring D(Δ) at different B0, the purpose of this study was to examine whether the shape of D(Δ) curves in white matter can be attributed solely to restrictions or whether T1 effects have a non-negligible effect.Methods
Data were
acquired using an in-house developed STEAM EPI sequence at B0 = 1.5 T, 3 T, and
7 T (Magnetom Aera XQ, Magnetom Skyra Fit, and Magnetom Terra, Siemens
Healthcare GmbH, Erlangen, Germany). The brains of 6 healthy volunteers (3
females, 3 males, 24 to 30 years old) were measured with the following
parameters:
b = 50
s/mm2 and 500 s/mm2, 20 diffusion directions, 7 axial slices, voxel size of 2
mm x 2 mm x 4 mm, field of view of 240 mm x 240 mm, ten diffusion times Δ = TM
+ 27 ms = {35, 60, 100, 150, 210, 280, 360, 440, 520, 600} ms, δ ≅ 14.66 ms, TE = 57 ms, TR = 5 s, bandwidth 1544 Hz/px, GRAPPA with
acceleration factor 2 and 24 reference lines, phase partial Fourier factor
0.75.
Gibbs-ringing
was reduced using the vendor-provided “raw filter” option of “medium” strength.
All diffusion weighted images were affinely registered using Elastix 4.800 5.
Diffusion tensor reconstruction was performed voxelwise using the
Multidimensional Diffusion MRI analysis framework 6 in Matlab R2017b
(The MathWorks Inc., Natick, MA) independently for each diffusion time. Outputs
included the axial diffusivity AD and radial diffusivity RD. Subcortical gray
matter (SGM) and four white matter regions including Corpus callosum Genu
(CCG), Corpus callosum Splenium (CCS), Corona radiata superior (CRS), and
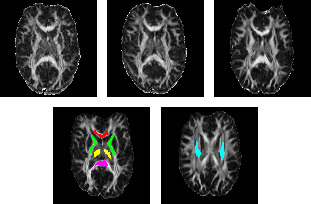
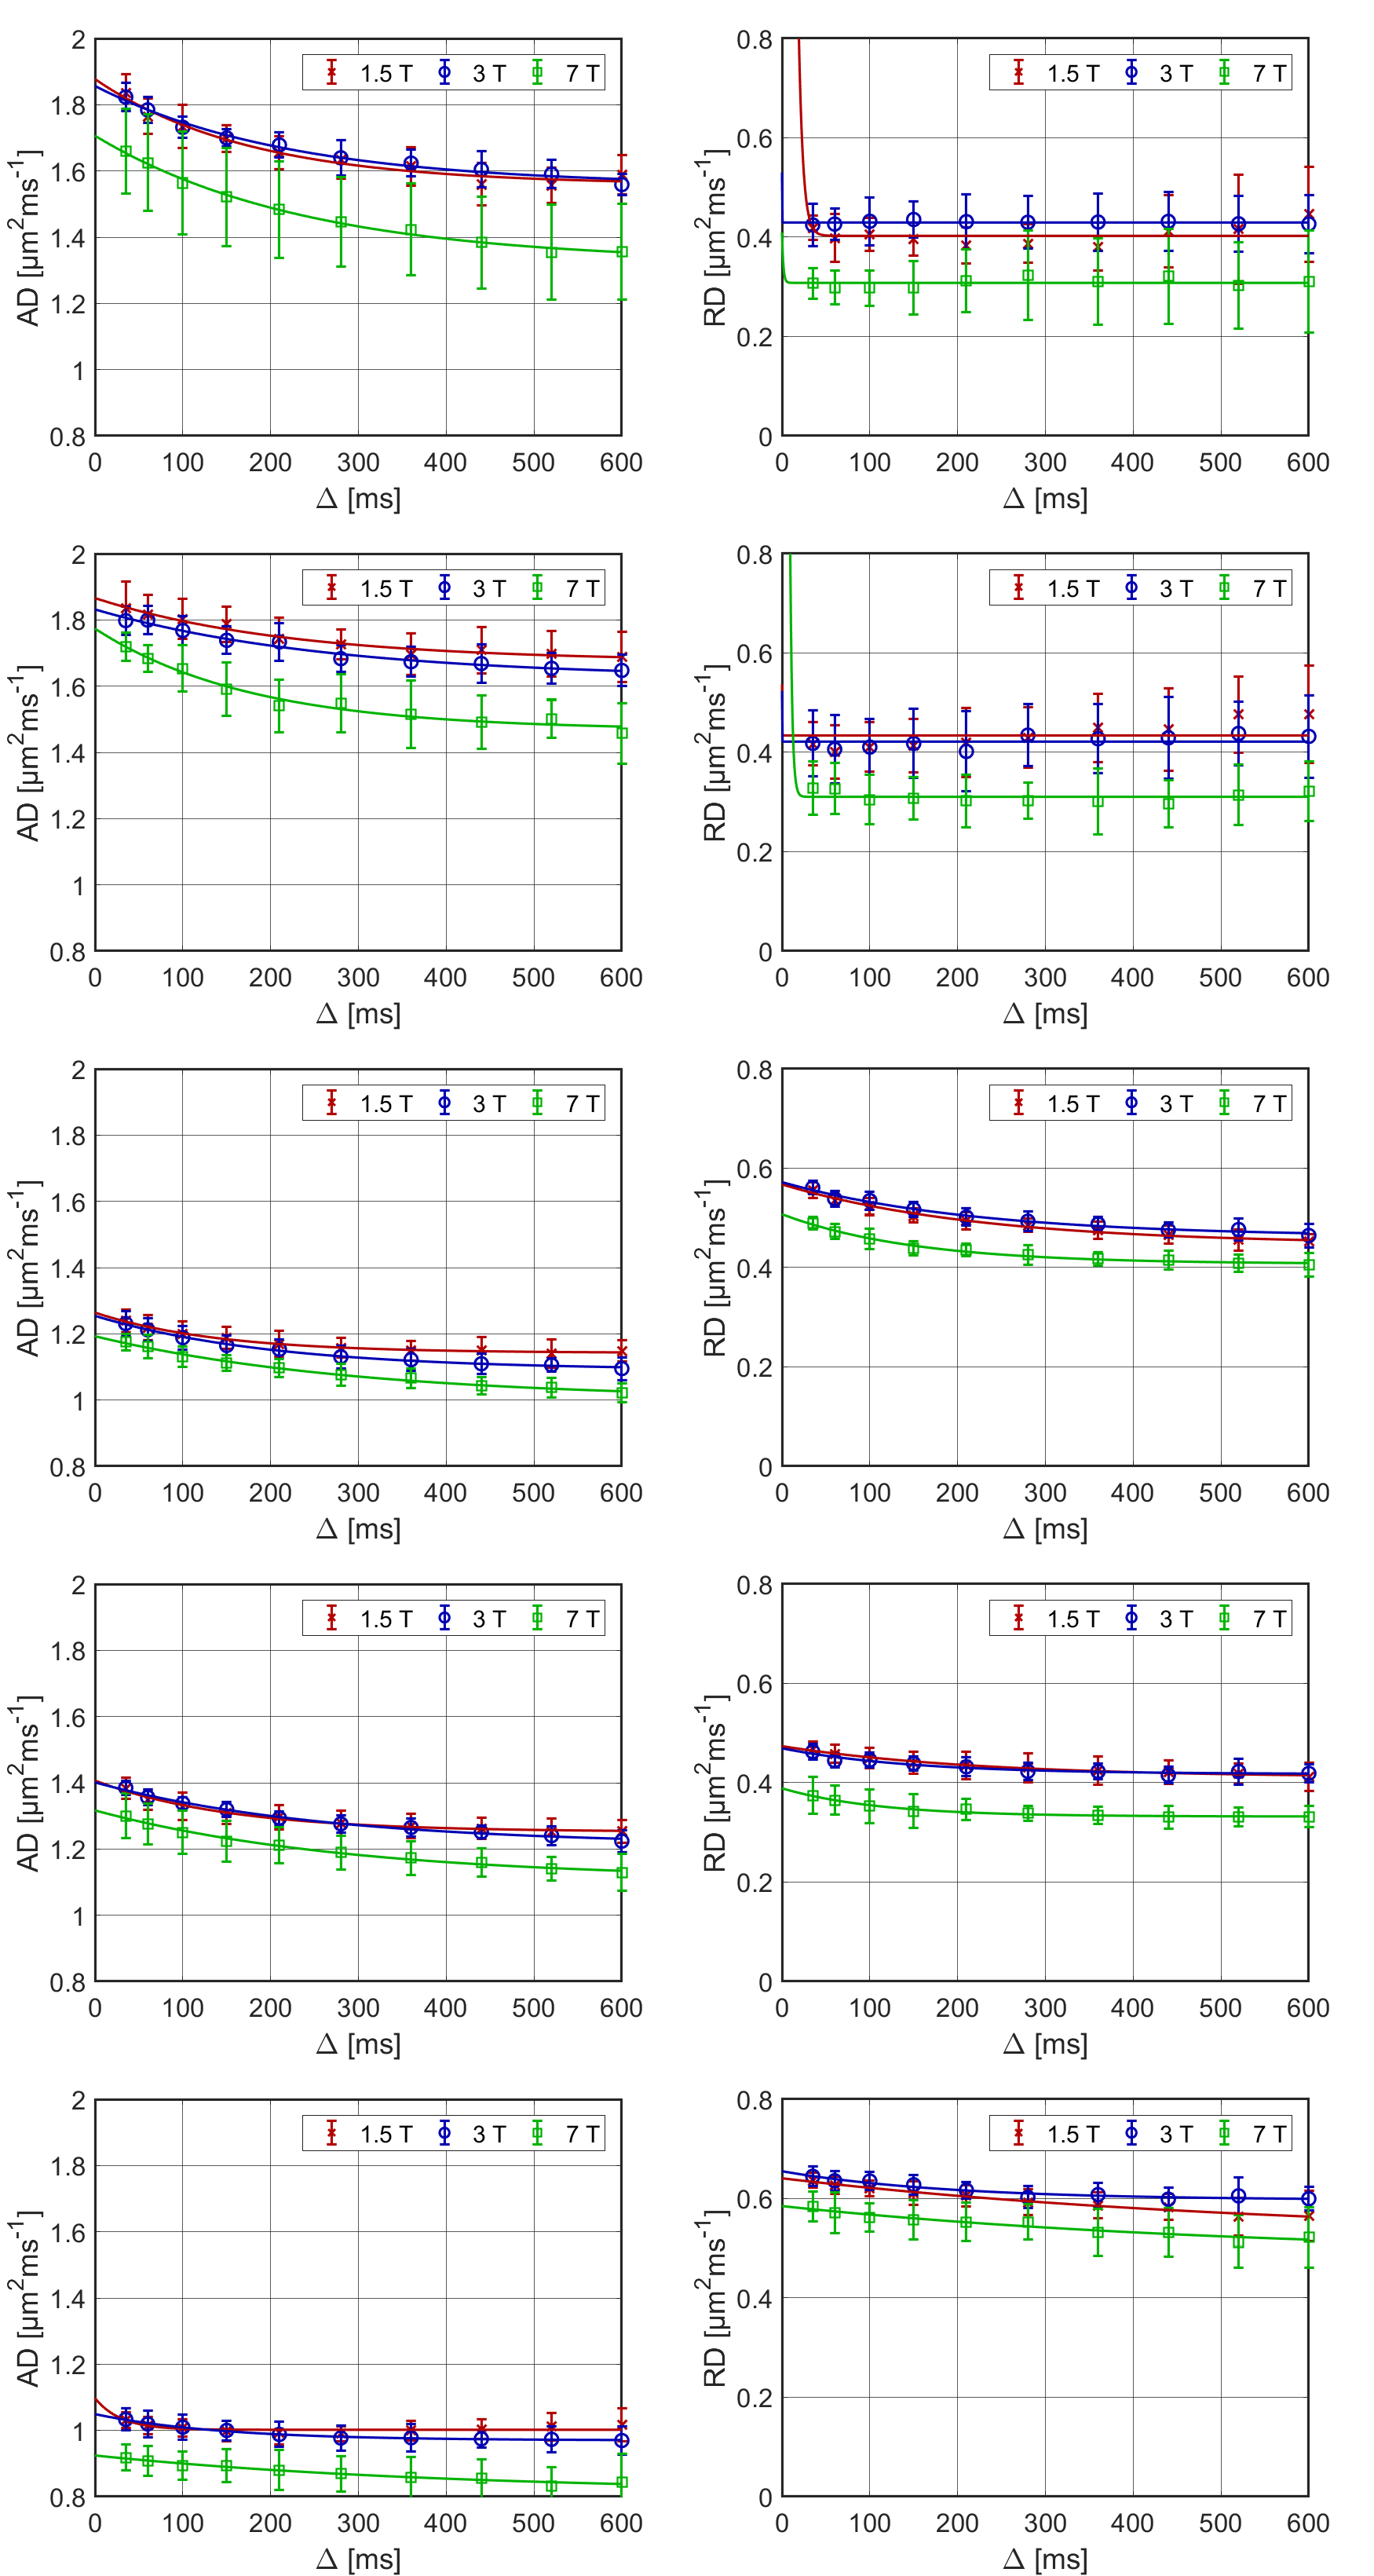
Internal Capsule (IC) were manually segmented, as shown in Fig. 1. The AD(Δ)
and RD(Δ) curves were fitted with the representation D(Δ) = D∞ + c1*exp(-c2*Δ).Results
Figure 1 shows representative FA maps of one volunteer obtained at the three field strengths. Figure 2 shows the dependency of AD and RD on Δ. In the CC, AD was clearly decreasing with time, but RD was rather constant. In all other ROIs, a noticeable time-dependency of both AD and RD was observed. AD and RD were almost identical at 1.5 T and 3 T, but, at 7 T, lower values were observed for all considered regions and at all times.Discussion
We observed a difference of measured diffusivities between 7 T and the two lower field strengths, which indicates that weighting effects of sub-compartments are not negligible in STEAM diffusion exams of gray and white matter. Constant curve separations could be explained by different T2-weighting, while time-dependent changes of curve separations could indicate T1-effects. It thus appears reasonable to attribute individual weighting factors exp(-TE/T2)exp(-Δ/T1) to sub-compartments if one aims at using a two- or multi-compartment model. The functional shape of our D(Δ) curves is in good agreement with those presented by Fieremans et al. 7 at 3 T and we observed similar RD, but somewhat larger AD values, potentially due to a different TE. A limitation of this study was that the scanner with the weakest specifications determined the parameter space, e.g. shorter mixing times could have been sampled with the 80 mT/m gradient system of the Terra scanner.Conclusion
The diffusion coefficient of white matter measured with a STEAM sequence depended on B0 indicating that both T1 and T2 weighting effects are important for data interpretation.Acknowledgements
We thank the Imaging Science Institute (Erlangen, Germany) for providing us with measurement time. Financial support by the Deutscher Akademischer Austauschdienst (DAAD), the Fonds Hochschule International (FHI) and the Deutsche Forschungsgemeinschaft (DFG LA 2804/6-1) is gratefully acknowledged.References
[1] Burcaw LM, Fieremans E, Novikov DS. Mesoscopic structure of neuronal tracts from time-dependent diffusion. NeuroImage, 2015;114:18–37.
[2] Veraart J, Novikov DS, Fieremans E. TE dependent Diffusion Imaging (TEdDI) distinguishes between compartmental T2 relaxation times. NeuroImage 2017.
[3] Lin M, He H, Tong Q, Ding Q, Yan X, Feiweier T, Zhong J. Effect of myelin water exchange on DTI-derived parameters in diffusion MRI: Elucidation of TE dependence. Magn Reson Med 2018;79(3):1650-1660.
[4] Stanisz GJ, Odrobina EE, Pun J, Escaravage M, Graham SJ, Bronskill MJ, Henkelman RM. T1, T2 relaxation and magnetization transfer in tissue at 3T. Magn Reson Med 2005;54(3):507-512.
[5] Klein S, Staring M, Murphy K, Viergever MA, Pluim JPW. Elastix: a toolbox for intensity-based medical image registration. IEEE Trans Med Imag, 2010;29(1):196–205.
[6] Nilsson M, Topgaard D, Samo L, Westin C-F. Multidimensional Diffusion MRI analysis framework (MD-MRI) v2017/12/27, https://github.com/markus-nilsson/md-dmri/; 2017 [accessed 05 January 2018].
[7] Fieremans E, Burcaw LM, Lee H-H, Lemberskiy G, Veraart J, Novikov DS. In vivo observation and biophysical interpretation of time-dependent diffusion in human white matter. NeuroImage 2016;129:414-427.
Figures