3535
What are the consequences of ignoring non-Gaussian diffusion in models of convection-enhanced drug delivery to the human brain?1Medicine, Cardiff University, Cardiff, United Kingdom, 2Psychology, Cardiff University, Cardiff, United Kingdom, 3Huntington's Disease Centre, UCL, London, United Kingdom, 4Psychology, Australian Catholic University, Melbourne, Australia
Synopsis
Convection-enhanced drug delivery to the human brain is a promising method for treating neurodegenerative diseases and brain tumors. Accurate predictions of the drug concentration via computational fluid dynamics models are essential, and models not accounting for diffusion non-Gaussianity give predictions that are not in good enough agreement with experimental results. We use a fluid dynamics model recently presented in the literature, which accounts for diffusion non-Gaussianity, to calculate the differences with models that do not account for it, in data from pre-symptomatic Huntington’s disease patients and metastatic brain tumor patients. We make recommendations on the use of fluid dynamics models in the clinical setting.
Introduction
Convection-enhanced drug delivery (CED)1,2 is a promising method of drug delivery to the human brain, during which the drug is infused directly into brain tissue through implanted catheters. Computational fluid dynamics (CFD) models3,4,5,6,7 use individual-participant brain microstructural information, obtained non-invasively through diffusion MRI, to predict the drug distribution and inform the catheter setup, so that the drug covers the pathology of interest while minimizing dosage to healthy brain tissue. CFD models that use the diffusion tensor, and therefore disregard diffusion non-Gaussianity, give predictions that differ significantly from experimental observations8 . Using a recently developed CFD model,9 which uses the full diffusion propagator and thus includes diffusion non-Gaussianity in brain tissue, we calculate the differences in the drug concentration from models that disregard diffusion non-Gaussianity, and quantify them with individual-participant simulations for pre-symptomatic Huntington’s (pre-HD) patients (i.e. patients exhibiting psychiatric and cognitive, but not motor, deficits) and for metastatic brain tumor (MBT) patients.Theory
Fluid dynamics theory predicts9 that the difference in drug concentration $$$\Delta C$$$ between models that include diffusion non-Gaussianity and those that do not evolves with time $$$t$$$ as:
$$\varphi \frac{ \partial( \Delta C)}{\partial{t}} + \nabla \cdot \Big ( \textbf{v}_\textrm{R} \Delta C \Big ) -\nabla \Big [ \varphi \textbf{R} \cdot \nabla( \Delta C) \Big ] = - \nabla \cdot \Big ( \Delta \textbf{v} \cdot C_\textrm{D} \Big ) + \nabla \cdot \Big [ \varphi( \textbf{R} - \textbf{D} ) \cdot \nabla C_\textrm{D} \Big ].$$
$$$\textbf{D}$$$ is the diffusion
tensor, $$$\textbf{R}$$$ the diffusion-displacement tensor incorporating the
diffusion propagator10 , $$$\varphi$$$ the porosity, $$$C$$$ the drug concentration
and $$$\textbf{v}$$$ the drug velocity. The subscripts R and D indicate quantities derived using
the $$$\textbf{R}$$$ and $$$\textbf{D}$$$ tensors respectively. The complex dependence of $$$\Delta C$$$ on several parameters necessitates individual-participant simulations in order to quantify it.
Methods
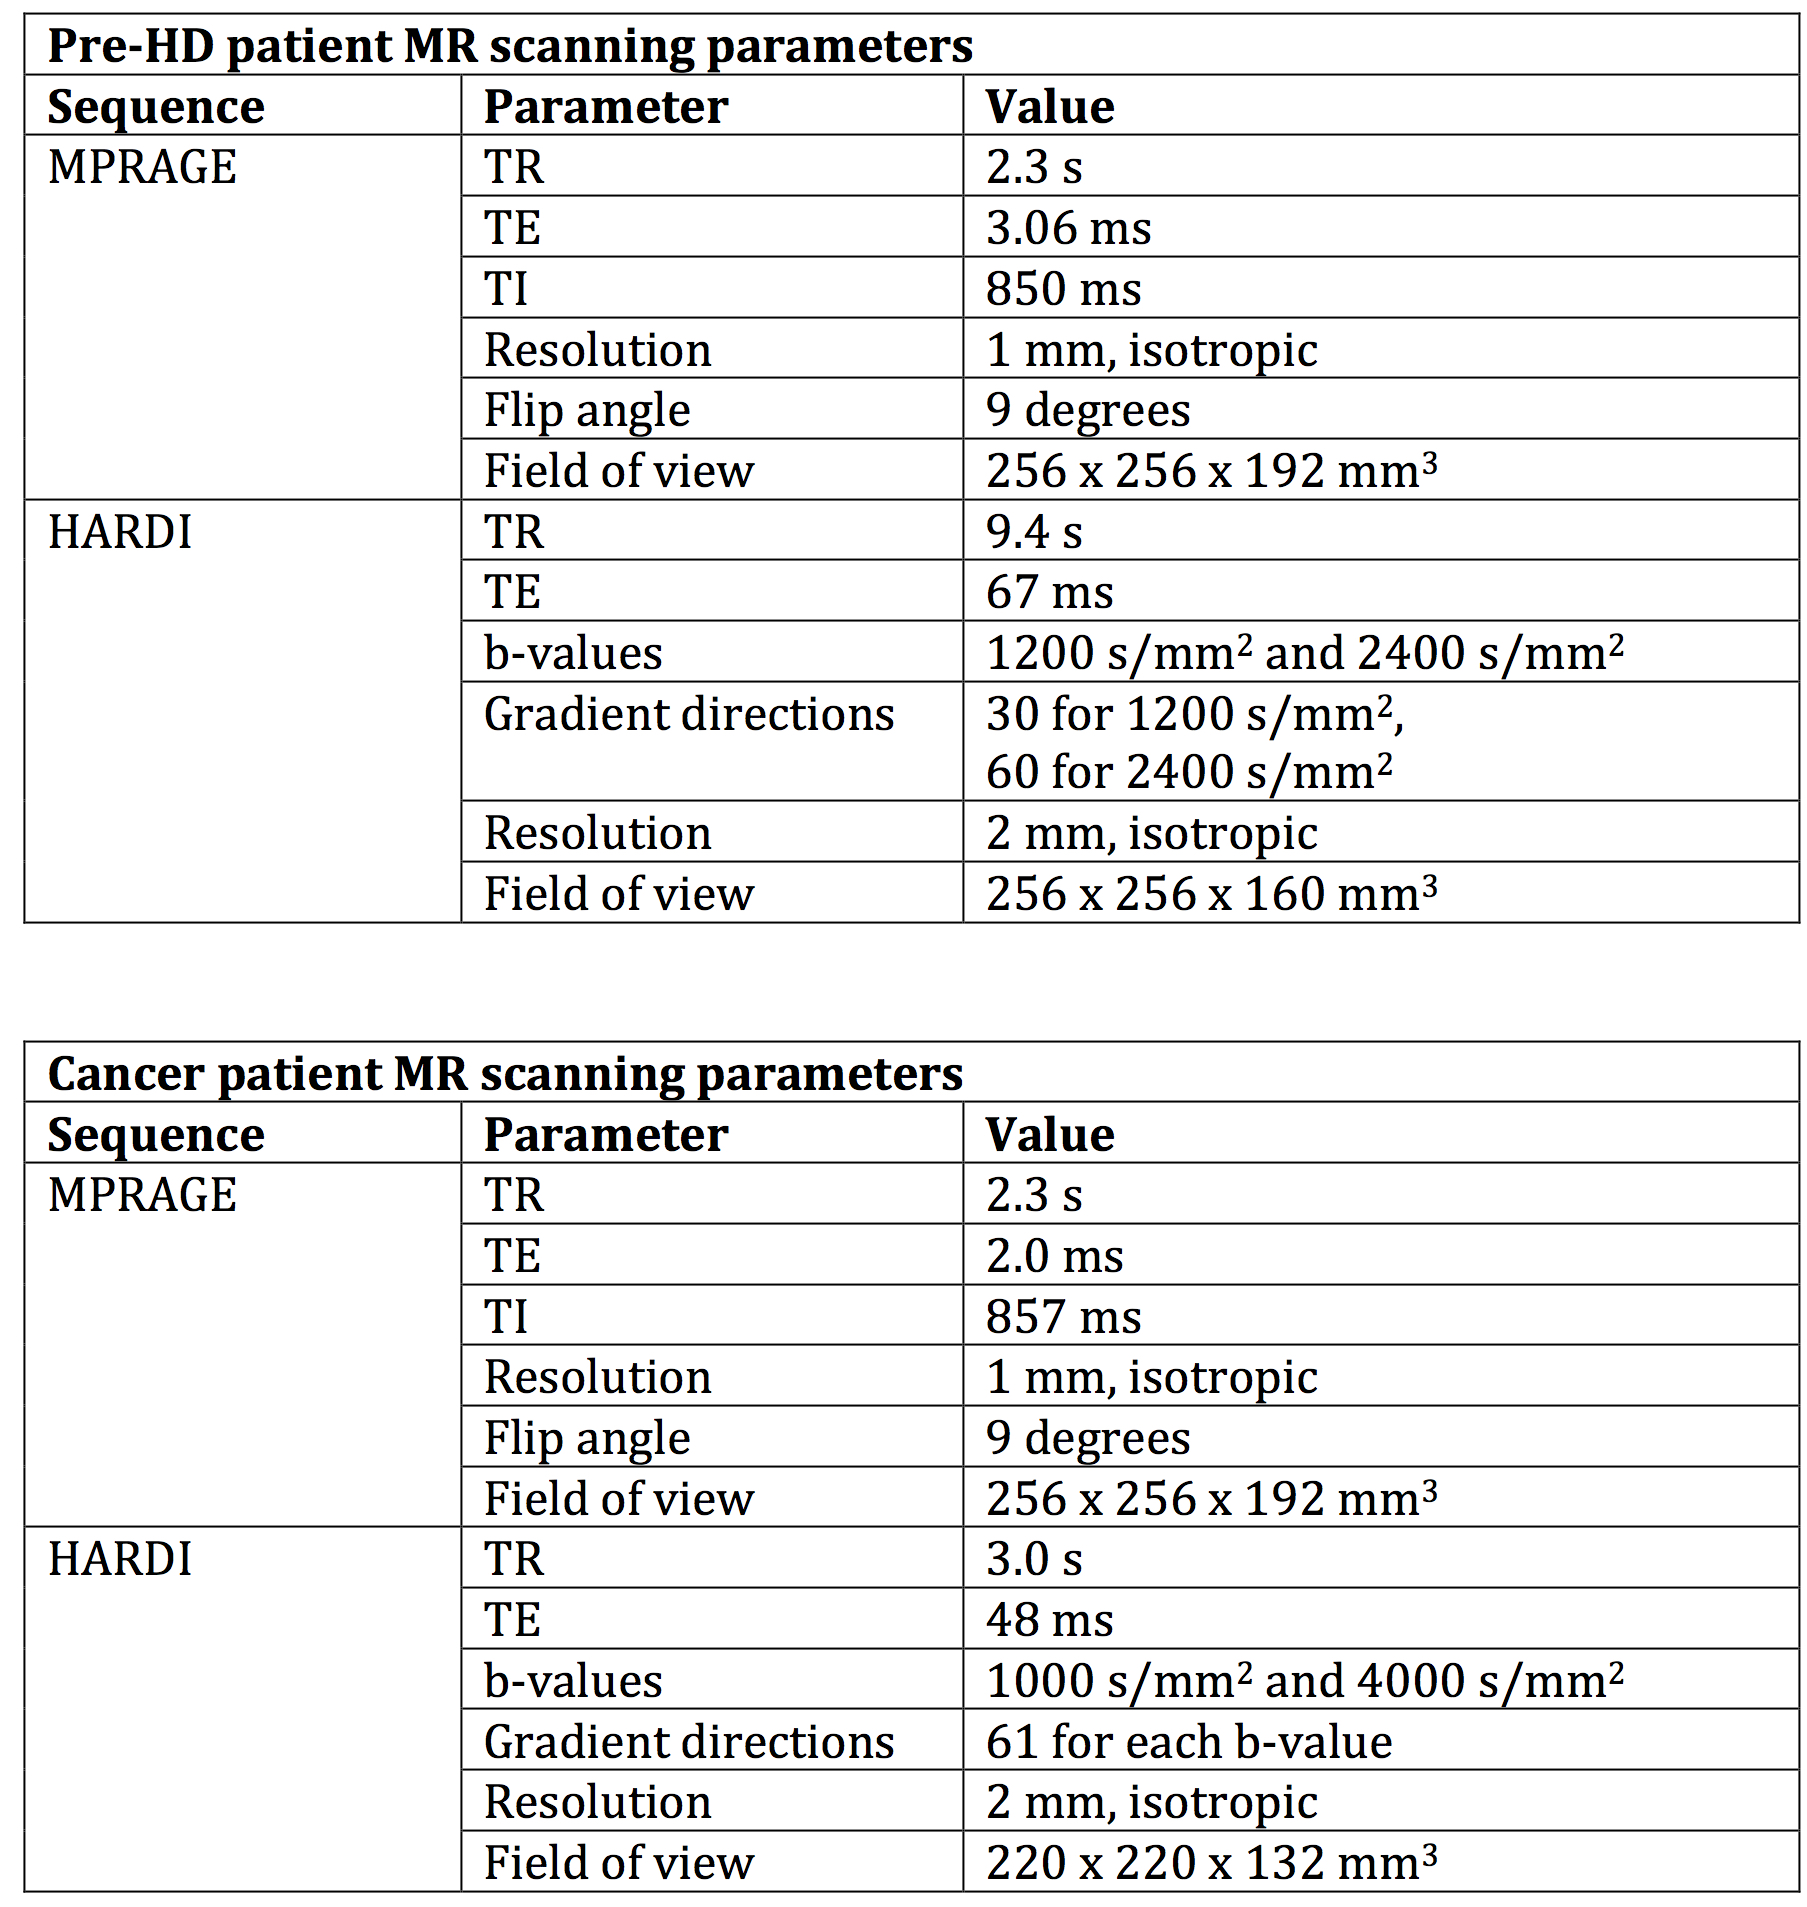
We acquired MRI data from participants who gave written, informed consent. All procedures were approved by the appropriate Ethics Committees. Pre-HD patients were scanned in a 3T Siemens Prisma scanner with 80mT/m gradients, while MBT patients were scanned in a 3T Siemens Connectom scanner with 300mT/m gradients. The parameters of the scans are listed in Figure 1.
CFD simulations were run for 72 hours of infusion, using finite element methods as described in 9. Models were run with (a) the diffusion tensor and (b) the diffusion propagator, and the differences in the drug concentrations were computed. These differences were correlated with voxel-wise estimates of the fractional anisotropy (FA). For pre-HD patients, the infusion point was in the striatum, which exhibits abnormalities in pre-HD and is a potential treatment target. For MBT patients, the infusion point was inside the tumor.
Results
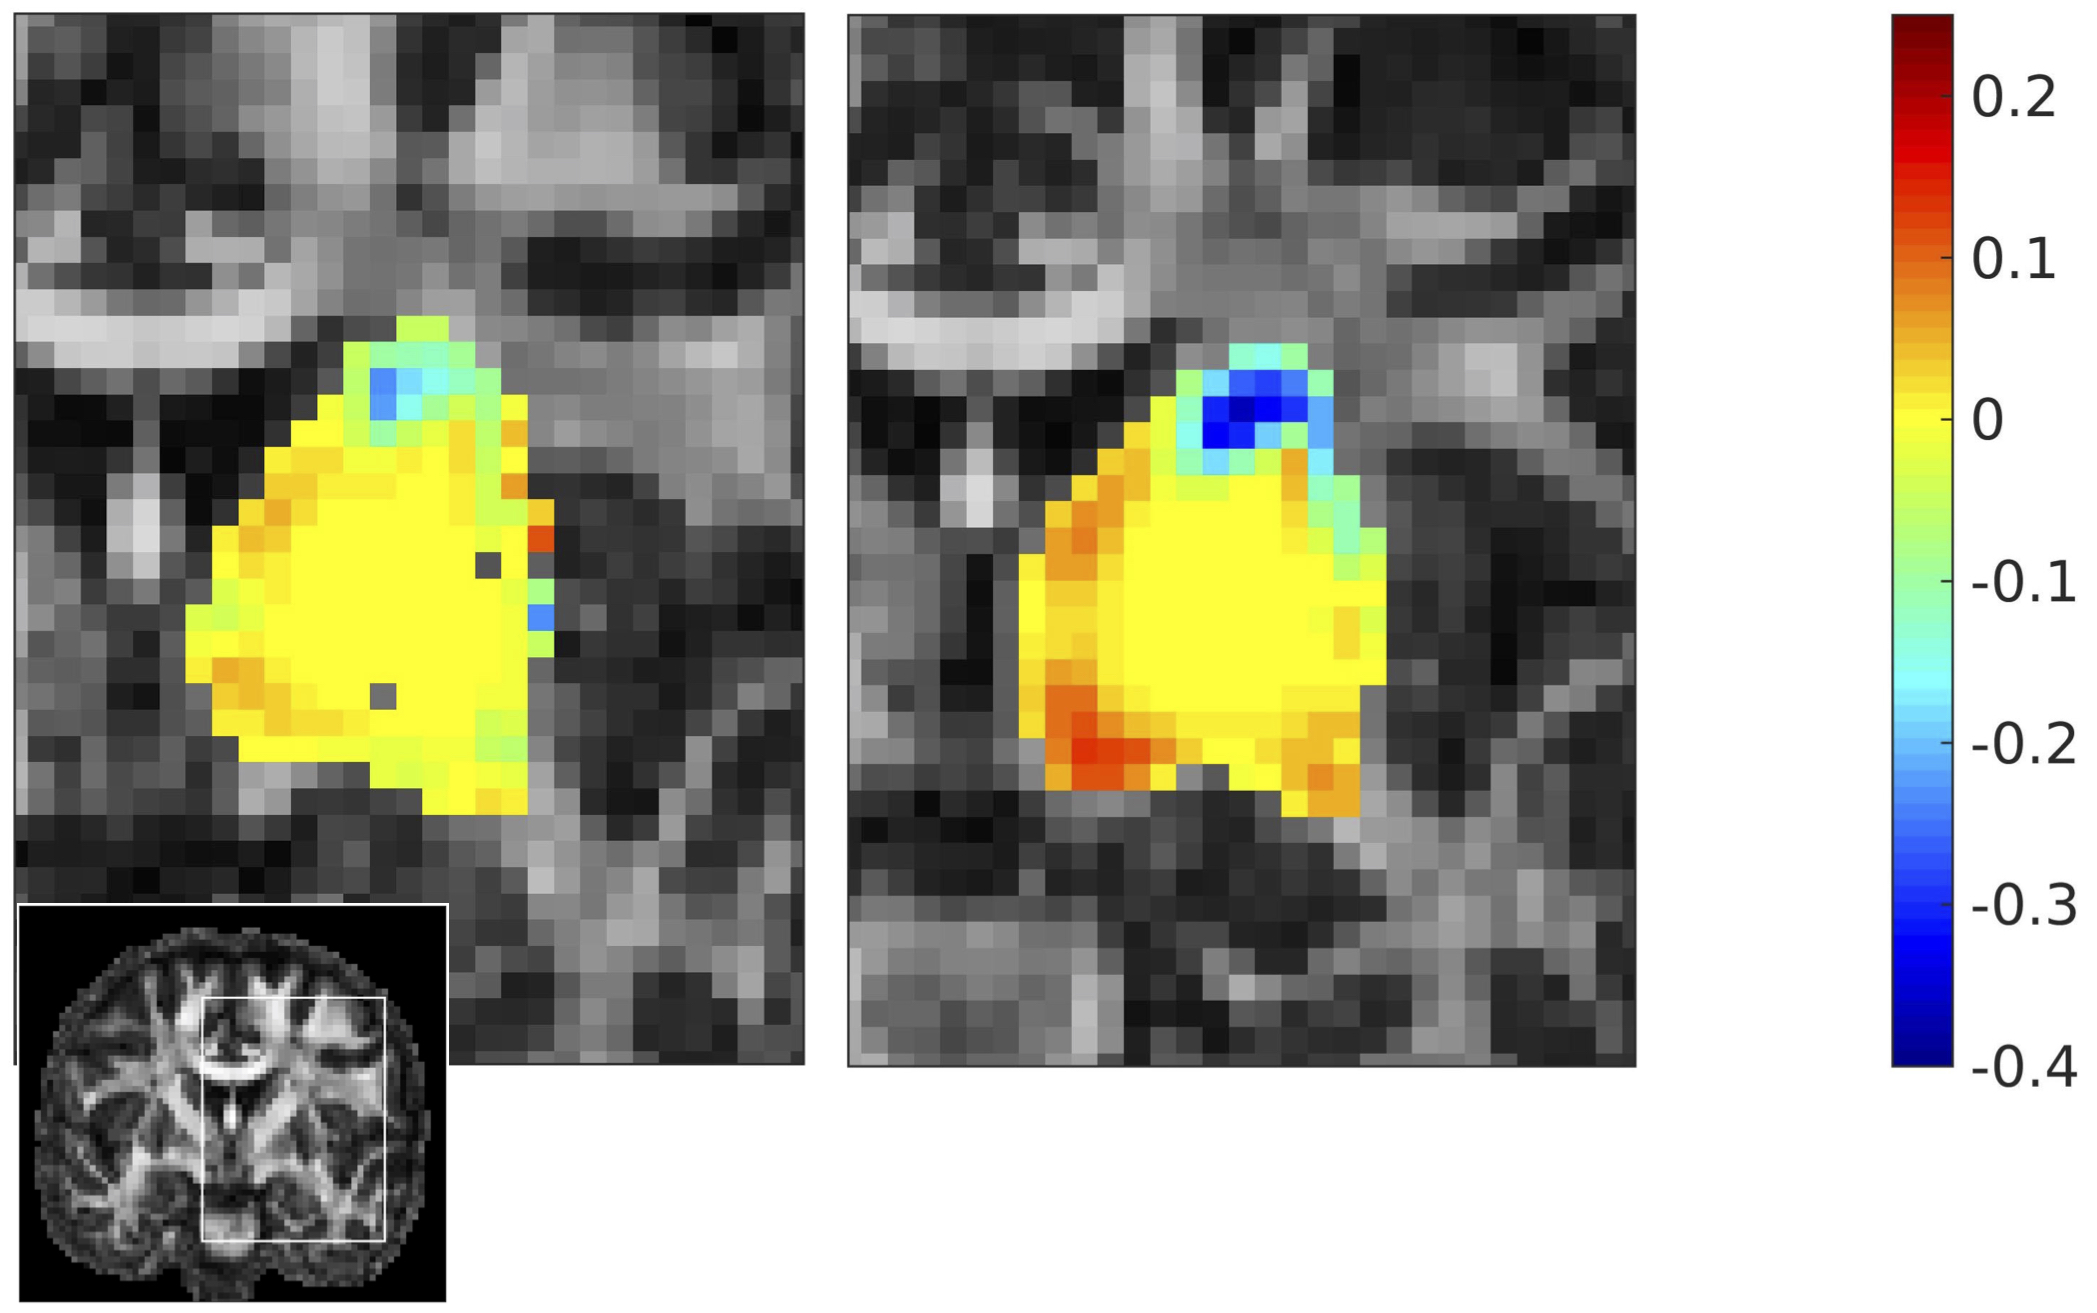
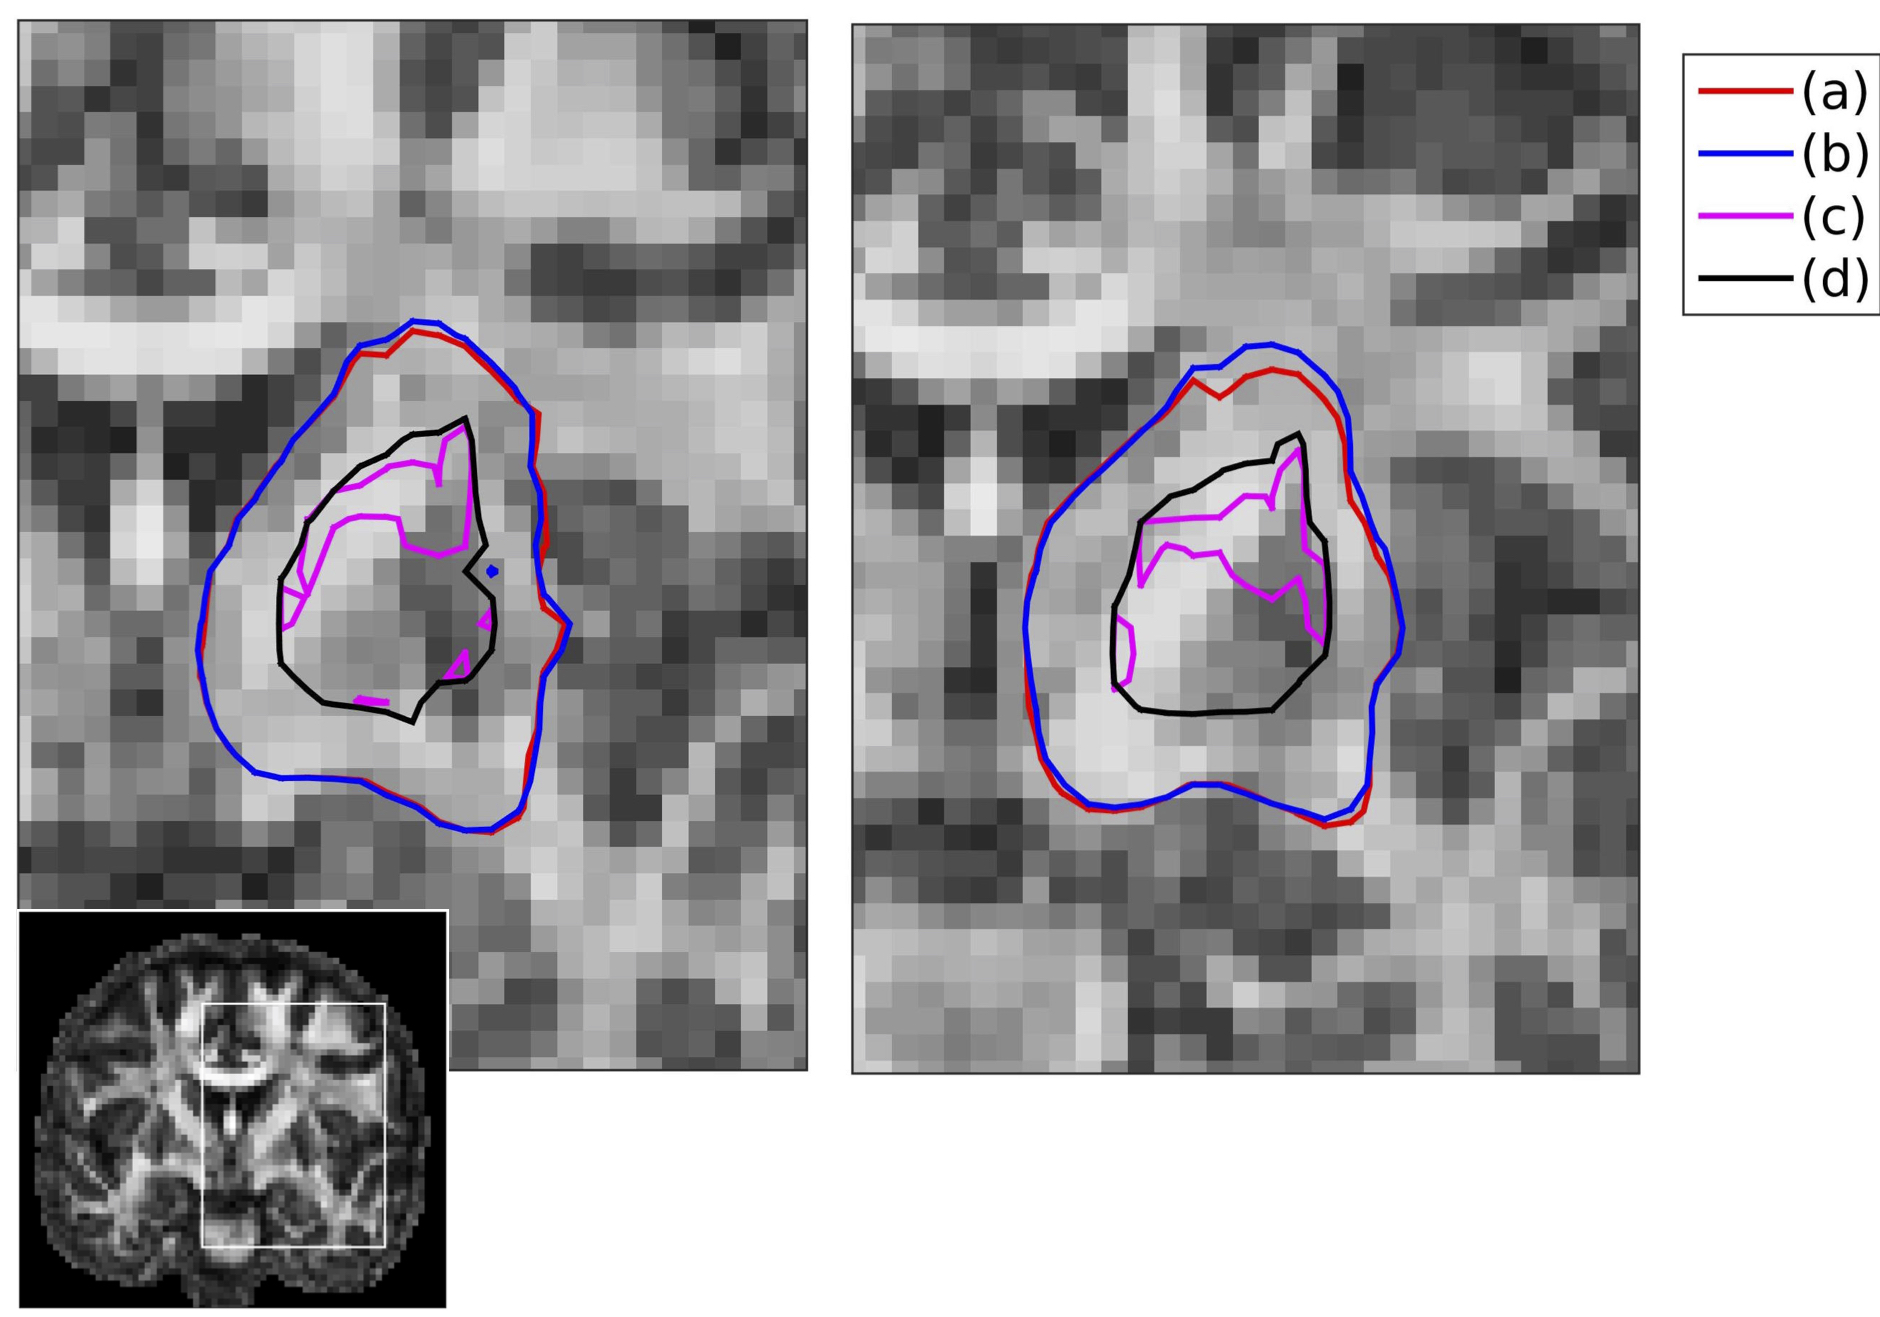
Pre-HD patients: At each brain location, the differences in predicted concentrations between the two models ranged between -56% and +29% of the maximum concentration (Figure 2). There were differences in the structures covered by the drug when using the diffusion-tensor representation compared to when using the diffusion-propagator representation (Figure 3).
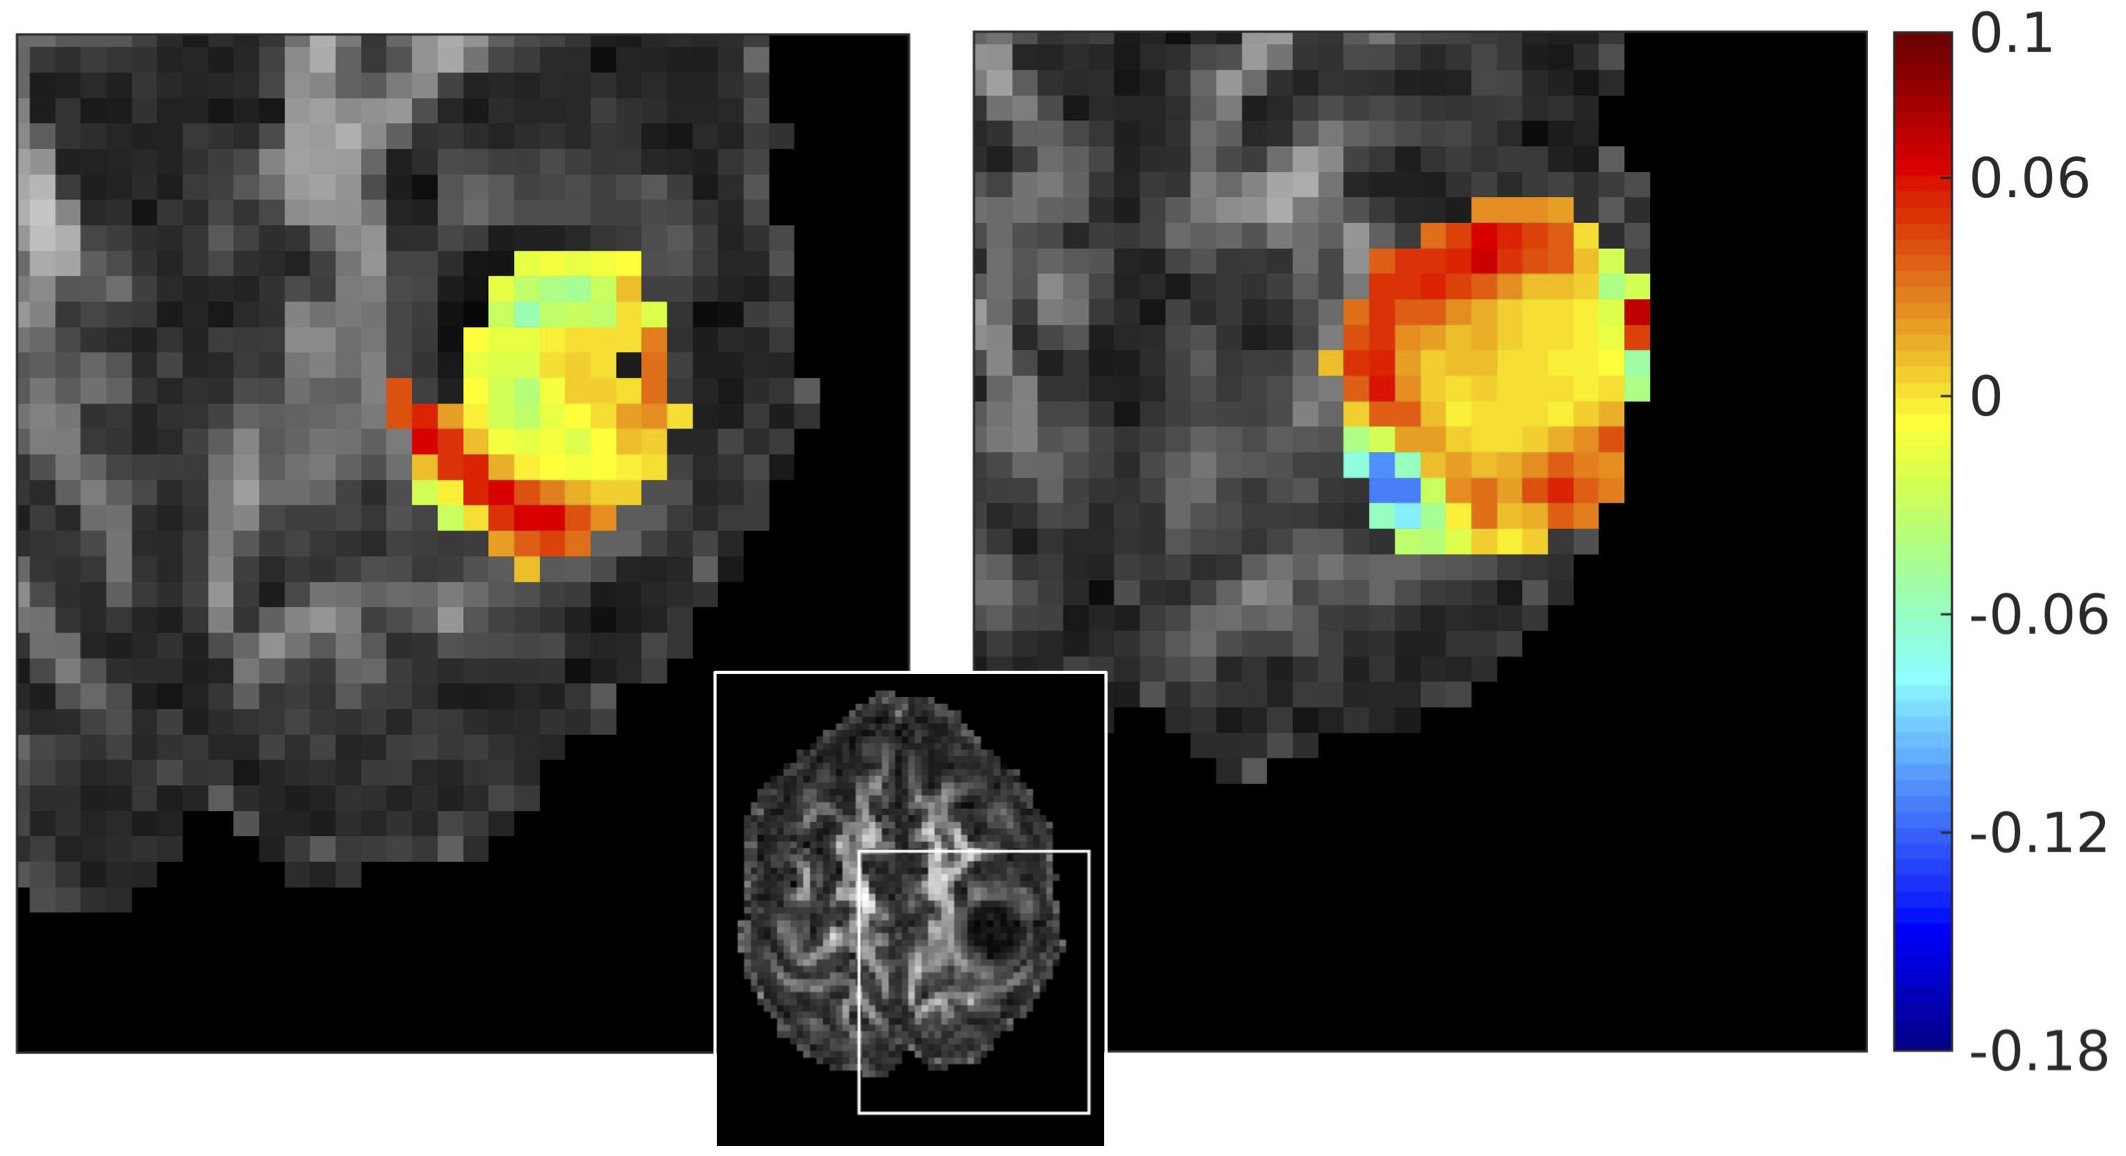
MBT patients: The error in concentration ranged between -18% and +10% of the maximum concentration (Figure 4).
For all participants, the error in concentration was statistically significantly correlated (uncorrected p-values < 10-10)
with the mean FA of the diffusion tensor of the voxels traced by the drug. The correlation coefficients were about 0.40 for the pre-HD patients, and about 0.25 for the
MBT patients. Therefore, the higher the anisotropy of the treated tissue, the larger the differences in the concentration between the diffusion-tensor and the diffusion-propagator CFD models. This is expected given that the diffusion non-Gaussianity captured by the diffusion propagator is high in brain regions of high fractional anisotropy.
Discussion
As described in 9, including the diffusion non-Gaussianity in the CFD model results in improved predictions for the drug distribution in CED. Our results show that the more anisotropic the tissue to be treated, the more pronounced the differences in the concentrations predicted by the two models described. This means that the catheter setup advocated for use in the clinical setting by models based on the diffusion tensor can be improved by using models that use the diffusion propagator. This is essential for infusion in the striatum of pre-HD patients, given the large differences in concentration resulting for those patients if diffusion non-Gaussianity is neglected, and is due to the striatum having fractional anisotropies of 0.5 or higher. For the case of infusion in MBTs, the differences appear to be smaller, although still statistically significant. This is due to the fact that brain tumors are more isotropic structures. In summary, in this work, we move beyond the diffusion tensor for predicting drug concentrations via CED to the human brain.Acknowledgements
The work was partly funded under the BRAIN Unit. The BRAIN Unit is funded by the Welsh Government through Health and Care Research Wales. The data were acquired at the UK National Facility for In Vivo MR Imaging of Human Tissue Microstructure, funded by the EPSRC and The Wolfson Foundation. The authors also wish to acknowledge support by the Wellcome Trust, the Jacques & Gloria Gossweiler Foundation, the Alzheimer's Society, and BRACE.References
[1] R. Raghavan, M.L. Brady, M.I. Rodriguez-Ponce, A. Hartlep, C. Pedain and J.H. Sampson. Convection-enhanced deliveryof therapeutics for brain disease, and its optimization. Neurosurgical Focus, 20(3): 1-13, 2006.
[2] N.U. Barua, S.S. Gill, and S. Love. Convection-enhanced delivery to the brain: therapeutic potential and neuropathological considerations. Brain Pathology, 24:117-127, 2004.
[3] M. Sarntinoranont, X. Chen, J. Zhao and T.H. Mareci.
Computational model of interstitial transport in
the spinal cord using diffusion tensor imaging. Annals of Biomedical Engineering, 34(8):1304-1321, 2006.
[4] A.A. Linninger, M.R. Somayaji, M. Mekarski and L. Zhang. Prediction of convection-enhanced drug delivery to the human brain. Journal of Theoretical Biology, 250: 125-138, 2008.
[5] J.H. Kim, G.W. Astary, X. Chen, T.H. Mareci and M. Sarntinoranont.
Voxelized Model of Interstitial Transport in the Rat Spinal Cord
Following Direct Infusion Into White Matter. Journal of Biomechanical Engineering,
131(7): 071007, 2009.
[6]
K.N. Magdoom, G.L. Pishko, J.H. Kim, and M. Sarntinoranont. Evaluation of a voxelized model based
on DCE-MRI for tracer transport in tumor. Journal of Biomechanical Engineering, 134:091004, 2012.
[7] K.N. Magdoom, G.L. Pishko, L. Rice, C. Pampo, D.W. Siemann, and M. Sarntinoranont. MRI-based computational model of heterogeneous tracer transport following local infusion into a mouse hind limb tumor. PLOSOne, 9(3), 2014.
[8]
R. Raghavan and M. Brady. Predictive models for pressure-driven fluid infusions into brain parenchyma.
Physics in Medicine and Biology, 56:6179, 2011.
[9] E. Messaritaki, S.U. Rudrapatna, G.D. Parker, W.P. Gray and D.K. Jones. Improving the predictions of computational models of convection-enhanced drug delivery by accounting for diffusion non-Gaussianity, under revision in Frontiers in Neurology.
[10] L Ning, C.F. Westin and Y. Rathi. Estimating diffusion propagator and its moments using directional radial basis functions. IEEE Transactions on Medical Imaging. 34(10):2058-2078
Figures