3531
Can unprecedented echo times in human diffusion weighted fMRI help reveal its biological underpinnings?1CUBRIC, School of Psychology, Cardiff University, Cardiff, United Kingdom, 2School of Physics and Astronomy, Cardiff University, Cardiff, United Kingdom
Synopsis
The brain versus vein dilemma in BOLD fMRI has spurred research towards more direct correlates of neuronal activation. Diffusion-weighted fMRI (dfMRI) emerged as a potential alternative 17 years ago. However, its signal origins and utility have been greatly debated. In this work, we combine ultra-high-gradients and spiral readout to characterize dfMRI contrast in humans in parameter spaces (TE, b-value, SNR and resolution) that have never been accessible before. Varying TE over a wide range while keeping the b-value fixed allowed us to detect significant hemodynamic contributions to dfMRI contrast at a b-value of 1200 s/mm2.
Introduction
Despite diffusion-weighted fMRI (dfMRI) being proposed as spatio-temporally superior to gradient echo (GE) and spin echo (SE) BOLD fMRI1-8, its biophysical underpinnings are yet to be ascertained9-16. Disentangling the hemodynamic and diffusion-based contributions is challenging, with most studies concluding that the dfMRI contrast is a mixture of both BOLD and non-BOLD contributions17,18. On clinical scanners, the shortest achievable echo-time (TE) for diffusion-weighted EPI, even with modest diffusion-weighting, is around 60 ms. At 3 T, this coincides with the highest sensitivity to SE-BOLD signals19. As the SE-BOLD signal is known to decrease linearly with decreasing TE20, BOLD contribution to dfMRI can be reduced by reducing TE. Therefore, we developed a single-shot spiral spin-echo dfMRI sequence on a 3 T Connectom scanner with ultra-strong gradients21,22, achieving an echo-time of just 22.5 ms for b-values of up to 1200 s/mm2. We then assessed the behaviour of dfMRI signals across different TEs and b-values during visual stimulation in this newly opened up parameter space.Methods
Five healthy volunteers were scanned on the Siemens Connectom scanner (3 T, 300 mT/m gradients) with visual stimulation (6 runs of alternating checkerboard at 8 Hz, 20 s OFF/20 s ON) at different b-values and TEs using a 32-channel head coil, FOV: 18.2 cm2, Resolution: 1.75 mm2, 13 coronal slices (2 mm thickness) covering the visual cortex, diffusion weighting direction left-right. The following scans were performed. Subject 1: TE = 22.5, 40, 60 and 80 ms, b = 50, 400, 800 and 1200 s/mm2, Subjects 2-4: TE = 22.5, 60 ms, b = 50, 800 and 1200 s/mm2, Subject 5: TE = 22.5 ms, 2 x b = 50 s/mm2, 4 x b = 1200 s/mm2.
fMRI analysis (FSL FEAT23) was performed on all the datasets with default settings. Percentage signal change (%SC) in the activated voxels was estimated and ANOVA was performed to ascertain the influence of b-value and TE. Further, we relaxed the hemodynamic response function (HRF) assumption24 by allowing voxel-wise lag to the start of the HRF25 (from -3 to +3 seconds, in 0.2 seconds steps) and also performed an analysis without a pre-set response function26 (TENT basis function in AFNI). These analyses help to identify potential spatio-temporal differences in the observed activation patterns.
Results
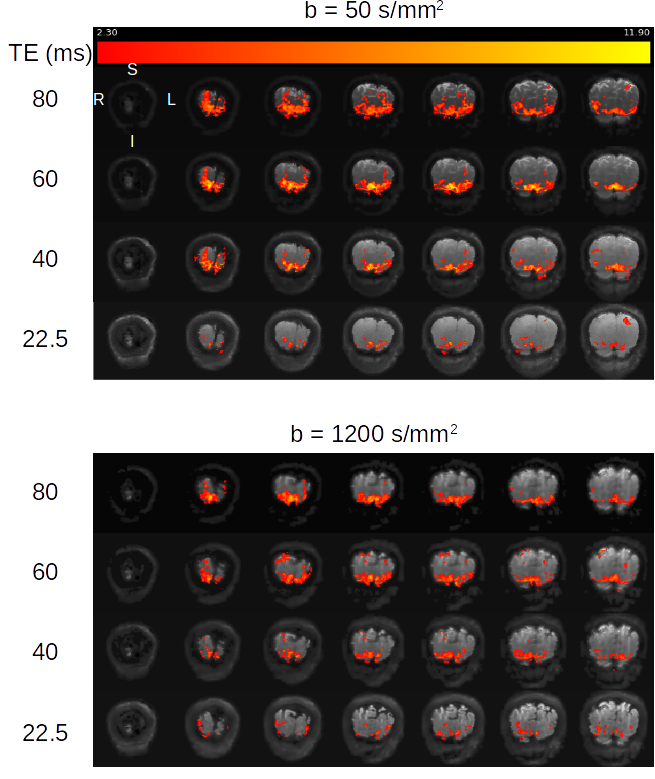
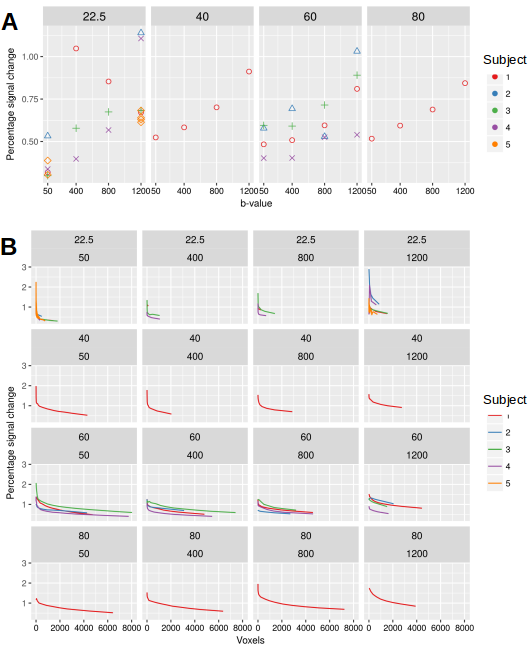
Significant dfMRI responses were detected in the visual cortex across all TE and b-values used in this study. For each b-value, the activation regions became more spatially localised at shorter TE (Fig. 1). For an activation threshold of Z > 2.3, the signal change resulting from visual stimulation increased with TE and b-value (Fig. 2). The %SC increased significantly as a function of b-value (ANOVA, p = 0.0059, Fig. 3A). However, when the %SC were studied as a function of the number of voxels with greatest activation, this trend did not manifest (Fig. 3B).
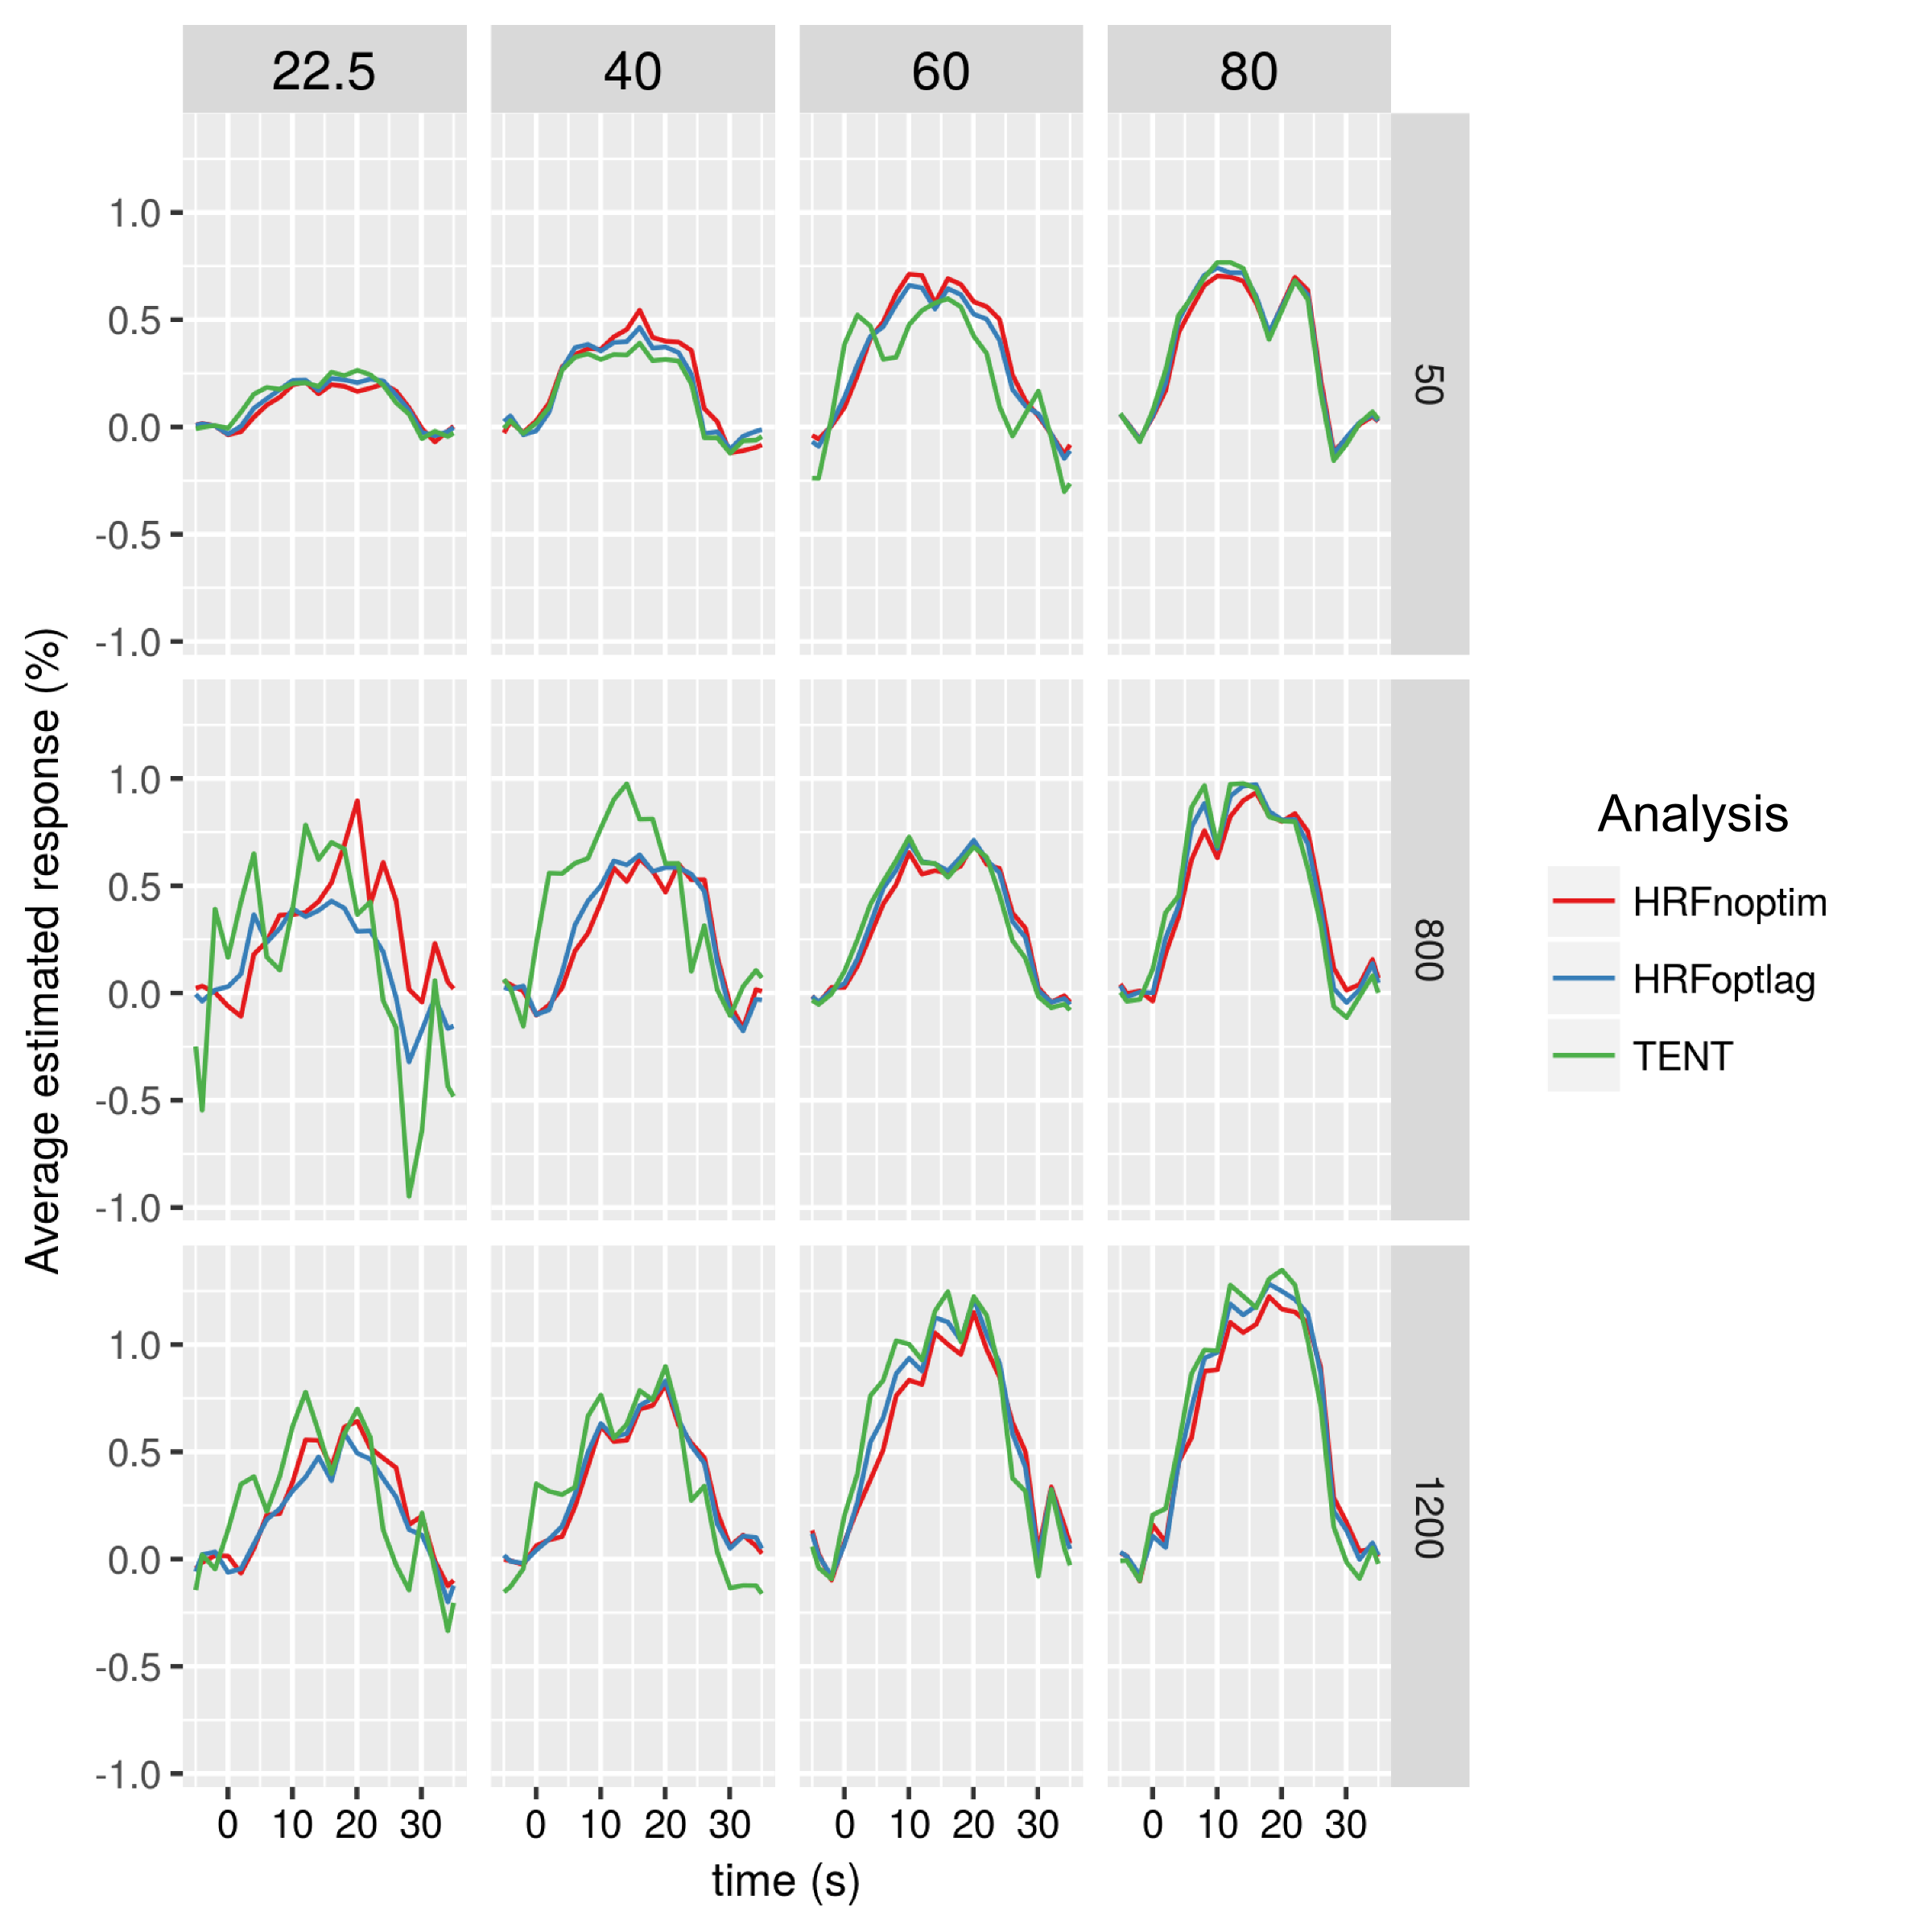
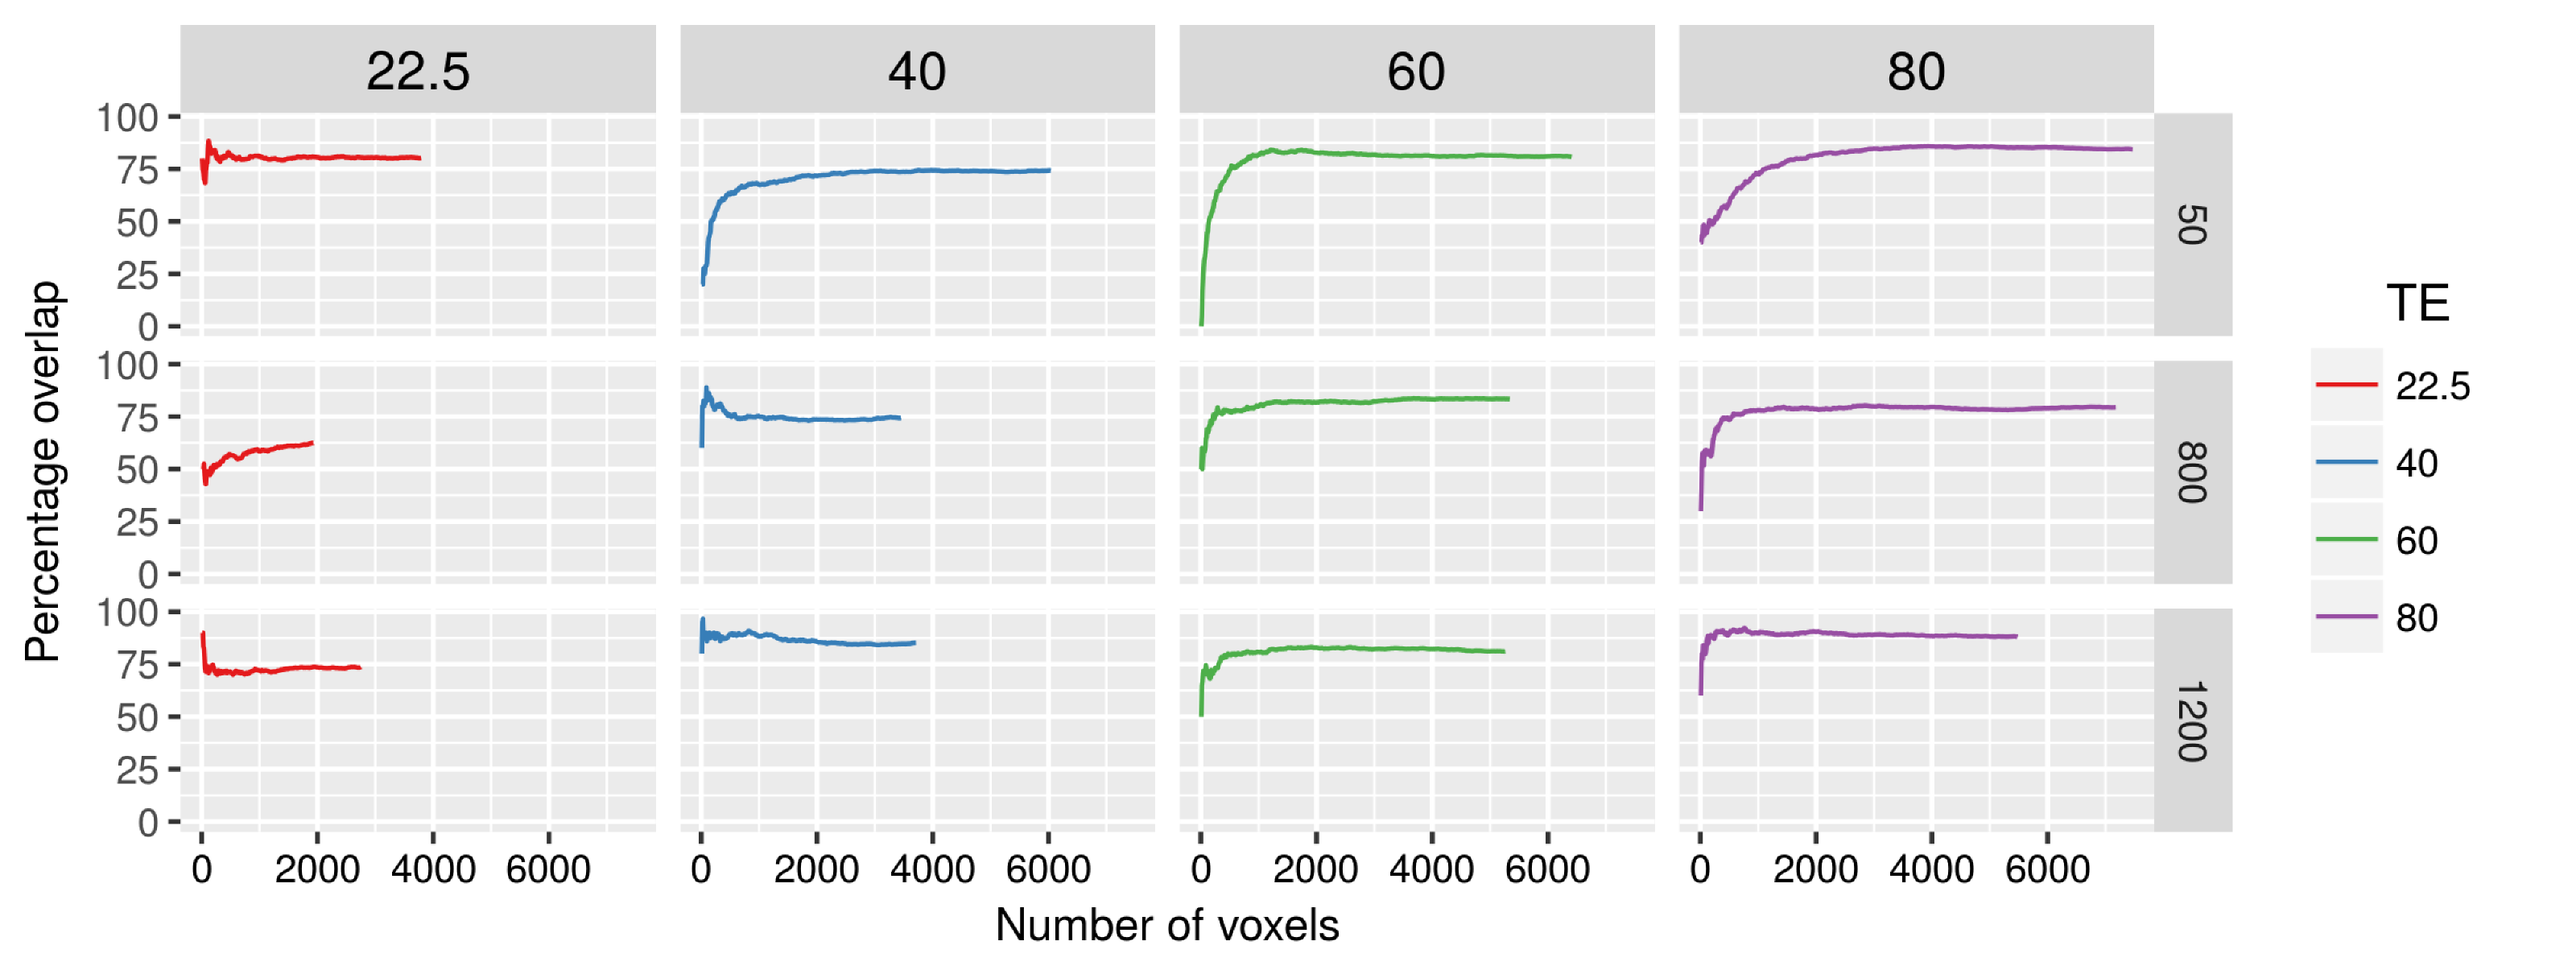
The optimum lag HRF analysis showed no major differences in responses compared to the fixed delay HRF analysis (Fig. 4, red and blue plots). However, the TENT analysis, showed visibly different, and possibly earlier responses (Fig. 4, green plots). Both these analyses confirmed that the functional responses are weaker at shorter TEs, but increase with b-value. The analysis of the spatial overlap of activation areas is reported as percentage overlap between a fixed number of voxels ranked by their Z-scores (Fig. 5).
Discussion
The combination of ultra-high gradients and spiral readout enabled dfMRI acquisitions with very short TEs, thereby significantly suppressing SE-BOLD contributions. Nearly three-fold reduction in SE-BOLD contrast was observed at TE = 22.5 ms compared to TE = 60 ms. This reduction was still two fold at b = 1200 s/mm2, which perhaps indicates significant vascular contributions to dfMRI at b = 1200 s/mm2. Since diffusion-based contributions to dfMRI should be TE-independent, the next step is to identify the lower b-value threshold at which this manifests.
We reproduced the key observation that underpins the hypothesis of cellular origins of dfMRI contrast, namely, an increase in %SC with increasing b-value1,2. However, this analysis does not account for the variations in activation area detected at different b-values. When %SC was analysed in equal number of voxels ranked by Z-scores, this trend did not persist.
The TENT analysis revealed slightly earlier responses compared to HRF-based methods, and may help verify the reported temporal specificity improvements with dfMRI2,27. The high spatial overlap of activation regions at shorter TE and higher b-values could indicate improved specificity of dfMRI when compared to the longer TE and lower b-value SE regime.
In conclusion, the combination of ultra-strong gradients and spiral readout helped to open an expanded parameter space (TE and b-value) for dfMRI. This could be invaluable in future investigations of the dfMRI contrast.
Acknowledgements
The data were acquired at the UK National Facility for In Vivo MR Imaging of Human Tissue Microstructure funded by the EPSRC (grant EP/M029778/1), and The Wolfson Foundation. This work was also funded by a Wellcome Trust Investigator Award (096646/Z/11/Z) and a Wellcome Trust Strategic Award (104943/Z/14/Z).References
1. Darquié A, Poline JB, Poupon C, Saint-Jalmes H, and Le Bihan D. Transient decrease in water diffusion observed in human occipital cortex during visual stimulation. Proceedings of the National Academy of Sciences of the United States of America, July 2001, 98:9391-9395.
2. Le Bihan D, Urayama Si, Aso T, Hanakawa T, and Fukuyama H. Direct and fast detection of neuronal activation in the human brain with diffusion mri. Proceedings of the National Academy of Sciences of the United States of America, May 2006, 103:8263-8268.
3. Le Bihan D. The 'wet mind': water and functional neuroimaging. Physics in medicine and biology, April 2007, 52:R57-R90.
4. Tsurugizawa T, Ciobanu L, and Le Bihan D. Water diffusion in brain cortex closely tracks underlying neuronal activity. Proceedings of the National Academy of Sciences of the United States of America, July 2013, 110:11636-11641.
5. Williams RJ, Reutens DC, and Hocking J. Functional localization of the human color center by decreased water displacement using diffusion-weighted fmri. Brain and behavior, November 2015, 5:e00408.
6. Abe Y, Tsurugizawa T, and Le Bihan D. Water diffusion closely reveals neural activity status in rat brain loci affected by anesthesia. PLoS biology, April 2017, 15:e2001494.
7. Nicolas R, Gros-Dagnac H, Aubry F, and Celsis P. Comparison of bold, diffusion-weighted fmri and adc-fmri for stimulation of the primary visual system with a block paradigm. Magnetic resonance imaging, June 2017, 39:123-131.
8. Nunes D, Ianus A, and Shemesh N. Layer-specifi c connectivity revealed by diffusion-weighted functional mri in the rat thalamocortical pathway. NeuroImage, September 2018, 184:646-657.
9. Jin T, Zhao F, and Kim SG. Sources of functional apparent diffusion coefficient changes investigated by diffusion-weighted spin-echo fmri. Magnetic resonance in medicine, December 2006, 56:1283-1292.
10. Miller KL, Bulte DP, Devlin H, Robson MD, Wise RG, Woolrich MW, Jezzard P, and Behrens TEJ. Evidence for a vascular contribution to diffusion fmri at high b value. Proceedings of the National Academy of Sciences of the United States of America, December 2007, 104:20967-20972.
11. Jin T and Kim SG. Functional changes of apparent diffusion coefficient during visual stimulation investigated by diffusion-weighted gradient-echo fmri. NeuroImage, July 2008, 41:801-812.
12. Autio JAA, Kershaw J, Shibata S, Obata T, Kanno I, and Aoki I. High b-value diffusion-weighted fmri in a rat forepaw electrostimulation model at 7 t. NeuroImage, July 2011, 57:140-148.
13. Rudrapatna US, van der Toorn A, van Meer MPA, and Dijkhuizen RM. Impact of hemodynamic effects on diffusion-weighted fmri signals. NeuroImage, May 2012, 61:106-114.
14. Kuroiwa D, Obata T, Kawaguchi H, Autio J, Hirano M, Aoki I, Kanno I, and Kershaw J. Signal contributions to heavily diffusion-weighted functional magnetic resonance imaging investigated with multi-se-epi acquisitions. NeuroImage, September 2014, 98:258-265.
15. Bai R, Stewart CV, Plenz D, and Basser PJ. Assessing the sensitivity of diffusion mri to detect neuronal activity directly. Proceedings of the National Academy of Sciences of the United States of America, March 2016, 113:E1728-E1737.
16. Williams RJ, Reutens DC, and Hocking J. Influence of bold contributions to diffusion fmri activation of the visual cortex. Frontiers in neuroscience, 2016, 10:279.
17. Lee SP, Silva AC, Ugurbil K, and Kim SG. Diffusion-weighted spin-echo fmri at 9.4 t: microvascular/tissue contribution to bold signal changes. Magnetic resonance in medicine, November 1999, 42:919-928.
18. Kershaw J, Tomiyasu M, Kashikura K, Hirano Y, Nonaka H, Hirano M, Ikehira H, Kanno I,and Obata T. A multi-compartmental se-bold interpretation for stimulus-related signal changes in diffusion-weighted functional mri. NMR in biomedicine, August 2009, 22:770-778.
19. Ragot DM. Characterizing Contrast Origins and Noise Contribution in Spin-echo BOLD at 3 T. MSc Thesis, Department of Medical Biophysics, University of Toronto., 2018.
20. Jin T, Wang P, Tasker M, Zhao F, and Kim SG. Source of nonlinearity in echo-time-dependent bold fmri. Magnetic resonance in medicine, June 2006, 55:1281-1290.
21. Setsompop K, Kimmlingen R, Eberlein E, Witzel T, Cohen-Adad J, McNab JA, Keil B, Tisdall MD, Hoecht P, Dietz P, Cauley SF, Tountcheva V, Matschl V, Lenz VH, Heberlein K, Potthast A, Thein H, Van Horn J, Toga A, Schmitt F, Lehne D, Rosen BR, Wedeen V, and Wald LL. Pushing the limits of in vivo diffusion mri for the human connectome project. NeuroImage, October 2013, 80:220-233.
22. Jones DK, Alexander DC, Bowtell R, Cercignani M, Dell'Acqua F, McHugh DJ, Miller KL, Palombo M, Parker GJM, Rudrapatna US, and Tax CMW. Microstructural imaging of the human brain with a 'super-scanner': 10 key advantages of ultra-strong gradients for diffusion mri. NeuroImage, November 2018, 182:8-38.
23. Woolrich MW, Ripley BD, Brady M, and Smith SM. Temporal autocorrelation in univariate linear modeling of fmri data. NeuroImage, December 2001, 14:1370-1386.
24. Aso T, Urayama Si, Poupon C, Sawamoto N, Fukuyama H, and Le Bihan D. An intrinsic diffusion response function for analyzing diffusion functional mri time series. NeuroImage, October 2009, 47:1487-1495.
25. Geranmayeh F, Wise RJS, Leech R, and Murphy K. Measuring vascular reactivity with breath-holds after stroke: a method to aid interpretation of group-level bold signal changes in longitudinal fmri studies. Human brain mapping, May 2015, 36:1755-1771.
26. Chen G, Saad ZS, Adleman NE, Leibenluft E, and Cox RW. Detecting the subtle shape differences in hemodynamic responses at the group level. Frontiers in neuroscience, 2015, 9:375.
27. Gangstead SL and Song AW. On the timing characteristics of the apparent diffusion coefficient contrast in fmri. Magnetic resonance in medicine, August 2002, 48:385-388.
Figures