3528
Diffusion-Weighted Imaging Of Upper Abdomen: A Comparative Study In Healthy VolunteersZhuo Shi1, Lizhi Xie2, XinMing Zhao1, and Han Ou-Yang1
1Department of Diagnostic Radiology, National Cancer Center/Cancer Hospital, Chinese Academy of Medical Sciences and Peking Union Medical College, Beijing, China, 2GE Healthcare, China, Beijing, China
Synopsis
Nowadays,no standard scanning protocol or parameter for upper abdomen DWI is available. Due to tension, fear or poor tolerance, patients’ respiration may vary during the scan, leading to incorrect ADC measurement and missed diagnosis. In our study, we performed quantitative and qualitative analyses of images acquired via respiratory-triggered, breath-hold and free-breathing DWI at both 1.5T and 3T, to compare their image quality and the apparent diffusion coefficient (ADC) values of upper abdomen, then decide which is the best technique for upper abdomen DWI.
Introduction
Diffusion-weighted imaging is a useful technique for disease diagnosis [1]. Without significantly extending the whole scan time, DWI has been incorporated into routine MRI sequences. It has been widely used to evaluate organs of upper abdomen, for quantitative and qualitative analyses [2]. The three main acquisitions for DWI are respiratory-triggered, breath-hold and free-breathing techniques. Breath-hold DWI needs relatively short scan time, but the SNR is sacrificed. Respiratory-triggered technique uses a higher number of excitations (NEX) under free breathing status to yield images with high SNR, but it takes longer scan time. Recent years, due to the development of diffusion weighted imaging with background suppression theory (DWIBS), free-breathing DWI has emerged as a new imaging tool in systemic oncology [3]. It can not only yield thin-layer and multi-NEX scanning, but also generate a higher SNR with greater time efficiency [4,5].Purpose
The aims of this study were to compare the image quality and apparent diffusion coefficient (ADC) values of upper abdomen in respiratory-triggered, breath-hold and free-breathing DWI at both 1.5T and 3T, then to select the optimal strategy for upper abdomen DWI clinically.Materials and Methods
From March to May of 2018, a total of 61 volunteers were examined at both 1.5T and 3.0T scanners (Signa HDxt, GE Medical Systems, Milwaukee, WI, USA) with corresponding eight-channel body phased-array coil (GE Medical Systems). All the examinations were performed on the same day. Images were acquired using respiratory-triggered, breath-hold and free-breathing DW-MRI based on single-shot spin-echo echo-planar imaging (SE-EPI), and the b values were 100 and 800, respectively. Two physicians with extensive experience in the Department of Radiology conducted quantitative and qualitative analyses by using GE Z800 workstation. All DWI images were converted into corresponding ADC maps. The regions of interest (ROIs) in both DWI and ADC maps were drawn to obtain the signal intensity (SI) and ADC value of corresponding area. The interested areas were located on the right posterior lobe of liver (main portal vein and its right branch level), the middle portion of spleen and gall bladder, the right renal cortex, and the pancreatic tails in the DWI and ADC maps. SPSS19.0 was used to analyze the data. If multiple comparisons were necessary, according to Bonferroni correction, P < 0.0167 (P < 0.05/3) was used to indicate significant difference.Results
The artifacts were higher at high b value than at low b value, and the artifacts of 3T MRI were heavier than 1.5T (Tables 1, 2). Respiratory-triggered DWI at 3T yielded the best image quality with the least artifacts (P < 0.01, Table 1). The SNR of gall bladder, kidney, spleen and pancreas at 3T were higher than at 1.5T, in contrast to the liver (Tables 3). And the SNR of free-breathing DWI was higher than that of respiratory-triggered and breath-hold DWI (Table 4). The ADC values showed no significant differences (P > 0.05) between the two MRI scanners for normal liver, gall bladder, kidney, spleen and pancreas (Table 5). Among the three acquisition techniques, the mean absolute difference (bias) and 95% confidence interval of the mean difference (limits of agreement) of liver ADC in the breath-hold DWI were the worst (Fig. 2).Conclusion
Respiratory-triggered DWI at 3T has several image quality benefits over the others with minimal artifacts, and free-breathing DWI yielded the highest SNR. Though many organs’ SNR at 1.5T were lower than at 3T, their ADC values showed no significant variation between two magnets. Therefore, respiratory-triggered acquisition at 3T is still the best technique for upper abdomen DWI, especially for those healthy people.Acknowledgements
No acknowledgement found.References
[1] Holzapfel K, Gaa J, Schubert EC, , et al. Value of diffusion-weighted MR imaging in the diagnosis of lymph node metastases in patients with cholangiocarcinoma. Abdom Radiol 2016; 41: 1937-1941.[2] Caraiani CN, Marian D, Militaru C, et al. The role of the diffusion sequence in magnetic resonance imaging for the differential diagnosis between hepatocellular carcinoma and benign liver lesions. Clujul Med 2016; 89: 241-249.
[3] Li S, Xue HD, Li J, et al. Application of whole body diffusion weighted MR imaging for diagnosis and staging of malignant lymphoma. Chin Med Sci J 2008; 23: 138-144.
[4] Mürtz P, Kaschner M, Träber F, et al. Diffusion-weighted whole-body MRI with background body signal suppression: technical improvements at 3.0 T. J Magn Reson Imaging 2012; 35:456-461.
[5] Takahara T, Imai Y, Yamashita T, et al. Diffusion weighted whole body imaging with background body signal suppression (DWIBS): technical improvement using free breathing, STIR and high resolution 3D display. Radiat Med 2004; 22:275-282.
Figures
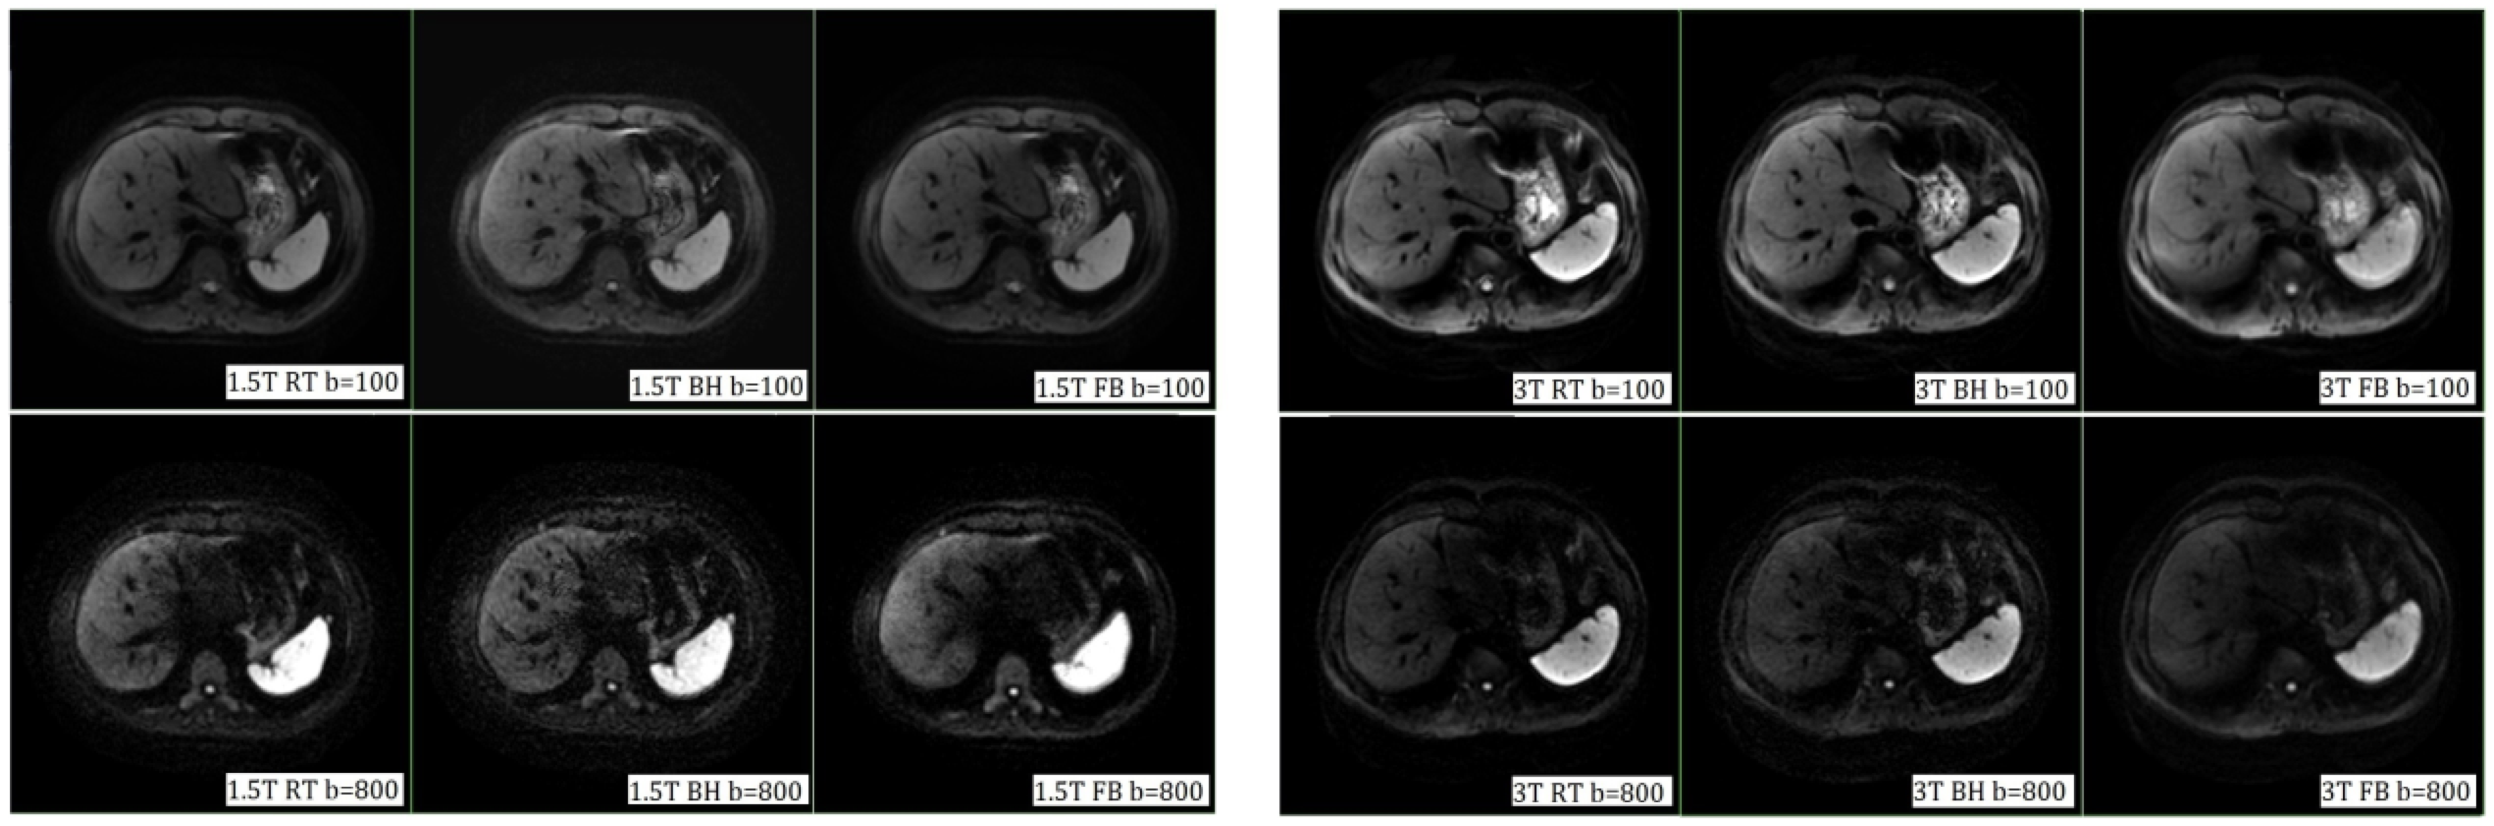
Fig.1 Images obtained from three different DWIs using both 1.5T and 3T. The artifacts
were higher with a b value of 800 s/mm2 than of 100 s/mm2,
and the artifacts of 3T MRI were greater than 1.5T. The upper row b = 100s/mm2,
and the lower row b = 800s/mm2. The left figure was from 1.5T, and
the right figure was from 3T. RT, respiratory-triggered DWI; BH, breath-hold DWI; FB,
free-breathing DWI.
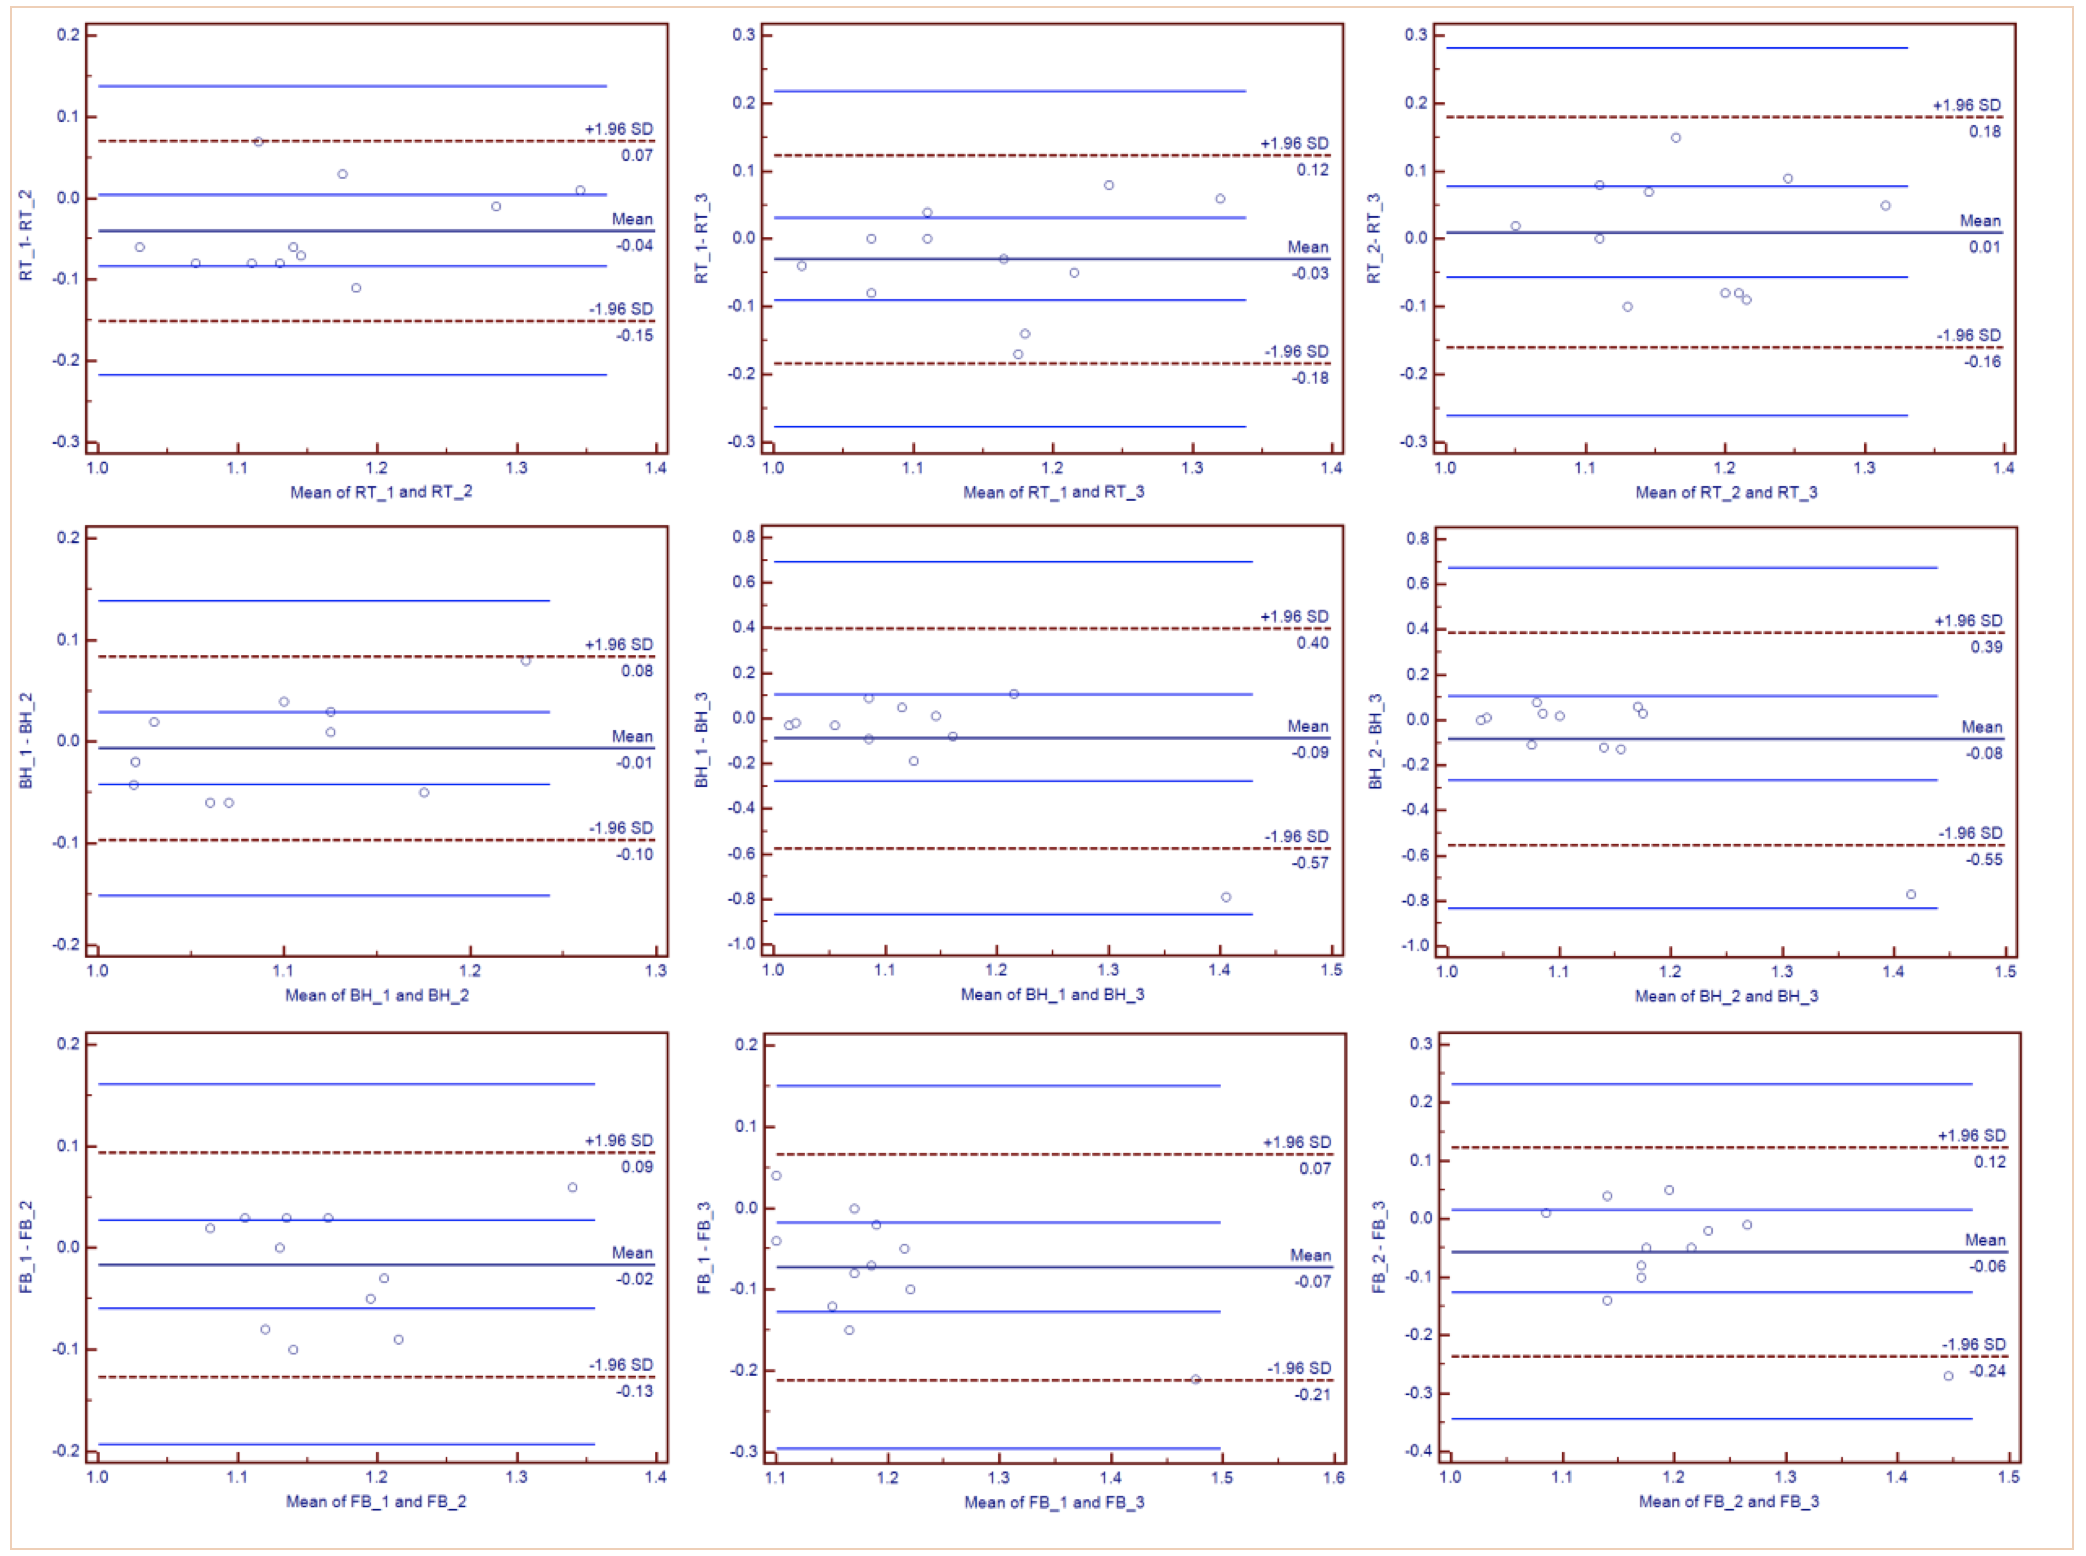
Fig.2 Bland-Altman plots of ADC measurements of the normal liver parenchyma in
respiratory-triggered (RT), breath-hold (BH), and free-breathing (FB) DWI. The
difference of ADC measurements (y-axis) is plotted against mean ADC measurement
(x-axis) between two series of each acquisition, with mean absolute difference
(mean bias) (continuous line) and 95% confidence interval of the mean
difference (limits of agreement) (dashed lines). ADC values on X and Y axes are
(×10-3mm2/s).
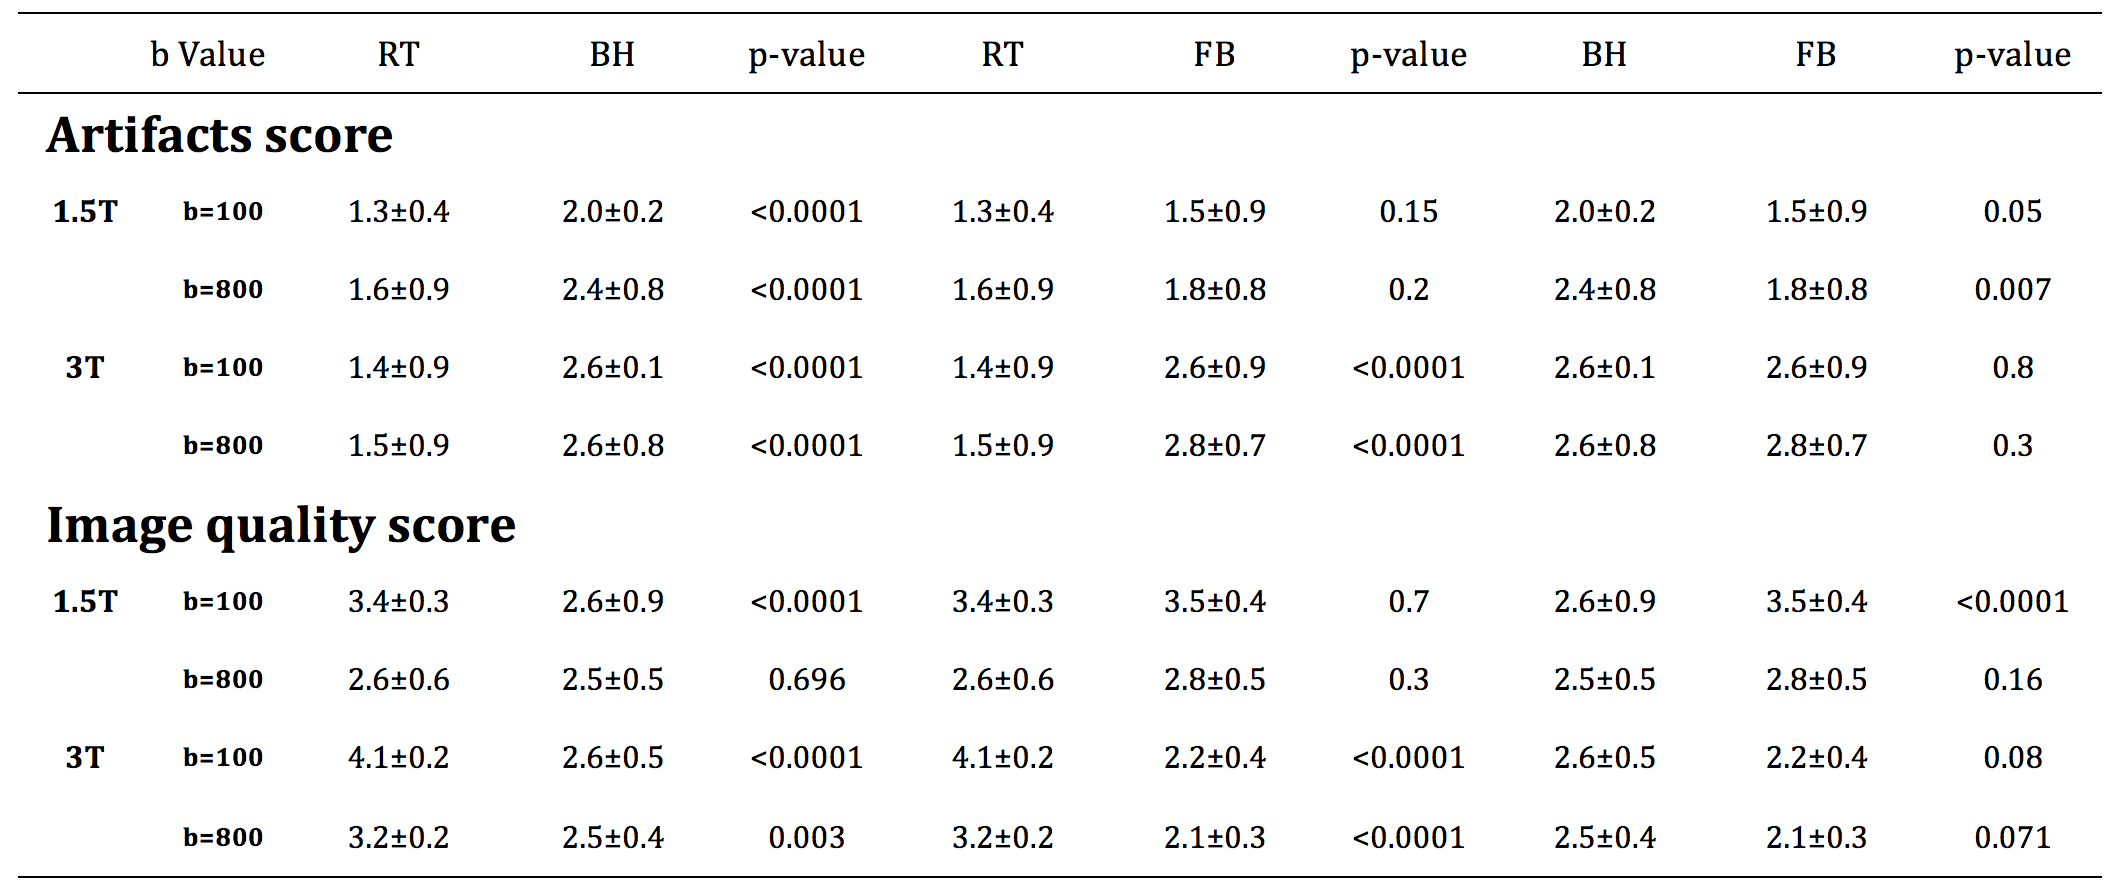
Table 1 Comparison of artifact and image quality scores of three DWI at
different field strength.
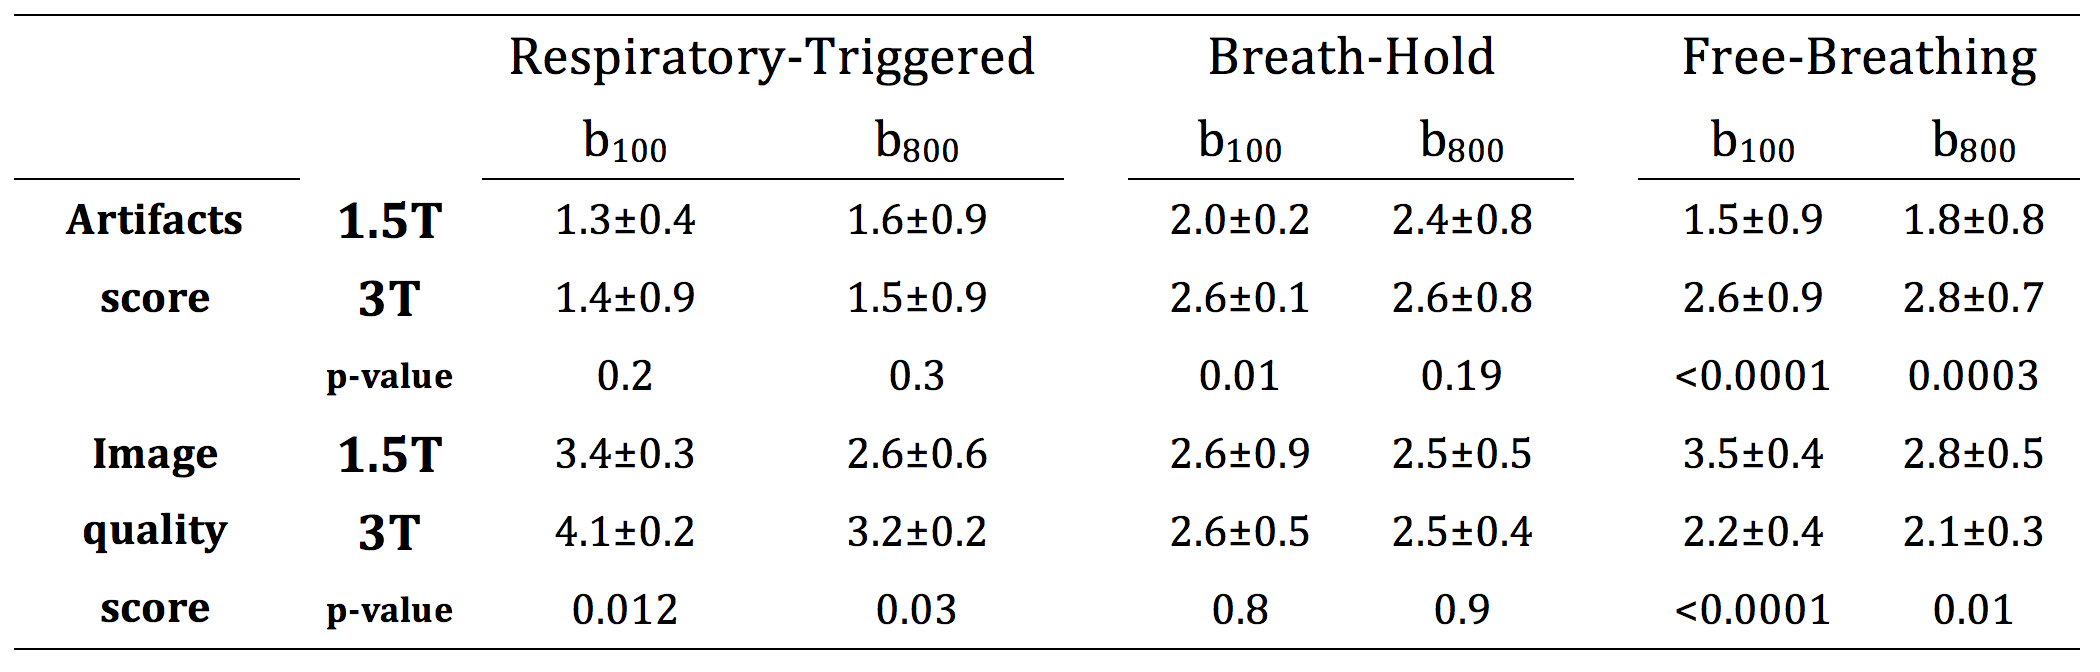
Table 2
The artifact and image quality scores of three DWI between
different field strength.
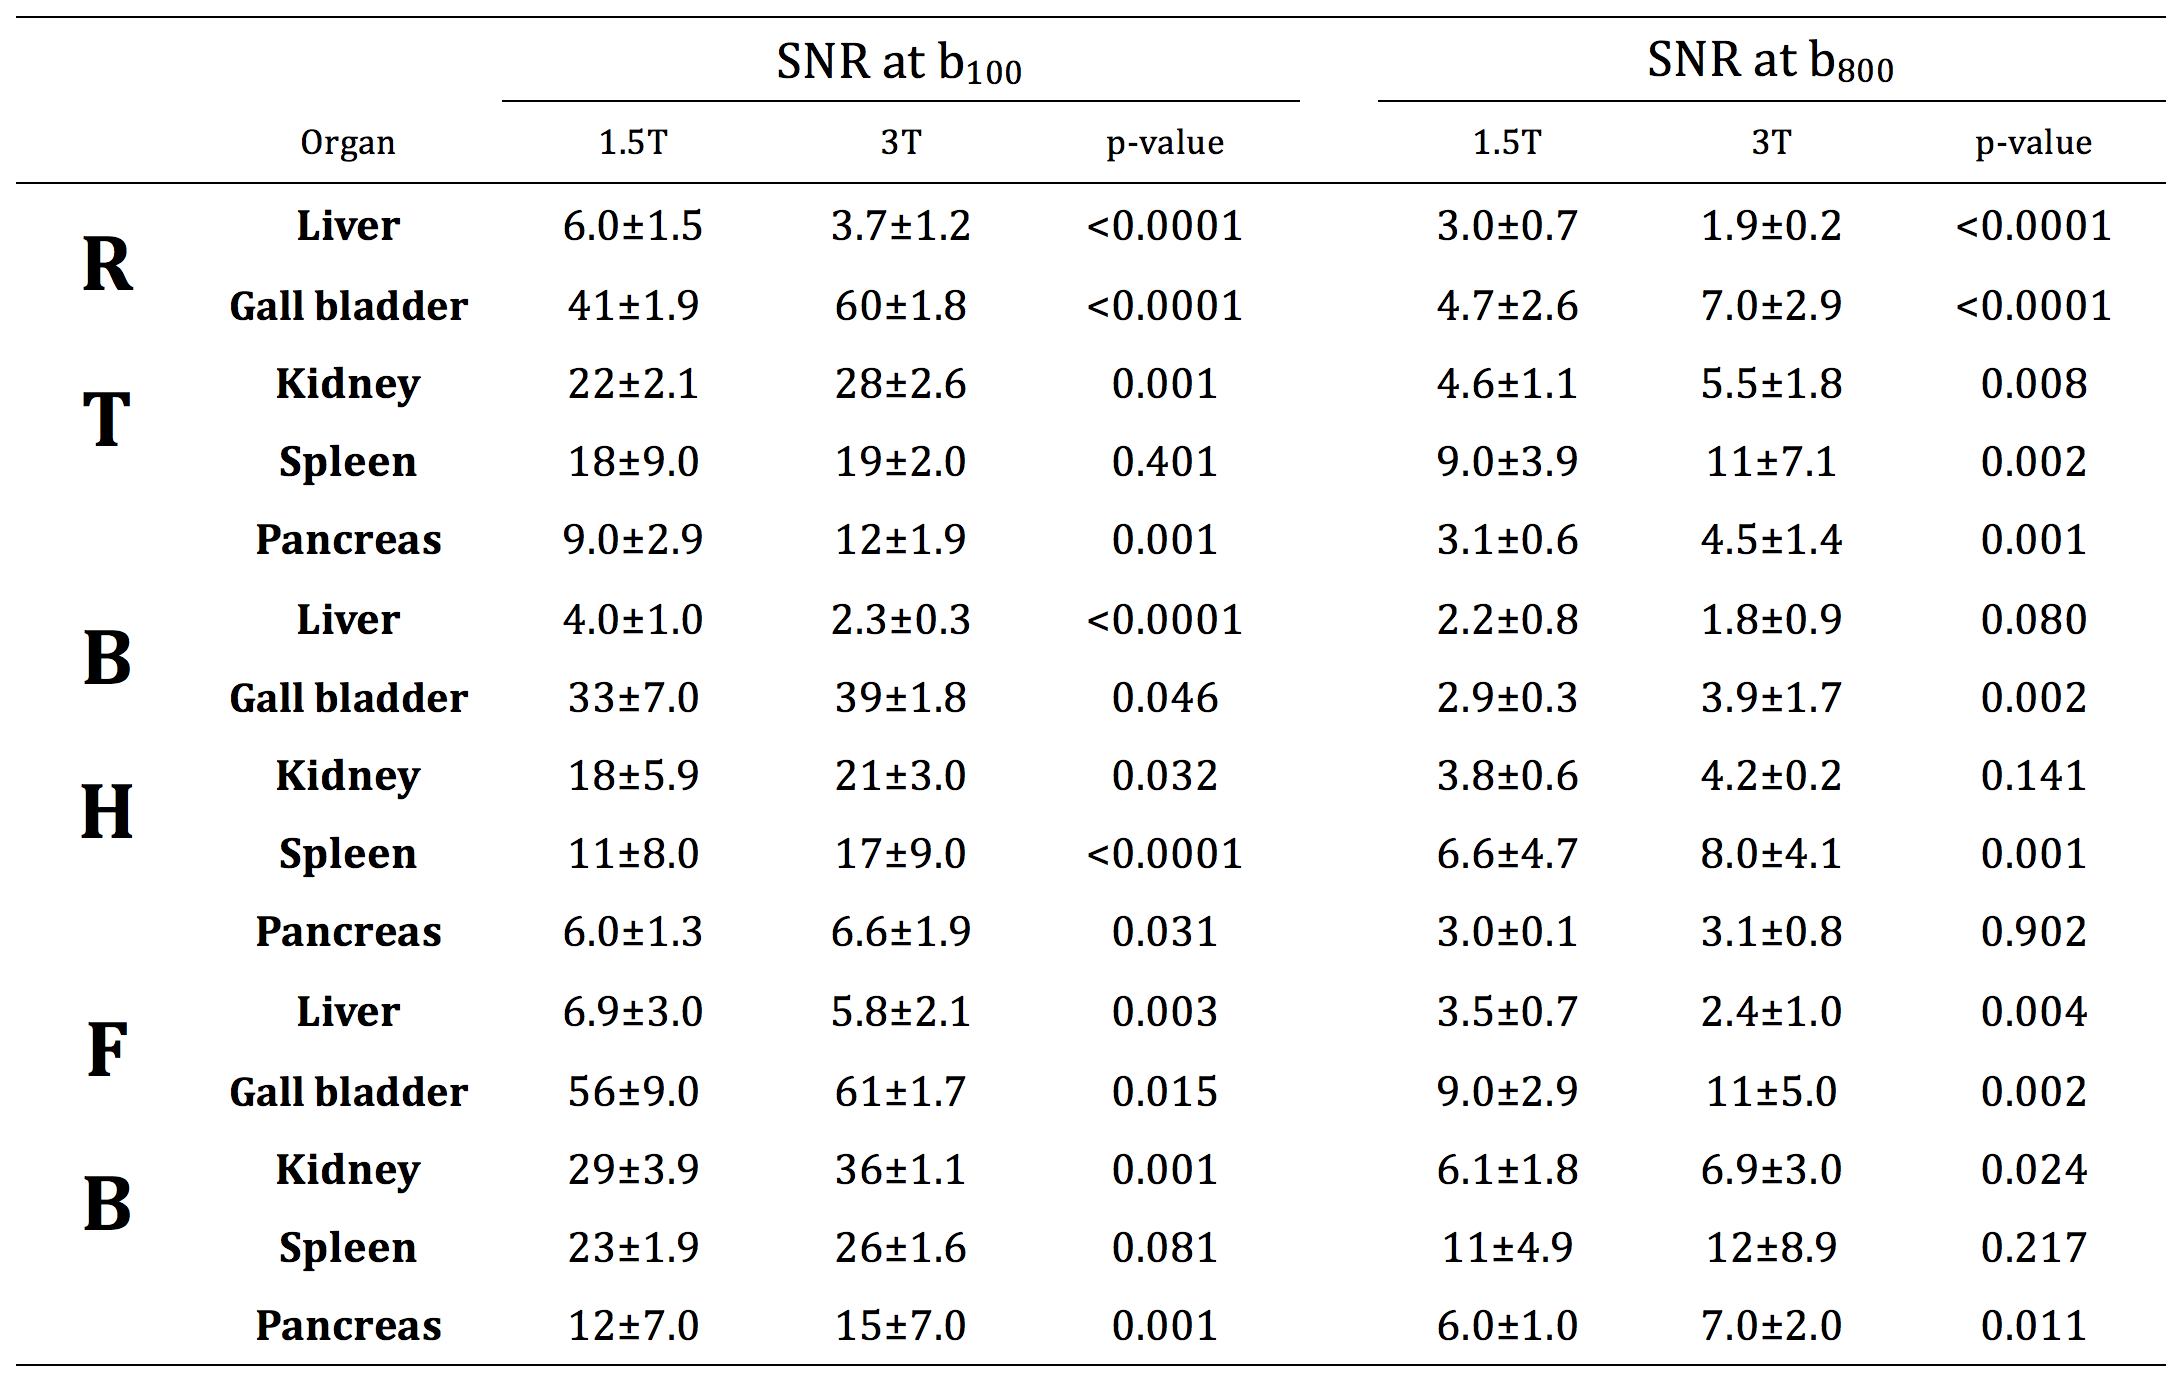
Table 3
Comparison of the SNR of different organs in upper abdomen between
1.5T and 3T.
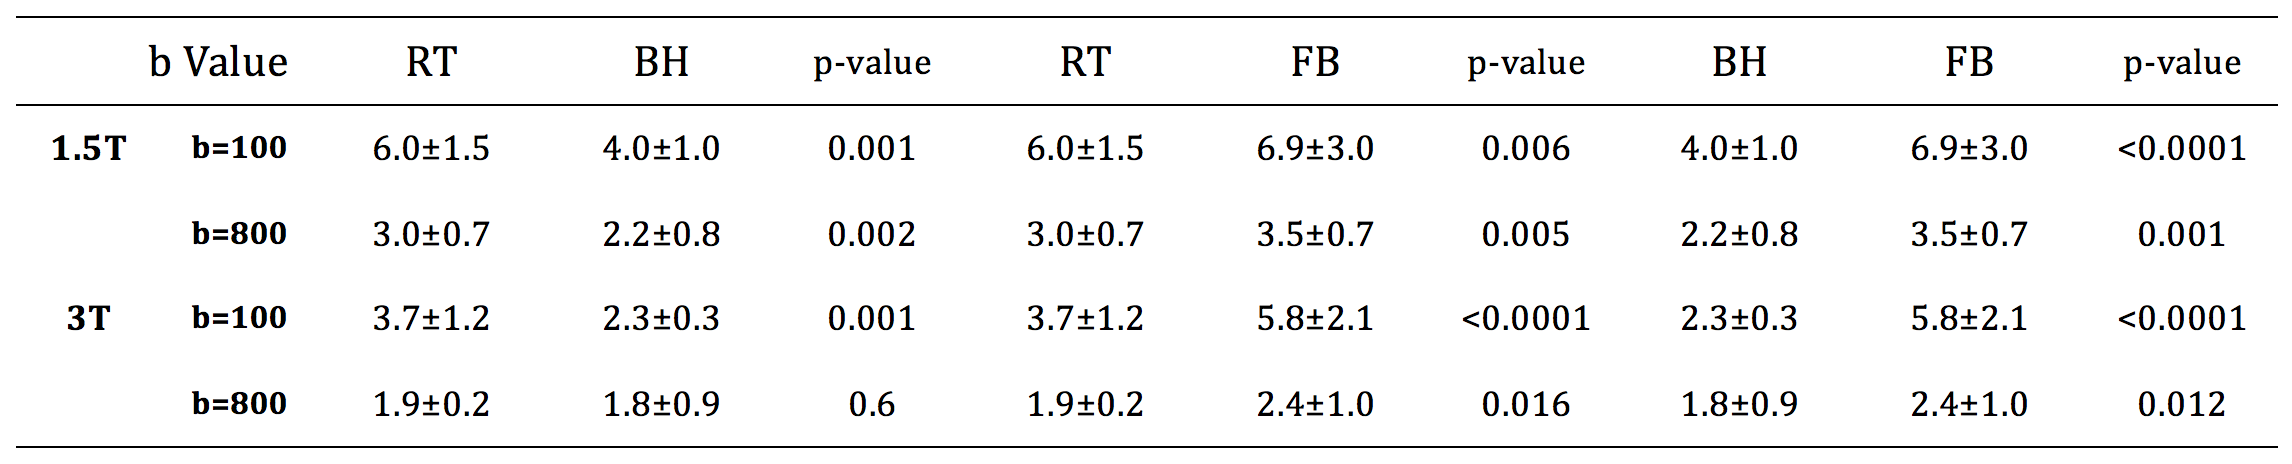
Table 4
Comparison of the liver SNR of the three DWIs at 1.5T and 3T.
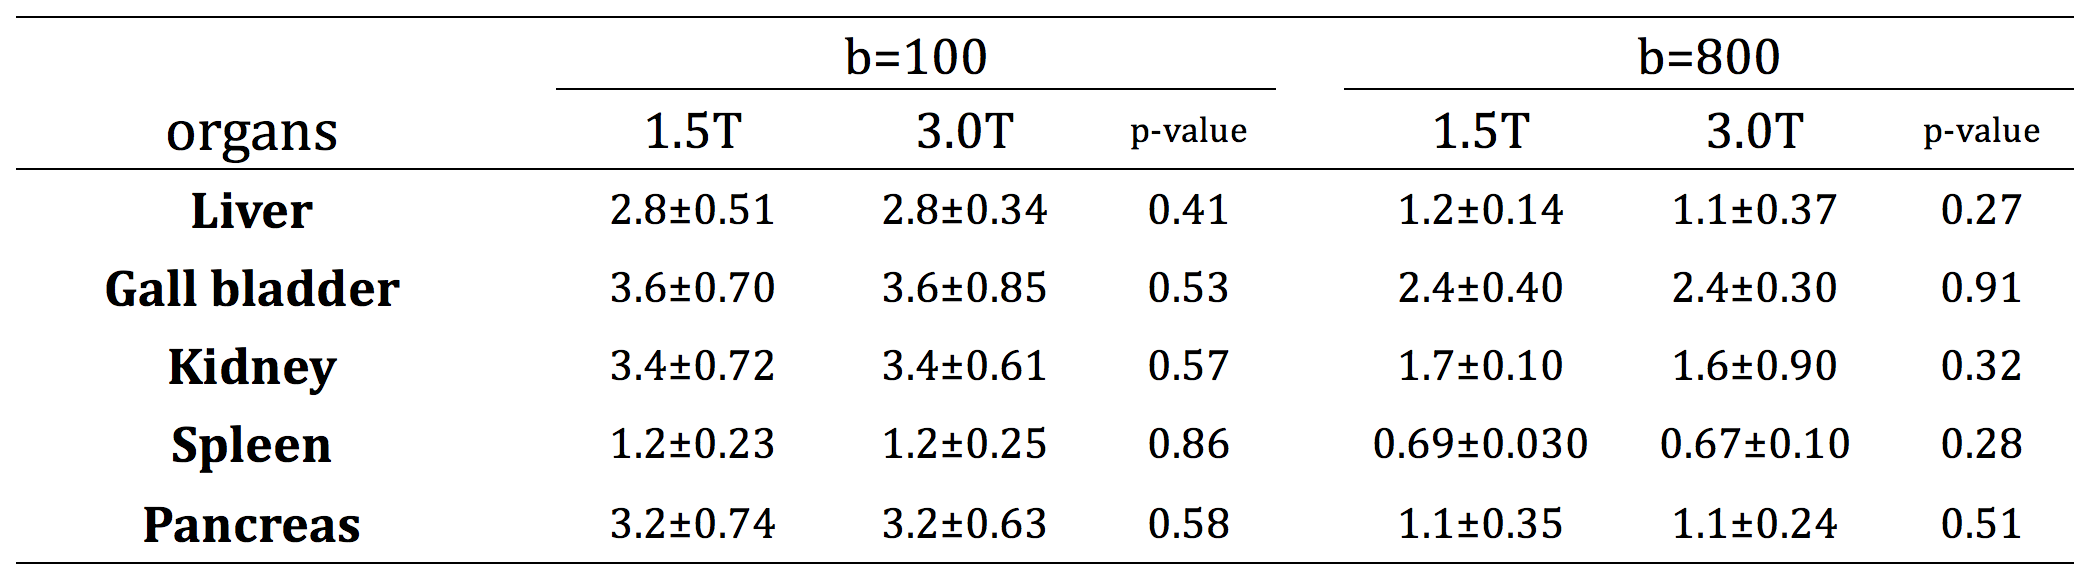
Table 5
Comparison of ADC value of normal organs in upper abdomen between
two field strengths when b values were 100 s/mm2
and 800 s/mm2, respectively.