3525
Diffusion weighted multi-spin echo sequence fuses T2-relaxometry and diffusometry1Center for Advanced Imaging Innovation and Research (CAI2R), NYU School of Medicine, New York, NY, United States, 2Center for Biomedical Imaging, Dept of Radiology, NYU School of Medicine, New York, NY, United States, 3Siemens Medical Solutions, New York, NY, United States
Synopsis
Combination of diffusion weighted MRI with orthogonal measures such as T$$$_2$$$-weighting has been proposed to overcome the fit degeneracy found in microstructure modeling of diffusion signals. However, the repetition of diffusion measurements at different TE leads to unacceptably long acquisition times, hindering clinical applicability of this approach. Here, we propose an accelerated acquisition using a multi spin echo diffusion and T$$$_2$$$-weighted sequence which samples each diffusion weighting at several TEs with a CPMG read-out train after the standard monopolar diffusion encoding spin echo. In the current configuration this speeds the acquisition up by a factor of 2.5x.
Purpose
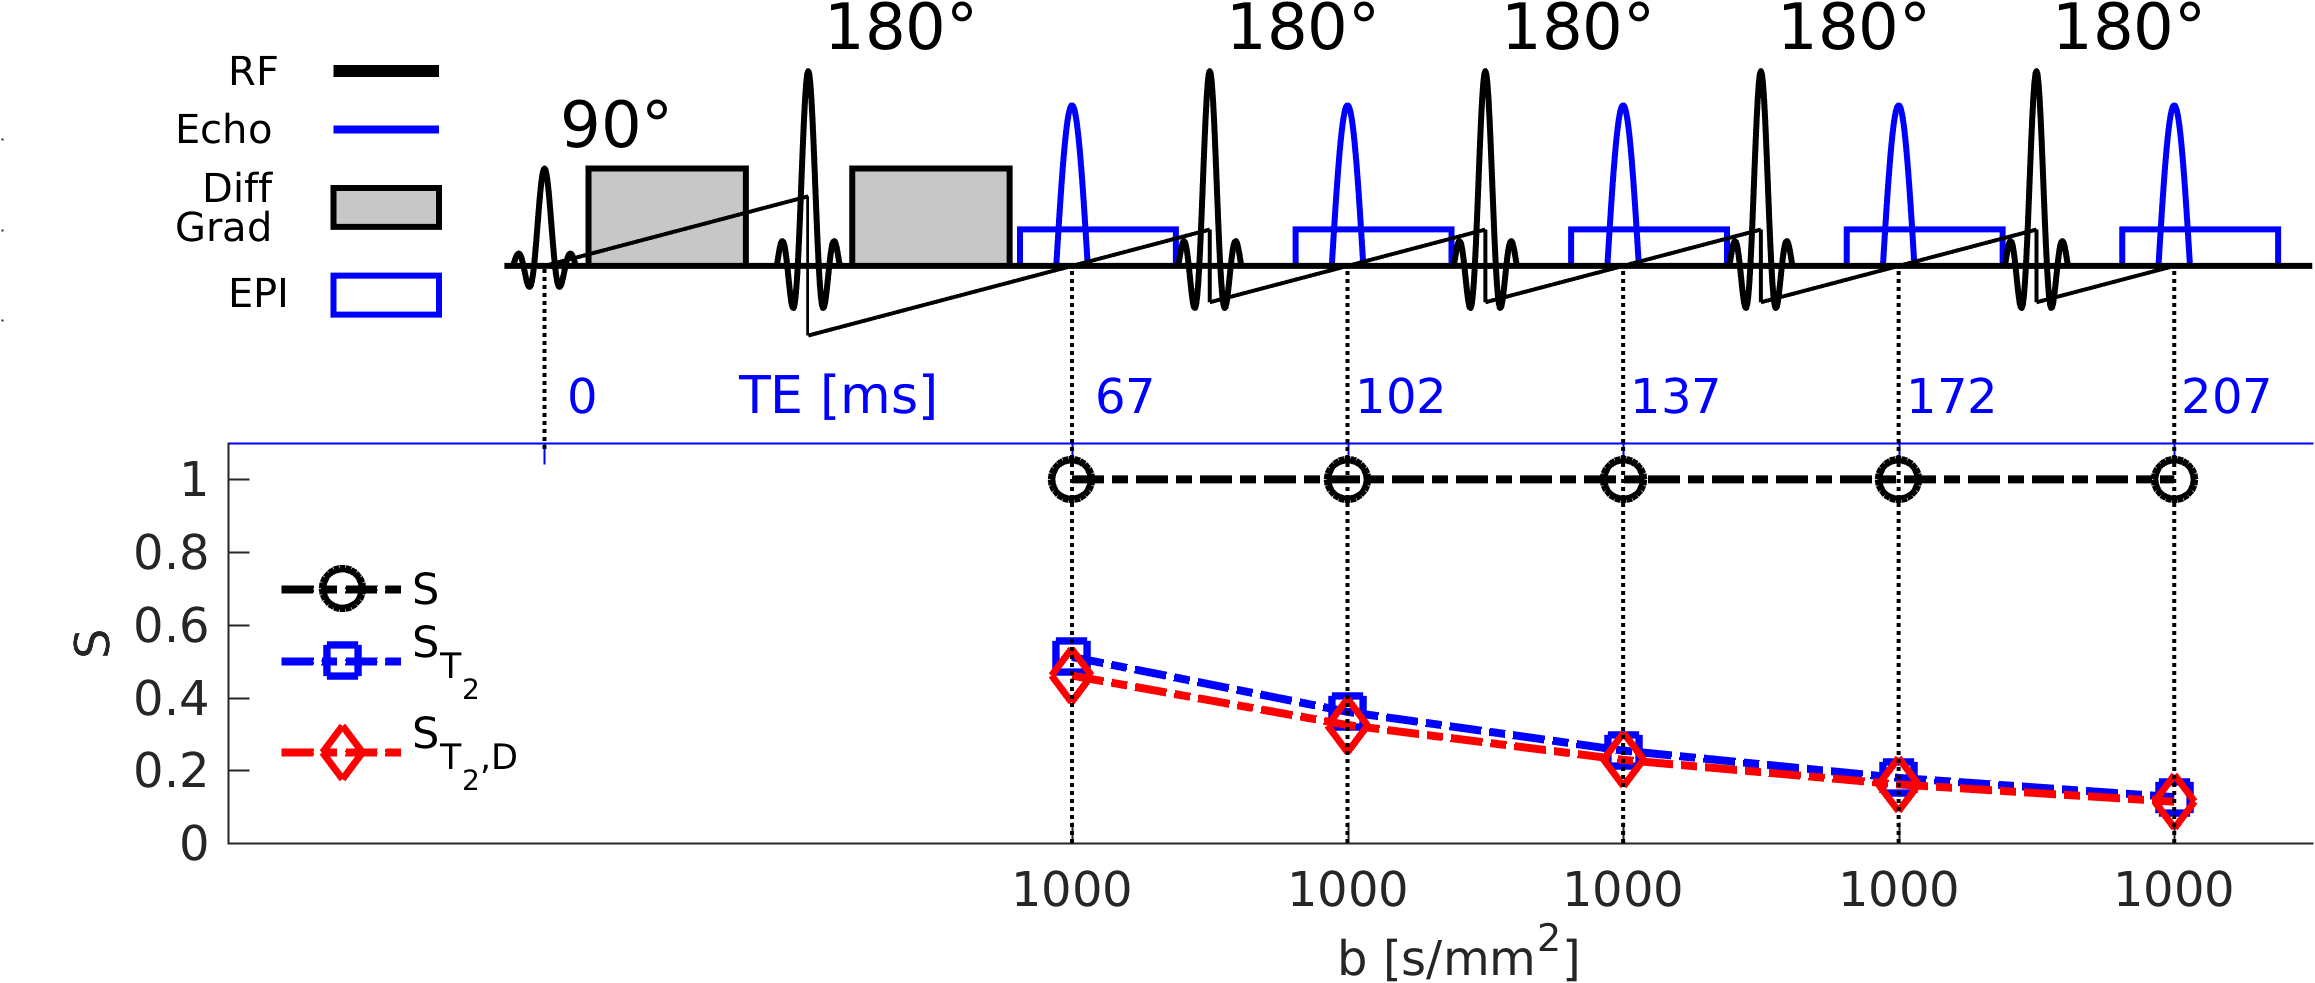
Microstructural modeling of diffusion weighted MRI aims to quantify mesoscopic features probing the white matter integrity [1-4]. These features might serve as sensitive and specific biomarkers of microstructural changes associated with brain development, aging and pathology. Recent work shows however that even fairly simple multi-compartment diffusion models do not provide unique plausible solutions [5]. A potential remedy is the addition of orthogonal information provided by a range of diffusion times [6], advanced $$$b$$$-tensor encoding [7] or the addition of T$$$_1$$$, T$$$_2^*$$$ or T$$$_2$$$ weightings [8-14]. To combine diffusion and T$$$_2$$$ relaxometry [8], diffusion acquisitions need to be repeated at different echo times (TE) thus necessitating an unacceptably slow measurement.Here, we propose an accelerated fused T$$$_2$$$-relaxometry-diffusometry acquisition. In our approach we acquire for each diffusion weighting multiple full 2D EPI $$$k$$$-spaces for each of several TE in a multi spin echo sequence (Fig 1). This translates to a 2.5x reduction in scan time. In this work we demonstrate the feasibility of accelerating T$$$_2$$$-relaxometry-diffusometry by using a multi spin echo sequence in vivo in a clinical 3T scanner.
Methods
Sequence: In the proposed custom-made multi spin echo EPI diffusion sequence (Fig 1), the monopolar gradients in the initial 90°-180° spin-echo block apply diffusion encoding and an initial spin echo image is acquired with an EPI readout train. The subsequent 180° RF-pulses form a CPMG spin echo train repeatedly refocusing the diffusion weighted signal at increasing TE where subsequent identical EPI readouts are performed. All echoes in the readout-train have similar diffusion weighting, but distinct TE. To avoid unwanted ghost-echoes, a non-repeating set of crushers is added to all 180° pulses on all three gradient axes. Flip angle imperfections accumulate in the CPMG train and add up to a non-negligible reduction in signal amplitude. This effect is corrected by isolating the impact of each 180° RF pulse from the non-diffusion-weighted $$$b_0$$$-image and a set of $$$b_0$$$-correction images with carefully chosen echo time combinations. All gradients, both diffusion and imaging, are included in the calculation of the $$$b$$$-matrices. The MSE-EPI pulse sequence proposed here would be the first to integrate full k-space single shot EPI with a combined diffusion and T$$$_2$$$-weighting.Results and Discussion
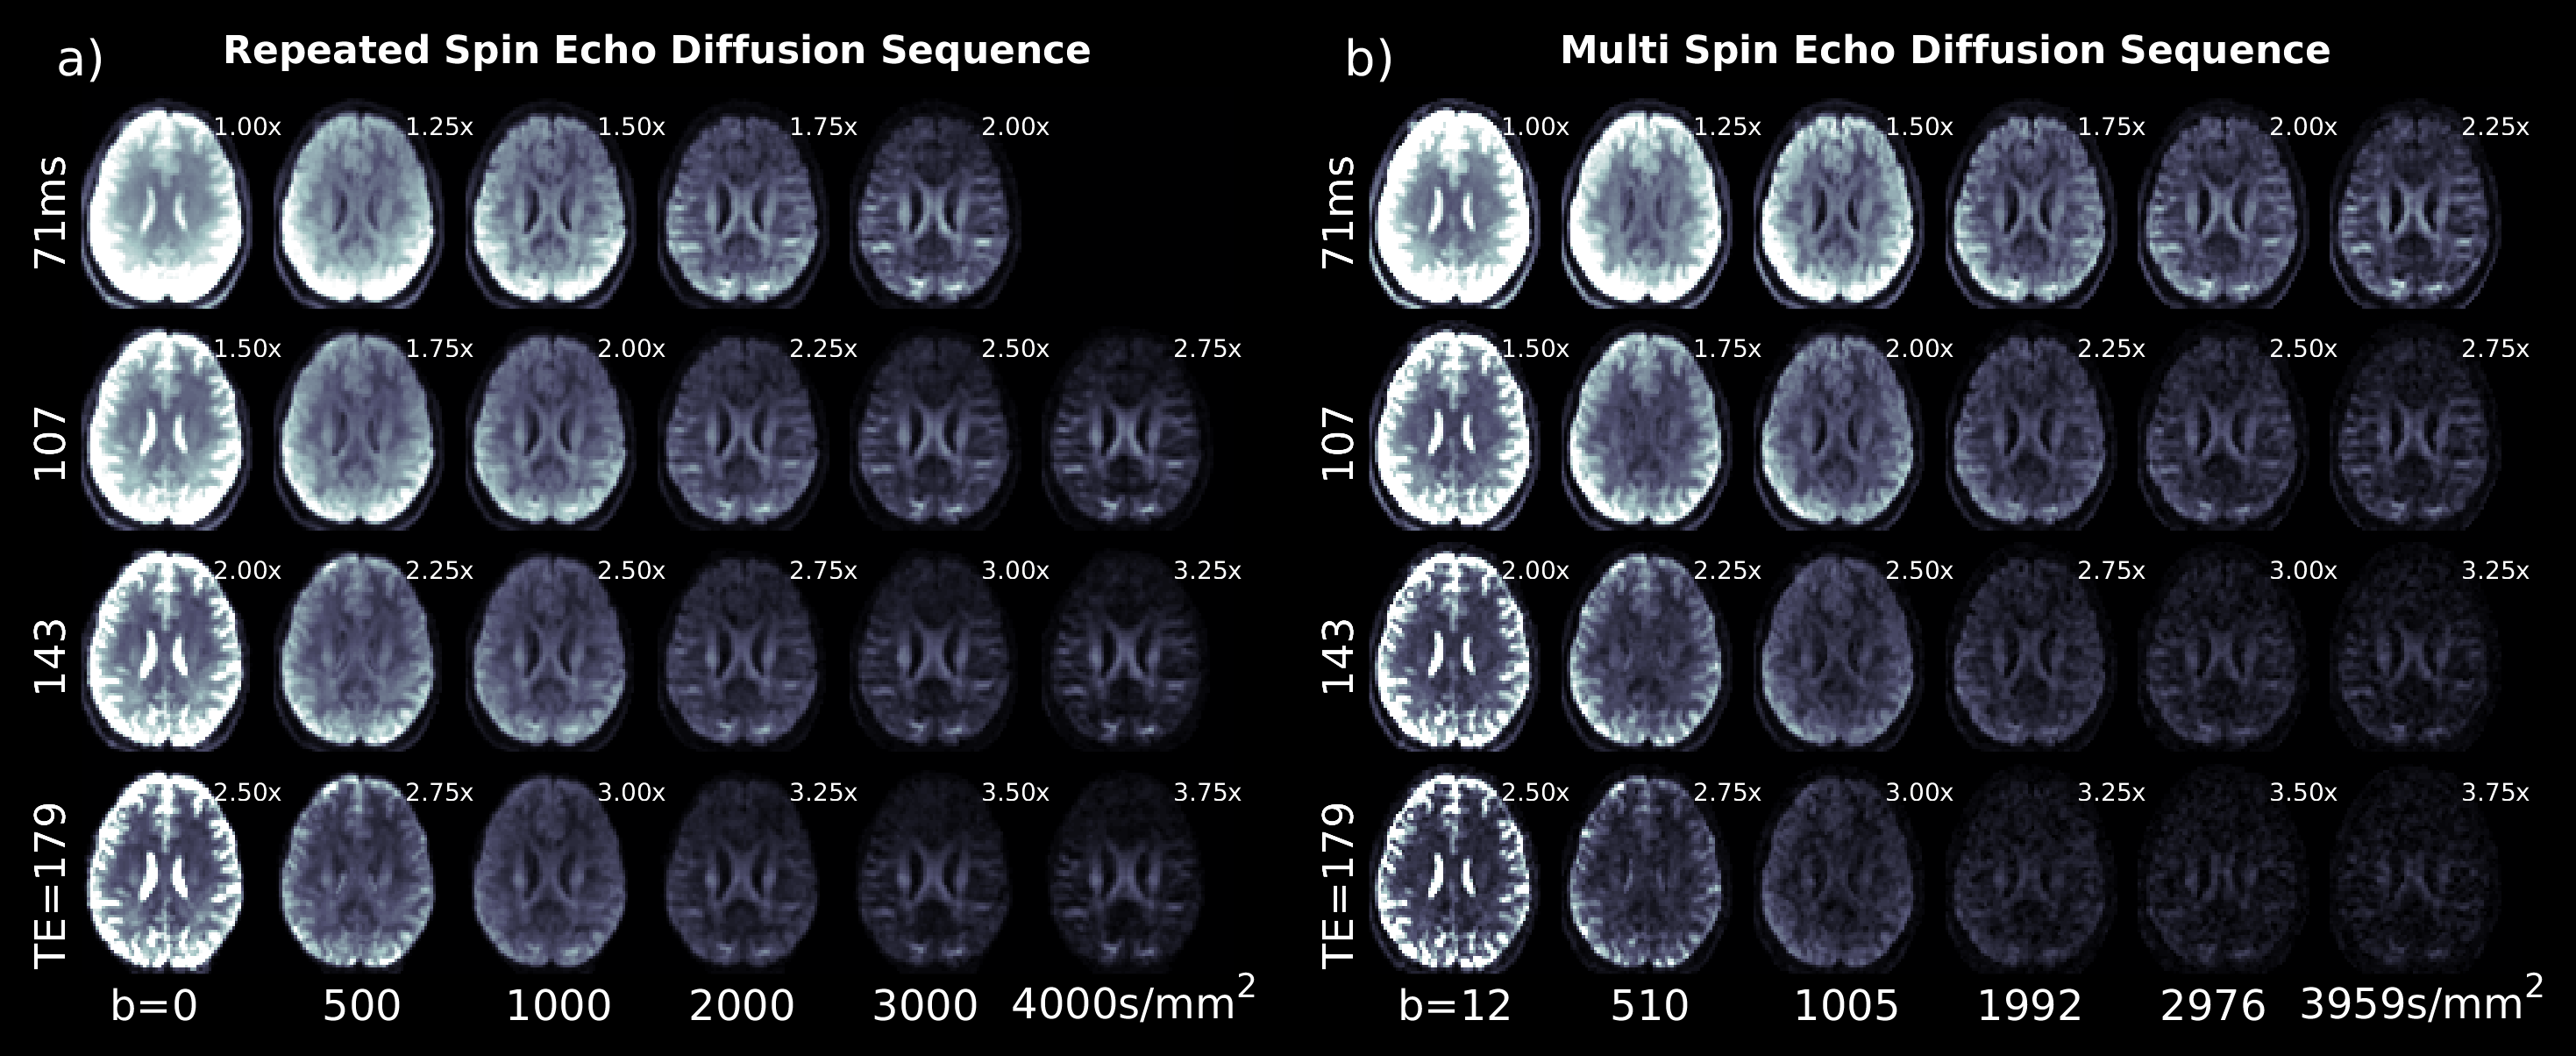
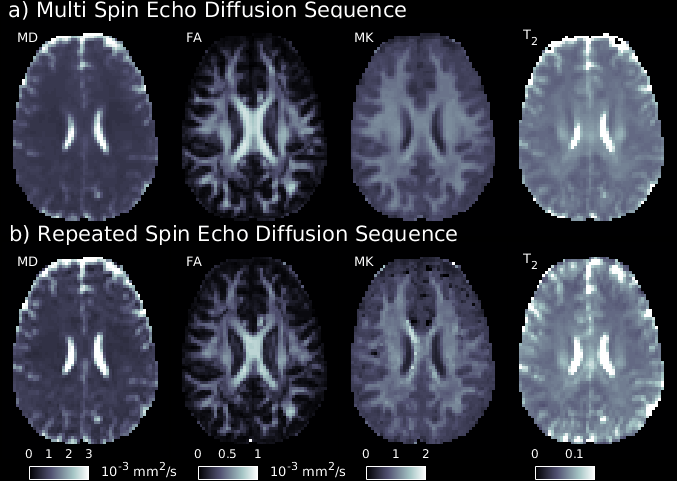
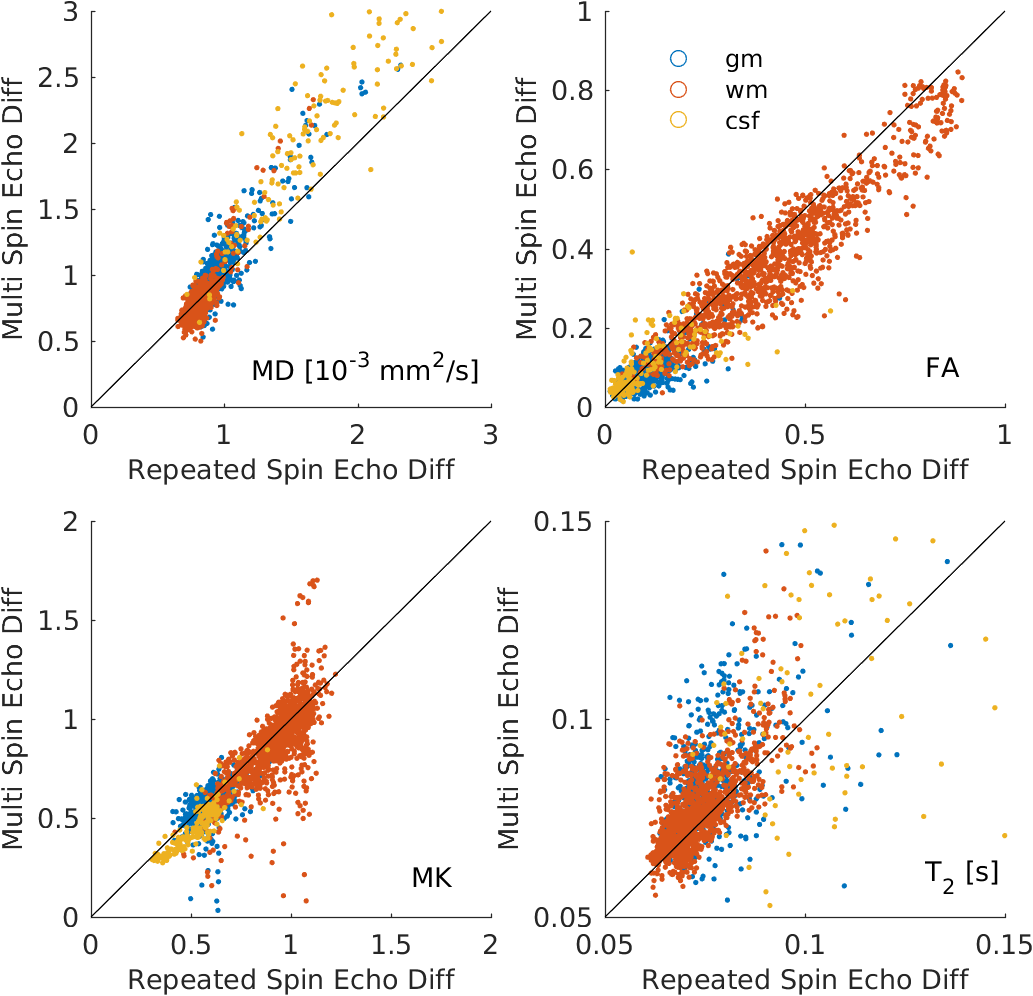
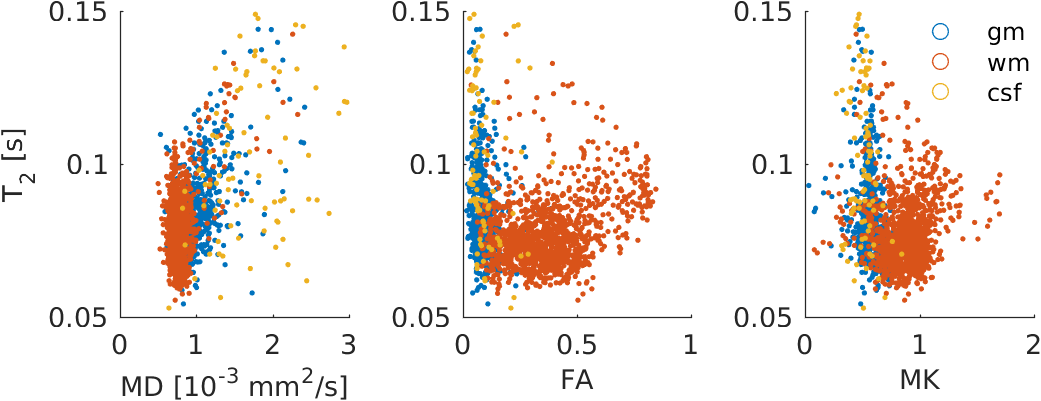
Fig. 2 compares raw diffusion and T$$$_2$$$-weighted images of the SE and MSE-EPI sequences. Image contrast is the same, though SNR is lower in the high TE, high $$$b$$$-value images of the MSE-EPI sequence as can be expected. Similarly, parameter maps (Fig. 3) are comparable with the exception of a minor slice misalignment. ADC-values of the MSE-EPI sequence are higher due to the lower (constant) diffusion time relative to the SE-EPI where the diffusion time increases with TE. Some differences in the Mean Kurtosis map (Fig. 3, MK) are caused by an ill-conditioned DKI-fit due to lower SNR in high $$$b$$$-value, high TE MSE-EPI images. Good agreement of both acquisitions is evident in a voxel-by-voxel direct comparison of the DKI and T$$$_2$$$-parameters (Fig. 4). Scatterplots of these DKI and T$$$_2$$$-parameters illustrate the value of T$$$_2$$$-relaxometry as an orthogonal measure in combination with a diffusion acquisition.Conclusion
With a multi spin echo sequence the combination of diffusion and T$$$_2$$$-weighted measurements can be fused in a single readout train, thus accelerating the acquisition with a factor 2.5. This shortened acquisition time increases the feasibility of orthogonal diffusion-T$$$_2$$$ acquisitions in research and clinical applications.Acknowledgements
This project is supported in part by PHS grants R01-CA111996, R01-NS082436 and R01-MH00380.References
[1] Novikov DS, Kiselev VG, Jespersen SN. On modeling. Magn. Reson. Med. 2018; 79(6):3172-3193.[2] Novikov D, Jespersen SN, Kiselev VG, Fieremans E. Quantifying brain microstructure with diffusion MRI:Theory and parameter estimation. ArXiv preprint 2016;arXiv:1612.02059.
[3] Jespersen, S. N., Kroenke, C. D., Ostergaard, L., Ackerman, J. J., Yablonskiy, D. A.. Modeling dendrite density from magnetic resonance diffusion measurements. Neuroimage 2007; 34 (4), 1473–1486.
[4] Jelescu IO, Budde MD. Design and validation of diffusion MRI models of white matter. Front Phys 2017;28.
[5] Jelescu IO, Veraart J, Fieremans E, Novikov D. Degeneracy in model parameter estimation for multi-compartmental diffusion in neuronal tissue. NMR in biomedicine 2016;29:33-47.
[6] Fieremans E, Burcaw LM, Lee H-H, Lemberskiy G, Veraart J, Novikov D. In vivo observation and biophysical interpretation of time-dependent diffusion in human white matter. NeuroImage 2016;129:414-427.
[7] Westin CF, Knutsson H, Pasternak O, Szczepankiewicz F, Ozarslan E, van Westen D, Mattisson C, Bogren M, O'Donnel LJ, Kubicki M, Topgaard D, Nilsson M. Q-space trajectory imaging for multidimensional diffusoin MRI of the human brian. NeuroImage 2016;135:345-362.
[8] Veraart J, Novikov DS, Fieremans E. TE dependent Diffusion Imaging (TEdDI) distinguishes between compartmental T2 relaxation times. NeuroImage 2017.
[9] Kim D, Doyle EK, Wisnowski JL, Kim JH, Haldar JP. Diffusion-relaxation correlation spectroscopic imaging: A multidimensional approach for probing microstructure. Magn. Res. Med. 2017;78:2236-49.
[10] Pizzolato M, Canales-Rodriguez E, Daducci A, Thiran J. Multimodal microstructure imaging: joint T2-relaxometry and diffusometry to estimate myelin, intracellular, extracellular, and cerebrospinal fluid properties. Proc Intl Soc Mag Reson Med; 2018; Paris, France. p. 3118.
[11] Li Y, Kim M, Lawrence T, Hemant P, Cao Y. Analysis of the T2-Relaxation-Diffusion Correlation MRI in Glioblastoma. Proc Intl Soc Mag Reson Med; 2018; Paris, France. p. 3100.
[12] Farrher E, Buschbeck R, Choi C-H, et al. In vivo DTI-based free-water elimination with T2-weighting.Proc Intl Soc Mag Reson Med; 2018; Paris, France. p. 1629.
[13] Tax CMW, de Almeida Martins JP, Szczepankiewicz F, Westin CF, Chamberland M, Topgaard D, Jones DK. From physical chemistry to human brain biology: unconstrained inversion of 5-dimensional diffusion-T2 correlation data. 2018; Paris, France. p 1101.
[14] Hutter J, Slator PJ, Christiaens D, Teixeira RPAG, Roberts T, Jackson L, Price AN, Malik S, Hajnal JV. Integrated and efficient diffusion-relaxometry using ZEBRA. Sci Rep 2018;8:15138.
[15] Veraart J, Novikov DS, Christiaens D, Ades-aron B, Sijbers J, Fieremans E. Denoising of diffusion MRI using random matrix theory. NeuroImage 2016;142:394-406.
[16] Jenkinson M, Beckmann CF, Behrens TE, Woolrich MW, Smith SM. FSL. NeuroImage 2012;62:782–790.
Figures